Combo Backtest 123 Reversal & MACD Crossover This is combo strategies for get a cumulative signal.
First strategy
This System was created from the Book "How I Tripled My Money In The
Futures Market" by Ulf Jensen, Page 183. This is reverse type of strategies.
The strategy buys at market, if close price is higher than the previous close
during 2 days and the meaning of 9-days Stochastic Slow Oscillator is lower than 50.
The strategy sells at market, if close price is lower than the previous close price
during 2 days and the meaning of 9-days Stochastic Fast Oscillator is higher than 50.
Second strategy
MACD – Moving Average Convergence Divergence. The MACD is calculated
by subtracting a 26-day moving average of a security's price from a
12-day moving average of its price. The result is an indicator that
oscillates above and below zero. When the MACD is above zero, it means
the 12-day moving average is higher than the 26-day moving average.
This is bullish as it shows that current expectations (i.e., the 12-day
moving average) are more bullish than previous expectations (i.e., the
26-day average). This implies a bullish, or upward, shift in the supply/demand
lines. When the MACD falls below zero, it means that the 12-day moving average
is less than the 26-day moving average, implying a bearish shift in the
supply/demand lines.
A 9-day moving average of the MACD (not of the security's price) is usually
plotted on top of the MACD indicator. This line is referred to as the "signal"
line. The signal line anticipates the convergence of the two moving averages
(i.e., the movement of the MACD toward the zero line).
Let's consider the rational behind this technique. The MACD is the difference
between two moving averages of price. When the shorter-term moving average rises
above the longer-term moving average (i.e., the MACD rises above zero), it means
that investor expectations are becoming more bullish (i.e., there has been an
upward shift in the supply/demand lines). By plotting a 9-day moving average of
the MACD, we can see the changing of expectations (i.e., the shifting of the
supply/demand lines) as they occur.
WARNING:
- For purpose educate only
- This script to change bars colors.
Trendanalyse

T3MA_KC_7ye StrategyThis script uses KC and a T3 moving average
A red background is a bear market
A bull market is when the background is green
The main idea is the average of the bend and KC channel breakthrough
这个脚本使用了KC以及T3均线
背景为红色时是熊市
背景为绿色时是牛市
主要思路是均线的拐头以及KC通道的突破

Simple Heiken Ashi Stop and Reverse Trading on FuturesThis is the initial version of the Heikein Ashi Strategy.
It calculates the Heiken Ashi values for the candlestick charts displayed on the screen and generates alerts/trades based on the actual value in the candlestick chart.

Combo Backtest 123 Reversal & Line Regression Intercept This is combo strategies for get a cumulative signal.
First strategy
This System was created from the Book "How I Tripled My Money In The
Futures Market" by Ulf Jensen, Page 183. This is reverse type of strategies.
The strategy buys at market, if close price is higher than the previous close
during 2 days and the meaning of 9-days Stochastic Slow Oscillator is lower than 50.
The strategy sells at market, if close price is lower than the previous close price
during 2 days and the meaning of 9-days Stochastic Fast Oscillator is higher than 50.
Second strategy
Linear Regression Intercept is one of the indicators calculated by using the
Linear Regression technique. Linear regression indicates the value of the Y
(generally the price) when the value of X (the time series) is 0. Linear
Regression Intercept is used along with the Linear Regression Slope to create
the Linear Regression Line. The Linear Regression Intercept along with the Slope
creates the Regression line.
WARNING:
- For purpose educate only
- This script to change bars colors.

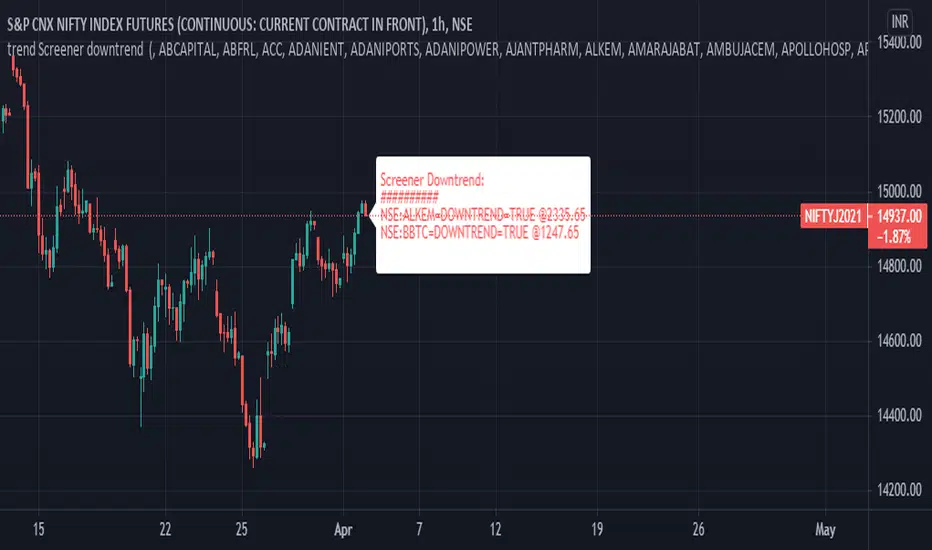
trend Screener downtrendthis is in continuation with - previous trend screener i have published, In this code only downtrend screener is there ,This is type of custom screener I searched and made to screen bulk stocks any one can modify it, other may get help out of it.
you can change or add new symbol in input section.
in my code i have made defined and printed last close price when downtrend was true.
1. downtrend = ema (close,55)< ema (close,144) and ema (close,144)< ema (close,388) and ema (close,388)<ema(close,576) and close<ema(close,388)
if the indicator is printing DOWNTREND=TRUE or UPTREND=TRUE then the corresponding stock is in currently in that trend out of the stocks listed in the code
in one code only 40 (max) stocks can be called.
to add more stocks I copied same code and changed the stocks in the code, now you can screen 80 stocks at a time.
This code runs on each bar and checks if the stocks is in uptrend or down trend.
you can customize this screener according to your requirement.
Double EMA CROSS
Double EMA CROSS (DEC)
Useful for identifying and receiving alerts about uptrends and downtrends.
This script uses two Exponential Moving Averages (EMAs) to find price uptrends and downtrends.
An Exponential Moving Average ( EMA ) is a type of moving average that places a greater weight and significance on the most recent data points.
The script produces uptrend and downtrend signals based on crossovers and divergences between the two EMAs,
the user will be able to spot a trend change (when the EMAs crossover) and to determine the strength of the current trend (when the EMAs diverge).
It is also posible to get alerts for uptrends and downtrends on the web and mobile app with sound and pop-ups as well as via email.
The optimal time to enter and exit the market can be concluded from this trend changes.
The user can set their own EMAs, by default they are set to 25 and 75 periods for medium and long term respectively.
When the medium term EMA crosses below the long term EMA the asset is in a downtrend and the price will decline, and when the
medium term EMA crosses above the long term EMA the asset is in an uptrend and price will increase.
This scripts plots the following indicators and signals on the chart to help the user to identify trends:
1.- Medium and long term EMAs as lines overlaid on the price chart.
2.- Up green triangles above bars when the price is on an uptrend and down red triangles below bars when the price is on a downtrend.
3.- Arrows with text to indicate the start of an uptrend or downtrend.
The user can enable and disable the indicators and signals as well as set colors and shapes to their liking.
This script also lets the user create alerts for uptrends and downtrends. To create a new alert using this script follow this instructions:
1.- Once you added this script to your chart, go to the alerts panel (right on web or bottom tool bar on the mobile app) and add a new alert (alarm clock icon with a plus sign).
2.- A modal window will open. On the “Condition” dropdown menu select “DEC”.
3.- On the next dropdown menu (right below the “Condition” one) you can select.
4.- Lastly you can set all the normal alert options and create the alert.

Combo Backtest 123 Reversal & Laguerre-based RSI This is combo strategies for get a cumulative signal.
First strategy
This System was created from the Book "How I Tripled My Money In The
Futures Market" by Ulf Jensen, Page 183. This is reverse type of strategies.
The strategy buys at market, if close price is higher than the previous close
during 2 days and the meaning of 9-days Stochastic Slow Oscillator is lower than 50.
The strategy sells at market, if close price is lower than the previous close price
during 2 days and the meaning of 9-days Stochastic Fast Oscillator is higher than 50.
Second strategy
This is RSI indicator which is more sesitive to price changes.
It is based upon a modern math tool - Laguerre transform filter.
With help of Laguerre filter one becomes able to create superior
indicators using very short data lengths as well. The use of shorter
data lengths means you can make the indicators more responsive to
changes in the price.
WARNING:
- For purpose educate only
- This script to change bars colors.

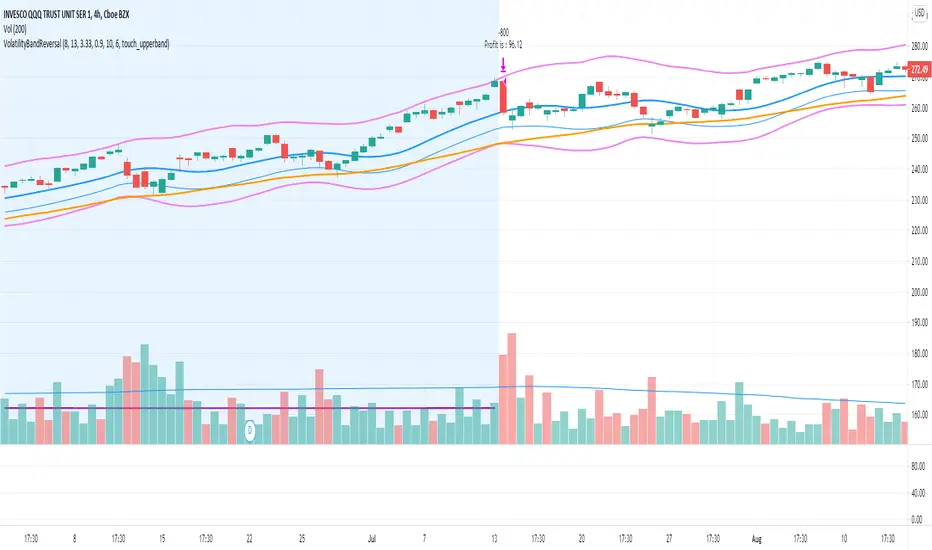
Volatility Bands Reversal Strategy [Long Only]This strategy based on existng indicator available on TV
If finds the reversals for LONG entries ... I have modified the settings to back test it ...
BUY
====
When the price touches lower band , and tries to close above lower band
some signals are mixed up, you can research and look for a confirmation ...
if the middle band is above EMA50 , you can simply follow the strategy BUY signal
but if the middle band is EMA50 , wait for the price to close above middle band
Sell / Close
==========
wait for the sell signa OR close when price touches the upper band
How do you want to close , you can chose in settings. Chnage these values and see the performance
Please note , sell means just closing the existing LONG position , not short selling
Stop Loss
=========
Stop Loss is defaulted to 6%
This is tested in 1HR, 2HR and 4 HRs chart for SPY and QQQ ETFS ...
for long term investing style , 4 Hrs is the best time frme for this strategy
Warning
========
It is not a financial advise , it is for educational purposes only. Please do your own research before taking any trading decission
Combo Backtest 123 Reversal & Signal To Noise This is combo strategies for get a cumulative signal.
First strategy
This System was created from the Book "How I Tripled My Money In The
Futures Market" by Ulf Jensen, Page 183. This is reverse type of strategies.
The strategy buys at market, if close price is higher than the previous close
during 2 days and the meaning of 9-days Stochastic Slow Oscillator is lower than 50.
The strategy sells at market, if close price is lower than the previous close price
during 2 days and the meaning of 9-days Stochastic Fast Oscillator is higher than 50.
Second strategy
The signal-to-noise (S/N) ratio.
And Simple Moving Average.
WARNING:
- For purpose educate only
- This script to change bars colors.
Ichimoku Crypto LONG 3h ANY CRYPTO PairThis is a strategy which works with most of the crypto pairs on the 3H time frames.
It beats easily on the long term buy and hold strategy.
This strategy is made from the baseline from ichimoku together with ema 200
This is a long only strategy.
THe condition is : our candle is above ema 200 and our ichimoku its telling we have a long trend. We exit on the opposite signal.
If you have any questions private message me !

Strategy- Double Decker RSIThis Strategy was LIVE coded during a webinar conducted by the author on 16-Jan-21 titled Backtesting in Tradingview. The system is named " Double Decker RSI ".
The rules of this strategy are:
LONG - RSI(5)>70 and RSI(14)>50 -- EXIT: RSI(5)<55
SHORT - RSI(5)<40 and RSI(14)<50 -- EXIT: RSI(5)>45
Instrument - BANKNIFTY - 1 HR Chart
The code is open source for you to edit and make changes as needed. For details on the strategy and webinar, you can refer to the website in signature of this strategy.

GBP/JPY Daily time FX Strategy ATR W% BaselineThis is a preety good strategy suited for long term trading.
It has been adapted and optimized in this case for GBP/JPY 1D time frame.
Its made of Kiojun baseline, together with ATR for stop loss and size calculation and Williams % R
For the purpose of this example we simulate that we have a leverage of 100x in order to be able to buy the ammount of lots required for our stop loss to be in same page with the risk % of our capital.
For entry we have for long, ascending R in the last 2 candles and crossover of close with KIOJUN baseline. For short the same but in reverse.
We exit if we reach the TP -100 points in this example, or SL , which is based on ATR of the last x days.
If you have any questions feel free to write me in private !

Heikin Ashi + Price Action Crypto LONG StrategyThis is a simple and efficient crypto strategy, designed for big timeframes like 12/24h.
On history it beats buy and hold strategy in many ocasions, and because of a low DD, pyramid can be used to elevate our winnings while still keeping a low DD < 40% avg.
For the purpose of this example, I used 100% of the capital on each trades, together with a comission of 0.1%
Warning : THERE IS NO STOP LOSS ON THIS STRATEGY ,USE IT AT YOUR OWN RISK
This strategy is made with inside Heikin Ashi candles , together with some price actions logics like for long Close > High and green candle and High > High .
We exit when we have a red candle and the current close is lower than the previous Low
If you have any questions, message me in private !

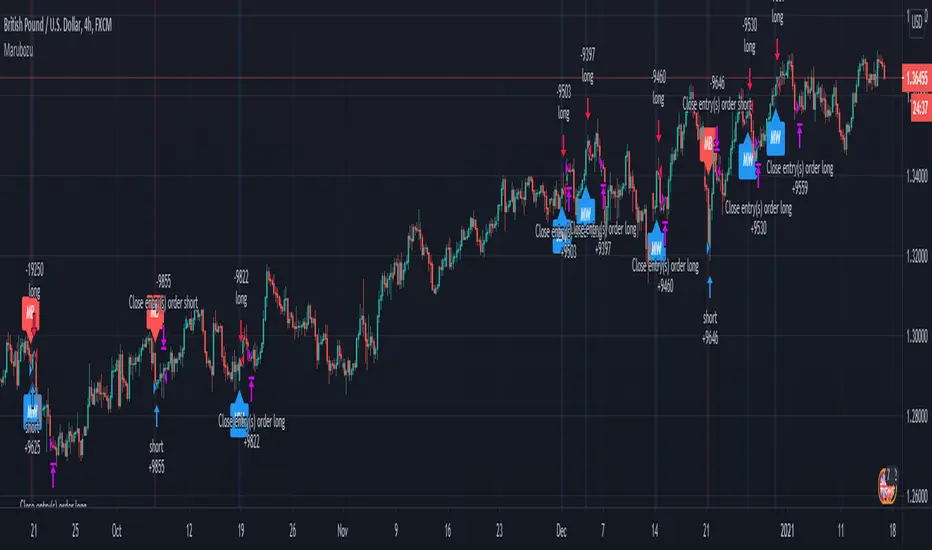
Marubozu Forex Price actionHi, today I bring you a price action strategy/indicator for Forex, made out for Marubozu candle type.
For the entries of it check if we have a long or a short marubozu.
For exit we have for long when the actual candle is green and the last previous two were red.
For exit we have for short, when the actual candle is red and the last previous two were green.
If you have any questions private message me !
London Breakout/Session GBP/USD Forex DaytradeThis is a forex strategy suited for day traders, specialized in the london breakout session
The key elements for this strategy are the specific london time session, together with an exit time(before asian trade/at the end of new york session).
At the same time, as logic elements we only use price action inside like :
For long we have 3 ascending candles, and for short we have 3 descending candles.
For exit we have both TP/SL based on price percentage movement, or we exit if we reach the end of the day.
If you have any questions message me in private !

Heikin-Ashi Change Strategy/ Indicator
Today I bring you a simple and efficient indicator/strategy based only on HA.
Can be used together with other TA tools or alone.
The idea behind is simple :
We have to forms to calculate the candle, using inner HA candles or normal candles. Once we have that we apply certain rules to get the max high, min low, open and close(ohlc)
With that then we check for changing in the patters like for example
For long close is higher than open and the previos close is lower than open. For short is going to be the opposite of long condition.
For the purpose of this example, I only use long direction and exit once we have the short signal.
If you have any questions, please let me know in private chat !
