Bollinger Bands + MA 50/100/200📊 Bollinger Bands + MA 50 / 100 / 200 Indicator
This indicator combines Bollinger Bands with key Moving Averages (50, 100, 200) to help you spot trend direction, volatility, and potential reversal zones in one clean view.
🔹 Bollinger Bands
* Customizable length & MA type (SMA, EMA, RMA, WMA, VWMA)
* Visualizes market volatility
* Upper & lower bands help identify overbought / oversold conditions
🔹 Moving Averages
* MA 50 → Short-term trend
* MA 100 → Medium-term trend
* MA 200 → Long-term trend & major support/resistance
* Easy toggle on/off for clean charting
💡 How to use
* Price near upper band + strong MA trend → possible continuation
* Price near lower band → watch for bounce or breakdown
* MA alignment (50 > 100 > 200) → bullish trend
* MA cross & BB squeeze → potential breakout incoming
⚠️ Best used with price action & risk management
📌 Works on stocks, crypto, forex, indices
Trendanalyse

MGQ EMA GOLD PARIS Indicator MGQ EMA GOLD PARIS Indicator is a discretionary trend-following indicator designed for XAUUSD, optimized for the M15 timeframe.
It uses EMA (9, 21, 200) structure with RSI confirmation to identify high-probability BUY and SELL zones during the London and New York sessions (Paris time).
The indicator provides clear visual guidance including BUY/SELL icons and optional SL, TP1, TP2, TP3, and Break-Even (BE) guide levels based on R-multiple logic.
This indicator is intended for manual trade execution and risk-managed trading.
No financial advice. Use proper risk management.

Order Flow Signals - Alphaomega18═══════════════════════════════════════════════════════════════════════════════
ORDER FLOW SIGNALS - TRADINGVIEW PUBLICATION (ENGLISH)
Created by Alphaomega18
═══════════════════════════════════════════════════════════════════════════════
📌 PUBLICATION TITLE
═══════════════════════════════════════════════════════════════════════════════
Order Flow Signals - Absorptions & CVD Divergences - Alphaomega18
📝 COMPLETE DESCRIPTION
═══════════════════════════════════════════════════════════════════════════════
🎯 DETECT INSTITUTIONAL MOVES IN REAL-TIME
Order Flow Signals is an advanced order flow analysis indicator that displays institutional absorption signals, hidden CVD divergences, and extreme buy/sell pressure directly on your chart.
Fully customizable with 9 configurable colors, adjustable label sizes, and extreme absorption detection (300%+), this indicator allows you to trade WITH institutions, not against them.
🔥 THE PROBLEM IT SOLVES
Have you ever:
✗ Taken a technically perfect setup but got stopped out?
✗ Seen price reject a support/resistance but go the other way?
✗ Entered counter-trend without knowing institutions were accumulating?
✗ Missed big moves due to lack of confirmation?
Order Flow Signals solves these problems by revealing what smart money is REALLY doing behind each candle.
📊 SIGNALS DISPLAYED ON CHART
🔷 ABSORPTIONS (💎 Diamonds)
Institutions absorb order flow when volume is high BUT price doesn't move in the expected direction.
💎 BULLISH ABSORPTION (Cyan)
→ Volume spike + bearish candle + positive delta
→ Institutions are BUYING despite selling pressure
→ Strong accumulation signal
💎 BEARISH ABSORPTION (Orange)
→ Volume spike + bullish candle + negative delta
→ Institutions are SELLING despite buying pressure
→ Strong distribution signal
🔥 EXTREME ABSORPTIONS (Fuchsia Fire)
→ Volume > 300% of average (customizable)
→ MASSIVE institutional activity
→ Ultra-rare and ultra-strong signals
→ Indicates major moves in preparation
🔺 DIVERGENCES (▲ Green Triangles)
Price makes lower lows BUT CVD makes higher lows
→ Hidden accumulation in progress
→ Bullish reversal signal likely
→ Confirms your BUY entries
🔻 DIVERGENCES (▼ Red Triangles)
Price makes higher highs BUT CVD makes lower highs
→ Hidden distribution in progress
→ Bearish reversal signal likely
→ Confirms your SELL entries
🚀 EXTREME BUY PRESSURE (Rockets)
Delta > 2x average
→ Massive aggressive buying
→ Strong bullish momentum
→ Continuation likely
💥 EXTREME SELL PRESSURE (Explosions)
Delta < -2x average
→ Massive aggressive selling
→ Strong bearish momentum
→ Capitulation or panic
📈 DELTA PER CANDLE DISPLAY (NEW)
Option to display numerical delta on each candle:
• ✅ GREEN when delta positive (+250, +180, etc.)
• ❌ RED when delta negative (-320, -150, etc.)
• Tiny size to avoid clutter
• Perfect for tracking flow in real-time
🎯 REAL USE CASES
📌 Example 1: Avoid the Classic Trap
Technical setup:
→ Price rejects VWAP Weekly (resistance)
→ FVG below attracting
→ Single Prints above
→ You think: "Perfect SELL setup!"
WITHOUT Order Flow Signals:
❌ You enter SELL
❌ Price goes up and stops you out
❌ Frustration and loss
WITH Order Flow Signals:
✅ You see 💎 CYAN DIAMOND (Bullish absorption)
✅ Institutions are BUYING despite rejection
✅ You DON'T ENTER SELL
✅ Trade saved, loss avoided!
📌 Example 2: Confirm a Breakout
Setup:
→ Price breaks major resistance
→ But is it a real breakout or fakeout?
Check Order Flow Signals:
→ 🚀 ROCKET appears (extreme buy pressure)
→ 💎 CYAN DIAMOND (bullish absorption)
→ Massive positive delta visible
Clear signal: It's a REAL breakout!
→ Enter BUY with confidence
→ Institutions pushing price
📌 Example 3: Detect Hidden Accumulation
Situation:
→ Price consolidating in range
→ Apparently neutral
→ No clear technical signal
Order Flow Signals reveals:
→ ▲ GREEN TRIANGLE (bullish divergence)
→ Price flat BUT CVD rising progressively
→ Institutional accumulation in progress
Action: Prepare LONG position
→ When price breaks, it will be violent!
⚙️ COMPLETE CUSTOMIZATION
🎨 COLORS (9 configurable colors)
• Bullish Absorption (default: cyan)
• Bearish Absorption (default: orange)
• EXTREME Absorption (default: fuchsia)
• Bullish Divergence (default: green)
• Bearish Divergence (default: red)
• Buy Pressure (default: lime)
• Sell Pressure (default: fuchsia)
• Positive Delta (default: green)
• Negative Delta (default: red)
Adapt the indicator to your chart style!
📏 LABEL SIZES
5 sizes available: Tiny / Small / Normal / Large / Huge
→ Perfect for all screen types
→ Large 4K screen? → Large or Huge
→ Small laptop? → Small or Normal
🔍 CUSTOMIZABLE DETECTION
• Normal Absorption Threshold: 1.5x (default)
• EXTREME Absorption Threshold: 3.0x (default)
• Divergence Periods: 14 (default)
• All thresholds adjustable to your style
👁️ ON/OFF DISPLAY
• Absorptions 💎 (On/Off)
• Divergences ▲▼ (On/Off)
• Extreme Pressure 🚀💥 (On/Off)
• Delta per Candle (On/Off)
Display only what you need!
🔔 COMPLETE ALERT SYSTEM
8 independently configurable alert types:
1. 🔵 Bullish Absorption
2. 🔴 Bearish Absorption
3. 🔥🔵 EXTREME Bullish Absorption
4. 🔥🔴 EXTREME Bearish Absorption
5. 📈 Bullish Divergence
6. 📉 Bearish Divergence
7. 🚀 Extreme Buy Pressure
8. 💥 Extreme Sell Pressure
Receive push, email or SMS notifications when institutions act!
💡 MARKETS AND TIMEFRAMES
✅ ALL markets compatible:
• Futures (ES, NQ, YM, RTY, MNQ, MES, etc.)
• Forex (EUR/USD, GBP/USD, USD/JPY, etc.)
• Crypto (BTC, ETH, altcoins)
• Stocks (Tesla, Apple, Nvidia, etc.)
• Indices (S&P 500, Nasdaq, Dow Jones)
• Commodities (Gold, Oil, etc.)
✅ All timeframes:
• Scalping: 1min, 5min
• Day Trading: 15min, 30min, 1H ⭐ (optimal!)
• Swing Trading: 4H, Daily
Note: More reliable signals with real volume data
→ TradingView Premium recommended for tick data
🏆 UNIQUE ADVANTAGES
✅ Automatic institutional absorption detection
✅ EXTREME absorptions (300%+) for ultra-strong signals
✅ Integrated CVD (Cumulative Volume Delta)
✅ Optional per-candle delta display (green/red)
✅ 9 customizable colors - adapt to your style
✅ 5 label sizes - perfect for all screens
✅ Clear visual signals directly on chart
✅ Detailed tooltips on each signal
✅ 8 independent configurable alerts
✅ Clean, optimized code, no repaint
✅ Compatible all markets and timeframes
📊 RECOMMENDED CONFIGURATION
For MNQ / ES / NQ (15min):
```
Detection:
├─ Normal Absorption Threshold: 1.5x
└─ EXTREME Absorption Threshold: 3.0x
Display:
├─ Absorptions: ✅ ON
├─ Divergences: ✅ ON
├─ Extreme Pressure: ✅ ON
└─ Delta per Candle: ❌ OFF (or ON if preferred)
Customization:
└─ Label Size: Normal (or Large for big screen)
Colors:
└─ Default (or customize!)
Alerts:
└─ All ✅ ON
```
For Scalping (1-5min):
```
└─ Label Size: Small
└─ Delta per Candle: ✅ ON (useful in scalping)
└─ Absorption Threshold: 2.0x (stricter)
```
🎓 SUPPORT AND TOOLTIPS
Each signal includes detailed tooltip on hover:
• Exact volume and multiplier (e.g. 2.3x)
• Precise delta
• Signal explanation
• Suggested action
Hover over 💎▲🚀 to understand each signal!
🔗 PERFECT COMPLEMENT
This indicator works perfectly with:
• Order Flow Dashboard (to see CVD and pressures)
• VWAP Multi-Timeframe
• Fair Value Gaps (FVG)
• Market Profile (POC/VPOC)
• Support/Resistance
Combine Order Flow signals with your technical analysis!
⚠️ DISCLAIMER
Technical indicators are decision support tools. No indicator guarantees profits. Always use:
• Appropriate risk management
• Stop loss on every trade
• Proper position sizing
• Demo account testing first
Order Flow Signals improves your analysis but doesn't replace a complete strategy.
📞 CONTACT AND SUPPORT
Created by Alphaomega18
For questions, bugs or suggestions:
Find my other indicators:
• Order Flow Dashboard (CVD and pressures)
• VWAP Multi-Timeframe Pro
• Fair Value Gap Detector
• Volume & Volatility Crisis Detector

Mawhoob (OBs & FVGs) - v1.1Mawhoob (OBs & FVGs) - v1.1
Professional Market Structure Indicator
----------------------------------------------------
🎯 Overview
----------------------------------------------------
Mawhoob (OBs & FVGs) - v1.1 is a comprehensive technical analysis indicator designed to identify and track two of the most powerful concepts in modern price action trading: Order Blocks (OBs) and Fair Value Gaps (FVGs). This indicator provides traders with automated detection, visualization, and real-time alerts for these key market structure elements, helping you identify high-probability trading zones and potential reversal areas.
----------------------------------------------------
🔍 What Are Order Blocks and Fair Value Gaps?
----------------------------------------------------
✅ Order Blocks (OBs)
Order Blocks represent areas where institutional players have placed significant orders, creating imbalances in supply and demand. These zones often act as strong support or resistance levels where price tends to react when revisited.
* Bullish Order Block (OB+): Forms when a bearish candle is immediately followed by a strong bullish candle that closes above the previous candle's high, indicating institutional buying interest.
* Bearish Order Block (OB-): Forms when a bullish candle is immediately followed by a strong bearish candle that closes below the previous candle's low, indicating institutional selling pressure.
✅ Fair Value Gaps (FVGs)
Fair Value Gaps are price inefficiencies that occur when the market moves too quickly, leaving unfilled price ranges. These gaps often get "filled" or "mitigated" as price returns to seek liquidity and balance.
* Bullish Fair Value Gap (FVG+): Forms when there's a gap between the high of two candles ago and the low of the current candle in an upward move.
* Bearish Fair Value Gap (FVG-): Forms when there's a gap between the low of two candles ago and the high of the current candle in a downward move.
----------------------------------------------------
✨ Key Features ✨
----------------------------------------------------
✅ Order Blocks (OBs) Module:
Detection & Visualization
Automatic OB Detection: Identifies both bullish and bearish order blocks in real-time.
Customizable Display: Show up to 50 order blocks simultaneously.
Visual Distinction: Separate color schemes for bullish and bearish order blocks.
Smart Labeling: Optional OB+/OB- labels for easy identification.
Advanced Filtering Options
Strong OBs Filter: Option to display only "super/strong" order blocks.
FVG Confirmation Filter: Show only order blocks that are immediately followed by fair value gaps for higher confluence.
Flexible Filtering: Use filters independently or combine them for maximum selectivity
Mitigation Tracking
Real-time Monitoring: Automatically tracks when order blocks are "filled" or mitigated by price.
Display Control: Choose whether to show or hide filled order blocks.
Customization Options
Color Settings: Fully customizable colors for bullish/bearish order block zones.
Transparency Control: Adjustable box background transparency.
Border Styles: Choose between Solid, Dashed, or Dotted borders.
Extension Options: Extend boxes to the right or stop at mitigation point.
Label Size: Select from Auto, Tiny, Small, Normal, or Large label sizes.
✅ Fair Value Gaps (FVGs) Module:
Detection & Visualization
Automatic FVG Detection: Identifies both bullish and bearish fair value gaps.
Customizable Display: Show up to 50 FVGs simultaneously.
Visual Distinction: Separate color schemes for bullish and bearish gaps.
Smart Labeling: Optional FVG+/FVG- labels for clarity.
Advanced Filtering Options
Strong FVGs Filter: Display only significant gaps formed by strong candles.
OB Confirmation Filter: Show only FVGs that follow order blocks for enhanced reliability.
Independent Settings: Completely separate filtering from order block module.
Mitigation Tracking
Gap Fill Detection: Automatically detects when price fills the fair value gap.
Visual Updates: Filled gaps change appearance to indicate completion.
Display Options: Control visibility of filled versus unfilled gaps.
Customization Options
Full Color Control: Independent color settings for bullish/bearish FVGs.
Transparency Management: Adjustable transparency levels.
Border Customization: Multiple border style options.
Extension Control: Choose how gaps extend on the chart.
Label Customization: Adjustable label sizes and colors.
----------------------------------------------------
🔔 Alerts & Signals
----------------------------------------------------
Alerts System
Real-time Notifications: Receive instant alerts when new OBs or FVGs are detected.
Separate Alert Channels: Independent alerts for order blocks and fair value gaps.
Price Information: Each alert includes the current price level.
Frequency Control: Alerts trigger once per bar to avoid spam.
Visual Signals
On-Chart Markers: Optional visual signals (circles/diamonds) at detection points.
Color-Coded: Bullish signals below bars, bearish signals above bars.
Toggle Control: Enable/disable signals independently from alerts.
----------------------------------------------------
📋 How to Use This Indicator?
----------------------------------------------------
For Trend Following
Look for Bullish OBs and FVGs in uptrends as potential entry zones.
Look for Bearish OBs and FVGs in downtrends as potential entry zones.
Use unmitigated zones as key support/resistance levels.
For Reversal Trading
Watch for price reactions when approaching order blocks.
Combine multiple timeframe analysis for higher probability setups.
Use the "Strong" filters to focus on the most significant zones.
For Confluence Trading
Enable "Show Only (OBs) that Followed by (FVGs)" filter.
Enable "Show Only (FVGs) that Follow (OBs)" filter.
Trade only when both structures align for maximum confluence.
Risk Management
Monitor when zones become mitigated (filled).
Use multiple timeframes to identify nested zones.
Combine with your existing trading strategy for confirmation.
----------------------------------------------------
⚙️ Recommended Settings
----------------------------------------------------
For Scalping (1m - 5m timeframes)
Display: 15-20 boxes.
Enable: Strong filters.
Disable: Show mitigated zones.
For Day Trading (15m - 1H timeframes)
Display: 20-30 boxes.
Enable: Confluence filters when needed.
Enable: Show mitigated zones for context.
For Swing Trading (4H - Daily timeframes)
Display: 30-50 boxes.
Enable: All zones for comprehensive analysis.
Enable: Confluence filters when needed.
Enable: Show mitigated zones for context.
----------------------------------------------------
💡 Pro Tips
----------------------------------------------------
Multiple Timeframe Analysis: Use the indicator on multiple timeframes to identify nested order blocks and FVGs for stronger setups.
Confluence Zones: Areas where OBs and FVGs overlap often provide the highest probability trades.
Mitigation Matters: Pay attention to how quickly and cleanly zones are mitigated - clean mitigations often indicate institutional interest.
Filter Combinations: Experiment with different filter combinations to find what works best for your trading style.
Alert Management: Set up alerts for both OBs and FVGs to never miss potential setups.
----------------------------------------------------
⚠️ Important Notes
----------------------------------------------------
This indicator is for educational and informational purposes only.
Always confirm signals with your own analysis before trading.
Use proper risk management and position sizing.
The indicator works on all timeframes and instruments.
Past performance does not guarantee future results.
----------------------------------------------------
🔄 Updates & Support
----------------------------------------------------
Current Version: v1.1
This indicator is actively maintained and updated. Future versions may include additional features and improvements based on user feedback.
----------------------------------------------------
🙏 Acknowledgments
----------------------------------------------------
Created by @mawhoobx - Designed to help traders identify institutional footprints and market inefficiencies for better trading decisions.

Seasonality Table: % Move by Day x Month (Open vs Prev Close)Short description
A compact seasonality heatmap that shows the average daily open vs previous session close move for each calendar day (1–31) across months (Jan–Dec).
What it does
This indicator builds a Day × Month table where each cell displays the historical average of:
(Open/Close-1) -1 x 100
In other words: how the market typically “opened” relative to the prior day’s close, grouped by day of month and month.
How to read it
Rows = Day of month (1–31)
Columns = Months (Jan–Dec)
Cell value = average percentage move (signed format like +0.23% or -0.33%)
Heatmap = stronger color intensity indicates larger absolute average moves
Today highlight = the current calendar day cell is visually highlighted for fast context
Key settings
Reference timeframe (Daily): uses daily session data as the source of truth
Decimals / Signed formatting: control numeric display
Theme controls: fully customizable colors for positive/negative/neutral cells, headers, labels, and text
Font sizes: independently adjust header/labels/values
Heatmap scaling: set “max abs (%)” to match the volatility of the instrument
Notes / limitations
The indicator depends on the historical data available on TradingView for the selected
symbol and timeframe.
This is a statistical visualization tool. It does not predict future returns and does not generate trade signals.
Disclaimer
This script is for educational and informational purposes only and is not financial advice. Trading involves risk. Always do your own research and use proper risk management.

UIA TrendCompass V1.0UIA TrendCompass v1.0 is a market structure interpretation tool designed to visualize trend states in real time.
The script identifies four structural states based on price behavior and trend continuity:
• T — Trend Start
• E — Trend Extension
• H — Structural High / Low
• X — Trend Exit / Reversal
This indicator is intended for market structure analysis and educational purposes only.
It does NOT provide trading signals, buy/sell recommendations, or investment advice.
All labels are generated based on historical price data and do not predict future market movements.
Users should combine this tool with their own analysis and risk management framework.
This script is provided "as is" with no guarantee of accuracy or performance.

Pyramid EnterPyramid Enter — Structured Add-On Entry Framework
Pyramid Enter is an analytical add-on framework designed to highlight structured continuation entry zones within an already-established directional move. It is intentionally not a standalone signal tool and is not designed to initiate positions on its own. Instead, it focuses on scaling logic once a directional bias is already defined.
The indicator is minimal, disciplined, and role-specific:
it answers the question “Where might additional entries make structural sense if I am already aligned?”
Core Philosophy
Most indicators attempt to do too much:
Identify trend
Call tops and bottoms
Time entries
Manage exits
Pyramid Enter does none of that.
Its sole purpose is to identify continuation alignment — moments where price structure and momentum re-synchronize after a pause or reset, potentially allowing for incremental exposure rather than a single all-in decision.
This makes it especially useful for studying trend persistence, not prediction.
How Pyramid Enter Works
At its core, Pyramid Enter evaluates the relationship between:
A fast EMA (price responsiveness)
A smoothed reference line (structure stabilization)
An ENTER event is generated when:
The fast EMA crosses above the selected smoothed line
Optional EMA 8/21 trend filter confirms directional alignment
Per-bar locking ensures only one event per bar
Adaptive logic allows alignment immediately when trend conditions flip
The indicator includes:
Real-time detection
Bar-close backup logic
Single-event locking per bar
This design ensures clean behavior in both live and historical environments without signal duplication.
What Pyramid Enter Is Not
It is important to be explicit:
Pyramid Enter does not determine trend direction
It does not mark exits
It does not replace a primary entry tool
It does not predict future price movement
It simply highlights structural continuation conditions.
Clean Pairing with Rasta
Rasta defines the market regime and structural rhythm.
It answers:
Is the market trending or transitioning?
What side is structurally favored?
Has the state flipped?
Pyramid Enter is designed to be used only after Rasta has already established context.
A common analytical workflow:
Use Rasta to identify structural alignment
Ignore Pyramid Enter entirely until Rasta confirms direction
Once aligned, Pyramid Enter highlights where continuation alignment re-appears
This keeps responsibilities separated:
Rasta = context
Pyramid Enter = continuation opportunity
Clean Pairing with RSI Extremes
RSI Extremes focuses on pressure exhaustion, not continuation.
It highlights:
Oversold exhaustion (ENTER conditions)
Overbought exhaustion (EXIT conditions)
Statistically rare stress points
When combined:
RSI Extremes highlights where pressure may reset
Pyramid Enter highlights when structure realigns after that reset
This pairing allows users to study:
Exhaustion → stabilization → continuation
without relying on a single indicator to do everything.
Three-Tool System Architecture
When used together, each tool has a clearly defined role:
Rasta
→ Structural regime & directional bias
RSI Extremes
→ Momentum exhaustion & pressure extremes
Pyramid Enter
→ Continuation alignment & scaling logic
Each tool is independent, but complementary.
None replaces the others.
Design Principles
Pyramid Enter is built around:
Role clarity
Minimalism
State discipline
No prediction
No guarantees
It is intended for educational, analytical, and research use only. All interpretation, risk management, and decision-making remain the responsibility of the user.
Summary
Pyramid Enter is a focused continuation framework that:
Highlights structural add-on alignment
Avoids prediction or exit logic
Pairs cleanly with Rasta and RSI Extremes
Encourages disciplined scaling rather than impulsive entries
Its value comes from what it refuses to do, not from over-complexity.

Markov: Transition Matrix [Daily Timeframe]Description
This indicator computes a 3-state Markov chain from price action and visualizes the transition probabilities between daily states:
• Up: daily % change > threshold
• Down: daily % change < -threshold
• Sideways: |daily % change| ≤ threshold
From those states, it builds transition matrices:
• Today → Tomorrow (1 day ahead)
• Today → In 2 days
• Today → In 3 days
Each matrix cell shows:
P(next state | current state)
Rows are the current state (today), columns are the future state (tomorrow / +2 / +3).
Each row sums to 100% (when there is sufficient sample size).
________________________________________
How to read it (trader workflow)
1. Identify the current regime (the most recent confirmed daily state).
2. Look at the row matching that regime:
• The ★ marks the highest probability outcome for that row (most likely next state).
• Heatmap intensity increases as probability increases.
• Each row shows its own sample size (n=...) so you can judge statistical support.
3. Use Quick-read:
• “Now” = current regime
• “Best” = top conditional outcome + probability
• “2nd” = second-best outcome + probability
4. Use Universe (N):
• Shows the marginal distribution: how often days are Up/Down/Sideways across the whole dataset.
________________________________________
Settings
Core logic
• Sideways threshold: controls how strict “Sideways” is.
Example: 0.001 = ±0.10% daily move is considered Sideways.
Display
• Toggle 1D / 2D / 3D matrices.
• Highlight best probability per row (★).
• Show n per row (row transition count).
• Focus: current state row only to reduce noise and speed decision-making.
• Quick-read row for the current regime.
Theme (fully customizable)
All colors can be customized:
• Up / Down / Sideways base colors
• Header background + header text
• Values text
• Quick-read neutral background
This makes it suitable for both light and dark chart themes.
________________________________________
Notes / Limitations
• The indicator is designed for daily sessions. It uses daily close-to-close returns to classify states and update the Markov chain once per day.
• On very volatile assets, a very small threshold can make Sideways rare. If you want a more frequent Sideways regime, increase the threshold.
• This is a statistical visualization tool, not a trading system.
________________________________________
Disclaimer (TradingView-friendly)
This script is provided for educational and informational purposes only and does not constitute financial advice. Trading involves risk. Past probabilities do not guarantee future results. Use at your own discretion and always apply proper risk management.

Jell TrendThe Jell Trend is a comprehensive tool designed for Trend Following and Pullback traders. It combines Short-Term Momentum, Long-Term Structure, and Multi-Timeframe (MTF) analysis into a single, clean indicator.
Key Features:
1. Momentum Ribbon (Short Term) Composed of EMA 13, 25, and 32.
Visual Aid: Dynamic clouds color the space between EMAs to show immediate trend strength.
2. Market Structure (Long Term) Displays classic institutional moving averages (SMA 100, EMA 200, SMA 200, SMA 300).
The "200 Zone": A specific cloud fills the gap between the EMA 200 and SMA 200, highlighting major institutional support/resistance areas.
3. Built-in Multi-Timeframe (MTF)
Fixed H4 EMA 200: Displays the 4-Hour EMA 200 on any timeframe (M5, M15, H1).
Benefit: Allows intraday traders to see major key levels without switching charts.
Customization:
Every line and cloud can be toggled on/off and colored to fit your specific charting needs.
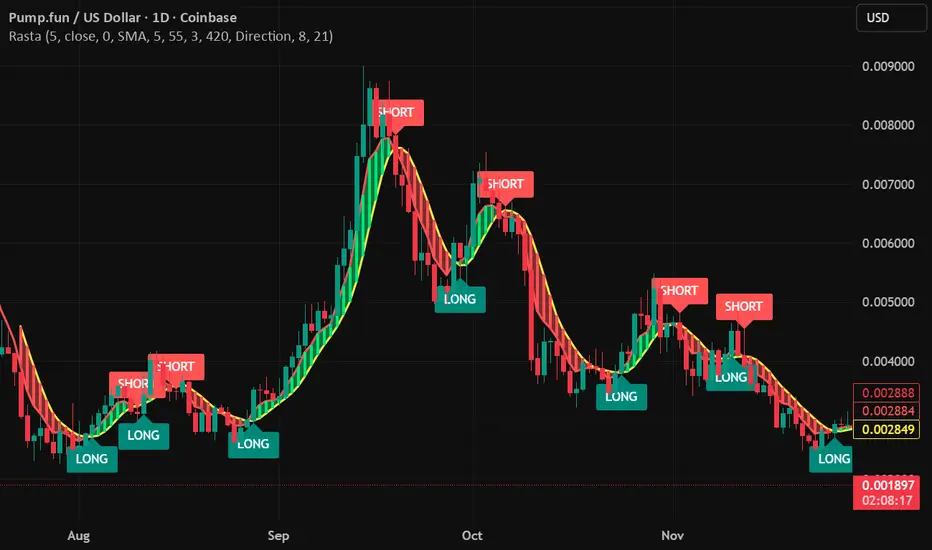
RastaRasta — Real-Time Directional State Framework
Rasta is a real-time, state-based momentum and structure indicator designed to help users visualize directional market bias and observe transitions between bullish and bearish regimes. The script combines an adaptive baseline (EMA) with a selectable smoothing layer to create a clean, readable structure that highlights how price momentum and trend context evolve over time.
This indicator is built to be responsive in real time while remaining readable on higher timeframes. It is intended for users who want a practical framework for studying market rhythm, structure, and directional bias—without relying on hindsight-based visuals.
Concept Overview
Rasta works by tracking two primary curves:
EMA Line (core baseline)
A fast baseline that responds to price movement according to the selected length and source.
Smoothed Line (structure layer)
A second line derived from the baseline using a user-selected smoothing method. This creates a stable “structure reference” that helps distinguish meaningful directional shifts from minor noise.
When the baseline crosses the structure line, the script interprets it as a directional state transition:
LONG state when momentum structure shifts upward
SHORT state when momentum structure shifts downward
These transitions are presented as labels and can be used to trigger alerts that notify the user when a state change occurs.
Key Features
1) Real-Time Directional State Transitions
Rasta evaluates transitions continuously and can generate state-change markers in real time. This makes it suitable for users who want a framework that can react during the bar, not only after a bar closes.
2) Per-Bar Lock for Clean Signaling
To prevent repeated triggering inside the same candle, Rasta uses a per-bar lock. This helps keep the visual output and alerting behavior clean and prevents rapid repeats when price oscillates around the crossover level.
3) One-Position State Logic
Rasta uses an internal state model so signals behave consistently:
A LONG state change occurs only when not already in that state
A SHORT state change occurs only when already in a LONG state (and vice versa depending on configuration)
This produces a stable “state machine” feel rather than noisy multi-trigger behavior.
4) Bar-Close Backup Events
In addition to real-time behavior, Rasta includes bar-close confirmation events so that state transitions can still be captured on confirmed closes. This is intended as a reliability layer for users who prefer bar-close confirmations or want a secondary confirmation pathway.
5) Optional EMA 8/21 Trend Context Filter
Rasta includes an optional EMA 8 / EMA 21 trend context filter:
When enabled, LONG transitions can be gated by a higher-level trend condition
Exits/transitions are not blocked by the filter (filter is focused on trend alignment rather than preventing regime changes)
This allows users to tune between:
More responsive behavior (filter off)
More trend-aligned behavior (filter on)
6) Adaptive Entry Behavior When Trend Context Flips
When the trend filter flips into alignment, Rasta can optionally allow an adaptive entry behavior if internal structure is already aligned. This is intended to reduce missed transitions when broader trend context changes after the internal structure has already shifted.
Visual System
Rasta includes several visual aids designed to make directional regime clarity obvious at a glance:
Lines
EMA (baseline)
Smoothed (structure)
Directional Fog (optional)
A colored fill between the lines helps highlight:
Positive structure alignment
Negative structure alignment
Opacity is adjustable for different chart styles.
DNA Rungs (optional)
Rasta can draw “rungs” that connect the EMA line and the smoothed line, creating a ladder-style visualization of structure spacing and momentum intensity over time. Users can:
Enable/disable rungs
Adjust rung width
Control the max number of rungs retained (performance management)
Choose rung color behavior (fixed vs directional)
Inputs and Tuning Notes
Rasta is intentionally configurable so you can tailor it to different markets and timeframes:
Core Settings
Length: Controls baseline responsiveness
Source: Baseline source (close by default)
Offset: Optional visual offset (does not change logic)
Smoothing Settings
Type: SMA / EMA / RMA / WMA / None
Length: Controls how stable the structure line becomes
General intuition:
Lower smoothing = faster, more reactive
Higher smoothing = cleaner, more selective transitions
EMA 8/21 Filter (optional)
Enable/disable
Fast/slow EMA lengths
Optional plotting for transparency
How to Use
Rasta is best used as a directional context tool—a framework for evaluating regime shifts, momentum structure, and trend alignment.
Common analytical workflows:
Apply Rasta to a chart and observe LONG/SHORT state transitions
Use the line relationship and fog as a visual confirmation of structure alignment
Optionally enable the EMA 8/21 filter for higher-level trend context
Use alerts if you want notifications when state changes occur
This indicator is designed to be applied to many assets and timeframes. Users should expect to tune parameters based on:
Volatility profile
Liquidity
Timeframe
Market regime
Alerts
Rasta supports alerts that notify you when a directional state change occurs.
Provided alert messages:
LONG
SHORT
These alerts indicate a state transition condition occurred. Users can route these alerts to external systems if they choose; however, Rasta itself is an analytical indicator and does not execute trades.
Recommended alert frequency (typical best practice):
“Once per bar” for real-time transitions
Users may choose bar-close alerting preferences depending on their workflow
Performance and Platform Notes
Rasta includes optional visual elements (fog and rungs). If you notice slowdowns on very low timeframes or long histories, reduce rung count or disable rungs.
The indicator is designed to avoid repeated triggers within a single bar via a per-bar lock, improving signal cleanliness.
Important Disclosures
Rasta is an analytical and educational framework intended to help users study market structure and directional bias. It is not financial advice and is not a signal service. No claims are made regarding profitability or future performance. Markets involve risk, and users are responsible for their own decisions, risk management, and execution.
PDH/PDL + ONH/ONL (Enhanced Labels)At the start of a new day's session, this indicator will plot the Previous Day's High and Low as well as the Overnight (afterhours) High and Low as horizontal dotted lines on the current day's session.
You can edit the colors of the lines and the text (the same)
You can edit the color of the labels as well as the transparency of the label color itself
The label for each line will be plotting with the chart, you can edit the number of bars that the label will appear to the live price action to keep from having to zoom to determine which line it represents.
the chart settings - session must be set to "extended trading hours" for this to appear on your chart

Omni-Trend Analytics + Live PnL DashboardOverview
The Omni-Trend Analytics suite is an all-in-one technical command center. It integrates the battle-tested UT Bot signal logic with a sophisticated real-time dashboard, session tracking, and multi-timeframe trend analysis.
📊 The "Nexus" Dashboard
The heart of this script is the 6-row dynamic dashboard, designed to give you "at-a-glance" confluence:
RSI & RSI-MA: Tracks the standard RSI alongside a custom RSI-based Moving Average to spot momentum shifts before they hit the price.
Selectable Trend Status: Unlike static indicators, you can toggle the "Trend" source between EMA 9, 20, or 200 in the settings to match your trading style (Scalping vs. Swing).
Distance to EMA: Shows exactly how "overextended" the price is from your selected trend line.
ATR Volatility (Color-Coded): Turns Green when volatility is expanding (ideal for trend following) and Red when the market is contracting (ideal for range-trading or caution).
Live PnL Tracking: Automatically calculates the profit or loss of the most recent UT Bot signal in real-time.
🛠️ Key Features & Settings
Precision Signals: Combines UT Bot Buy/Sell labels with RSI "!" reversal warnings for high-probability entries.
Institutional Moving Averages: Includes 5 SMAs (including the 610 SMA) and 3 EMAs (9, 20, 200) all set to a professional Thickness 2 for clarity.
Session Highlighting: Automatically shades the background for London and New York sessions to help you trade when liquidity is highest.
VWAP Integration: Includes a purple VWAP line to ensure you are trading at a "fair value" relative to volume.
🔔 Strategic Alert Suite
The script comes pre-loaded with 6 specialized alert conditions:
UT Bot Signal: Standard entry alerts.
RSI Cross RSI-MA: Early warning for momentum reversals.
High-Prob UT + VWAP: Signals that only trigger when aligned with institutional volume.
EMA 9/20 Momentum Cross: Classic trend-shift notification.
ATR Volatility Spike: Alerts you to 50% increases in market volatility.
PnL Target / Break-Even: Pings you when your live trade reaches a user-defined profit threshold.
💡 Trading Pro-Tip
The Convergence Strategy: Look for a UT Bot Buy signal that occurs during the London/NY Overlap while the ATR is Green (expanding) and the RSI is crossing over its RSI-MA. This "triple confluence" is the primary design intent of the Omni-Trend suite.

RastaRasta — Real-Time Directional State Framework
Rasta is a real-time, state-based momentum and structure indicator designed to help users visualize directional market bias and observe transitions between bullish and bearish regimes. The script combines an adaptive baseline (EMA) with a selectable smoothing layer to create a clean, readable structure that highlights how price momentum and trend context evolve over time.
This indicator is built to be responsive in real time while remaining readable on higher timeframes. It is intended for users who want a practical framework for studying market rhythm, structure, and directional bias—without relying on hindsight-based visuals.
Concept Overview
Rasta works by tracking two primary curves:
EMA Line (core baseline)
A fast baseline that responds to price movement according to the selected length and source.
Smoothed Line (structure layer)
A second line derived from the baseline using a user-selected smoothing method. This creates a stable “structure reference” that helps distinguish meaningful directional shifts from minor noise.
When the baseline crosses the structure line, the script interprets it as a directional state transition:
LONG state when momentum structure shifts upward
SHORT state when momentum structure shifts downward
These transitions are presented as labels and can be used to trigger alerts that notify the user when a state change occurs.
Key Features
1) Real-Time Directional State Transitions
Rasta evaluates transitions continuously and can generate state-change markers in real time. This makes it suitable for users who want a framework that can react during the bar, not only after a bar closes.
2) Per-Bar Lock for Clean Signaling
To prevent repeated triggering inside the same candle, Rasta uses a per-bar lock. This helps keep the visual output and alerting behavior clean and prevents rapid repeats when price oscillates around the crossover level.
3) One-Position State Logic
Rasta uses an internal state model so signals behave consistently:
A LONG state change occurs only when not already in that state
A SHORT state change occurs only when already in a LONG state (and vice versa depending on configuration)
This produces a stable “state machine” feel rather than noisy multi-trigger behavior.
4) Bar-Close Backup Events
In addition to real-time behavior, Rasta includes bar-close confirmation events so that state transitions can still be captured on confirmed closes. This is intended as a reliability layer for users who prefer bar-close confirmations or want a secondary confirmation pathway.
5) Optional EMA 8/21 Trend Context Filter
Rasta includes an optional EMA 8 / EMA 21 trend context filter:
When enabled, LONG transitions can be gated by a higher-level trend condition
Exits/transitions are not blocked by the filter (filter is focused on trend alignment rather than preventing regime changes)
This allows users to tune between:
More responsive behavior (filter off)
More trend-aligned behavior (filter on)
6) Adaptive Entry Behavior When Trend Context Flips
When the trend filter flips into alignment, Rasta can optionally allow an adaptive entry behavior if internal structure is already aligned. This is intended to reduce missed transitions when broader trend context changes after the internal structure has already shifted.
Visual System
Rasta includes several visual aids designed to make directional regime clarity obvious at a glance:
Lines
EMA (baseline)
Smoothed (structure)
Directional Fog (optional)
A colored fill between the lines helps highlight:
Positive structure alignment
Negative structure alignment
Opacity is adjustable for different chart styles.
DNA Rungs (optional)
Rasta can draw “rungs” that connect the EMA line and the smoothed line, creating a ladder-style visualization of structure spacing and momentum intensity over time. Users can:
Enable/disable rungs
Adjust rung width
Control the max number of rungs retained (performance management)
Choose rung color behavior (fixed vs directional)
Inputs and Tuning Notes
Rasta is intentionally configurable so you can tailor it to different markets and timeframes:
Core Settings
Length: Controls baseline responsiveness
Source: Baseline source (close by default)
Offset: Optional visual offset (does not change logic)
Smoothing Settings
Type: SMA / EMA / RMA / WMA / None
Length: Controls how stable the structure line becomes
General intuition:
Lower smoothing = faster, more reactive
Higher smoothing = cleaner, more selective transitions
EMA 8/21 Filter (optional)
Enable/disable
Fast/slow EMA lengths
Optional plotting for transparency
How to Use
Rasta is best used as a directional context tool—a framework for evaluating regime shifts, momentum structure, and trend alignment.
Common analytical workflows:
Apply Rasta to a chart and observe LONG/SHORT state transitions
Use the line relationship and fog as a visual confirmation of structure alignment
Optionally enable the EMA 8/21 filter for higher-level trend context
Use alerts if you want notifications when state changes occur
This indicator is designed to be applied to many assets and timeframes. Users should expect to tune parameters based on:
Volatility profile
Liquidity
Timeframe
Market regime
Alerts
Rasta supports alerts that notify you when a directional state change occurs.
Provided alert messages:
LONG
SHORT
These alerts indicate a state transition condition occurred. Users can route these alerts to external systems if they choose; however, Rasta itself is an analytical indicator and does not execute trades.
Recommended alert frequency (typical best practice):
“Once per bar” for real-time transitions
Users may choose bar-close alerting preferences depending on their workflow
Performance and Platform Notes
Rasta includes optional visual elements (fog and rungs). If you notice slowdowns on very low timeframes or long histories, reduce rung count or disable rungs.
The indicator is designed to avoid repeated triggers within a single bar via a per-bar lock, improving signal cleanliness.
Important Disclosures
Rasta is an analytical and educational framework intended to help users study market structure and directional bias. It is not financial advice and is not a signal service. No claims are made regarding profitability or future performance. Markets involve risk, and users are responsible for their own decisions, risk management, and execution.

Algorithmic Volume Rejection Zones [AVRZ]Hello traders,
I am pleased to release the Algorithmic Volume Rejection Zones (AVRZ). This is a specialized decision-support system designed to identify high-probability reversal points by synthesizing candle geometry, market structure, and statistical volume anomalies.
Trading reversals often presents a dilemma: wait for confirmation and miss the move, or enter early and get stopped out by noise. AVRZ solves this by quantifying "Institutional Absorption." It filters out weak price probes and highlights only the specific moments where significant volume has stepped in to defend a price level.
🛡️ The Concept: Attacking The Zonesl
You will often see price aggressively "attack" a support or resistance level with speed and high volume. To the untrained eye, this looks like a breakout. However, professional analysis reveals that this is often an Efficiency Event—liquidity is being absorbed by passive limit orders.
The AVRZ indicator is specifically engineered to detect this phenomenon. When price strikes a level and volume spikes (>2.0 Sigma), it signals that the auction is becoming efficient and a reversal is imminent. The script captures this "Attack" via the Climax Bypass logic, plotting a fresh zone immediately to mark where the liquidity was defended.

MarketMind PROM🜁rketMind PRO ────────────────────
Descriptive Market Context & Risk Awareness
M🜁rketMind PRO is a professional-grade market context system designed to help traders maintain situational clarity and explicit risk awareness — without signals, confidence scoring, or forward-looking interpretation.
Rather than telling traders what to trade or how confident to be, M🜁rketMind PRO focuses on describing what is happening in the market and where caution may be warranted.
This script is designed as a standalone descriptive tool. It does not provide execution guidance, trade signals, or predictive insight.
WHAT IT DOES ────────────────────
M🜁rketMind PRO evaluates current market conditions across multiple dimensions — including session context, regime state, momentum direction, volatility, liquidity, and structural behavior — and presents them in a clean, human-readable HUD.
The system emphasizes description over interpretation.
It highlights conditions that may elevate or reduce risk without assessing alignment strength, assigning confidence, or projecting outcomes.
The script provides visibility into:
Market context and session awareness
Basic regime states and transitions
Momentum direction (up, down, neutral)
Volatility, liquidity, and structural caution conditions
Environmental factors that may influence risk
The goal is to make risk visible — without telling traders what to do with it.
HOW TO USE IT ────────────────────
M🜁rketMind PRO is not a signal generator.
It is designed to be used alongside discretionary price action, rule-based entries, or systematic strategies, helping traders stay aware of context and potential risk while executing their own process.
Common questions it can help inform include:
What type of market environment is currently present?
Is momentum developing, stalling, or absent?
Are volatility or liquidity conditions elevated?
Does the environment appear clean or structurally fragile?
M🜁rketMind PRO describes conditions as they are.
Interpretation and decision-making remain entirely with the trader.
DESIGN PHILOSOPHY ────────────────────
M🜁rketMind PRO is intentionally descriptive.
It includes context and caution layers without interpretive or evaluative frameworks:
Market context, momentum, and risk visibility
Volatility, liquidity, and structural awareness
Session awareness without gating or execution logic
A single, consistent HUD perspective
No confidence scoring or conviction grading
No predictive or forward-looking language
Nothing is implied.
Nothing is projected.
This script shows what is happening and where risk may exist — nothing more.
WHO IT IS FOR ────────────────────
M🜁rketMind PRO is suited for traders who:
Prefer structured context over signals
Manage their own execution and risk decisions
Value awareness of environmental and structural conditions
Want clarity without interpretive bias
It is not designed for:
Buy or sell alerts
Execution guidance
Predictive or outcome-based analysis
IMPORTANT NOTES ────────────────────
M🜁rketMind PRO does not provide financial advice
No system can predict future price behavior
This tool is designed to inform awareness, not decisions
Used appropriately, M🜁rketMind PRO supports disciplined, context-aware trading

Pivot point moving averagesPivot Point Moving Averages builds moving averages from confirmed pivots, not from every bar.
Instead of averaging all highs and lows, this script:
Detects swing pivot highs and pivot lows using a configurable Pivot length (pivotLen).
Converts these sparse pivot prices into continuous series of:
last confirmed pivot low
last confirmed pivot high
Applies a user-selectable moving average (SMA / EMA / RMA / WMA / VWMA) to each of those pivot series.
Plots the two resulting lines and shades the area between them as a pivot value cloud.
Because the lines only move when a new pivot is confirmed, they represent structural acceptance rather than raw volatility. Short “noise” moves and stop hunts between pivots have much less impact on these averages.
You can also enable an optional second pivot MA cloud:
Uses the same Pivot length for structural detection.
Has its own MA length and type.
Can run on a different timeframe (e.g. D, 240, W).
Is projected back onto the current chart so you see local pivot value and higher-timeframe pivot value together.
Why it’s useful
Traditional MAs:
React to every bar.
Move on noise, wicks, and stop runs.
Don’t distinguish between “meaningful” structure and random fluctuation.
This tool uses confirmed pivots, so it is better suited to market structure and phase analysis:
Pivot MA low reflects how demand is stepping up (or down) as new swing lows form.
Pivot MA high reflects how supply is pressing down (or easing) as new swing highs form.
The cloud between them acts as a dynamic, structure-based value area.
Typical interpretations:
Price inside the pivot cloud → balance / fair value area.
Price above the pivot cloud → bullish value expansion.
Price below the pivot cloud → bearish value expansion.
Cloud compressing → possible energy build-up, transition between phases.
Cloud expanding → stronger directional conviction.
With the second cloud enabled on a higher timeframe, you can:
See whether lower-timeframe structure is building with or against the higher-timeframe pivot value.
Use the HTF cloud as a background bias and the LTF cloud for timing and fine-grained context.
Notes
All pivot-based tools have inherent delay: a pivot is only confirmed after pivotLen bars to the right.
On very low timeframes, long pivotLen + long MA lengths will make the lines slower to react.
This is intended as a context and structure tool, not a standalone entry signal.

Cosmic Crypto Golden ZoneCosmic Crypto Golden Zone
## Overview
**Cosmic Crypto Golden Zone** is an all-in-one swing trading indicator designed to identify high-probability retracement entries using Fibonacci levels, multi-timeframe confluence, and a simple Buy/Sell scoring system. The indicator removes the guesswork from trading pullbacks by combining structure analysis, momentum indicators, and volume confirmation into a single, easy-to-read signal.
**Best Used For:** Swing trading on 15m, 1H, and 4H timeframes in crypto, forex, and stocks.
---
## Key Features
### 🎯 Golden Zone Detection
Automatically identifies the optimal entry zone (0.5 - 0.786 Fibonacci retracement) where price is most likely to reverse and continue the trend.
### 📊 Buy/Sell Scoring (1-10)
A simplified signal table that scores setups from 1-10, telling you exactly when to buy or sell without needing to interpret multiple indicators.
### 📈 Multi-Timeframe Confluence
Filters trades to align with the higher timeframe trend (default: 4H), ensuring you only trade in the dominant direction.
### 🔍 Structure Detection (HH/HL/LH/LL)
Tracks market structure with Higher Highs, Higher Lows, Lower Highs, and Lower Lows to determine trend direction.
### 💧 Liquidity Sweep Detection
Identifies when price sweeps beyond the 0.886 level (stop-hunting zone) and reclaims the entry zone—a premium reversal signal.
### 📉 RSI Divergence Detection
Spots bullish and bearish divergences within the golden zone for additional confirmation.
### 🛡️ Dynamic Stop Loss
ATR-based stop loss that adjusts to current volatility, protecting you in both calm and volatile markets.
### 🎯 Smart Take Profit
Calculates TP based on your chosen entry point (FOMO, ENTRY, or Average) with customizable Risk:Reward targeting.
---
## How to Read the Signal Table
The table in the bottom-right corner gives you everything you need at a glance:
| Row | What It Shows |
|-----|---------------|
| **BUY/SELL + Score** | Direction and strength (1-10) |
| **Action** | 🚀 NOW (8+), ✓ READY (6-7), 👀 WATCH (4-5), ⏳ WAIT (<4) |
| **Zone** | Whether price is IN the golden zone or waiting |
| **Entry / TP / SL** | Your exact trade levels |
| **R:R** | Risk-to-Reward ratio with quality indicator |
### Score Breakdown
| Score | Meaning | Action |
|-------|---------|--------|
| **8-10** | High conviction setup | Enter on next candle close |
| **6-7** | Good setup | Enter with confirmation candle |
| **4-5** | Possible setup | Wait for more confluence |
| **1-3** | Weak/No setup | Skip this trade |
---
## How to Use: Step-by-Step
### Step 1: Check the Trend Direction
Look at the **Structure** in the info display:
- **BULLISH** (HH + HL pattern) → Only look for BUY signals
- **BEARISH** (LL + LH pattern) → Only look for SELL signals
### Step 2: Wait for Price to Enter the Golden Zone
The golden zone is highlighted between the **FOMO (0.618)** and **ENTRY (0.786)** levels. The table will show "✓ IN ZONE" when price reaches this area.
### Step 3: Check Your Score
Wait for the Buy/Sell score to reach **6 or higher** before considering an entry. Higher scores = higher probability.
### Step 4: Look for Confirmation
The best entries have multiple confirmations:
- ✅ Score 6+
- ✅ In Golden Zone
- ✅ Stochastic oversold/overbought
- ✅ RSI Divergence (DIV label)
- ✅ Liquidity Sweep (LIQ label) — *Premium signal*
- ✅ Bullish/Bearish candle pattern
### Step 5: Execute the Trade
Use the levels shown on the chart and in the table:
- **Entry:** FOMO (aggressive) or ENTRY (conservative)
- **Stop Loss:** Below/above the SL line (red)
- **Take Profit:** At the TP line (green)
---
## Chart Labels Explained
| Label | Color | Meaning |
|-------|-------|---------|
| **FOMO: ** | Green | 0.618 Fib - Aggressive entry level |
| **ENTRY: ** | Yellow (Bold) | 0.786 Fib - Conservative entry level |
| **LIQ: ** | Red | 0.886 Fib - Liquidity/stop-hunt zone |
| **TP: ** | Green | Take Profit target |
| **SL: ** | Red (Bold) | Stop Loss level |
| **R:R ** | Green/Orange | Risk-to-Reward ratio |
| **HH/HL/LH/LL** | Various | Structure swing labels |
| **DIV** | Lime/Pink | RSI Divergence detected |
| **LIQ** (arrow) | Lime/Red | Liquidity sweep signal |
| **AE** | Green/Red | Williams Vix Fix Aggressive Entry |
| **B/S** | Green/Red | Buy/Sell signal with score |
---
## Recommended Settings
### For Crypto (BTC, ETH, Altcoins)
- **Timeframe:** 1H or 4H
- **HTF:** 4H or Daily
- **Use Logarithmic Fibs:** ✅ ON
- **TP R:R Target:** 2.0 - 3.0
### For Forex
- **Timeframe:** 15m or 1H
- **HTF:** 4H
- **Use Logarithmic Fibs:** ❌ OFF
- **TP R:R Target:** 1.5 - 2.0
### For Stocks
- **Timeframe:** 1H or Daily
- **HTF:** Daily or Weekly
- **Use Logarithmic Fibs:** ✅ ON
- **TP R:R Target:** 2.0
---
## Settings Reference
### Structure (ZigZag)
- **Left Bars:** Lookback period for pivot detection (default: 10)
- **Right Bars:** Confirmation bars (default: 2)
- **Show Swing Labels:** Display HH/HL/LH/LL markers
### Multi-Timeframe Confluence
- **Enable MTF Filter:** Only trade when aligned with HTF trend
- **Higher Timeframe:** The timeframe to check trend (default: 4H)
### ADX Trend Strength
- **Enable ADX Filter:** Filter out choppy/ranging markets
- **ADX Threshold:** Minimum ADX value for trend confirmation (default: 20)
### Auto Fib Settings
- **Use Logarithmic Fibs:** Better for large % moves (crypto/stocks)
- **Fib Length:** How far the fib lines extend
### Split-Entry Trade Planner
- **Entry 1 Ratio:** FOMO level (default: 0.618)
- **Entry 2 Ratio:** ENTRY level (default: 0.786)
- **TP Calculation Mode:** Base TP on ENTRY, FOMO, or Average
- **TP R:R Target:** Your desired risk-to-reward ratio
- **Use ATR-Based Dynamic SL:** Volatility-adjusted stop loss
- **SL ATR Multiplier:** How many ATRs below entry for SL
### Williams Vix Fix
- **Show Bullish/Bearish AE:** Aggressive entry signals based on volatility extremes
- **Only Show in Golden Zone:** Filter VixFix signals to golden zone only
---
## Pro Tips
### 1. The Liquidity Sweep is Gold
When you see the **LIQ** arrow after price wicks below 0.886 and reclaims 0.786, this is often the best entry. Stops have been hunted, weak hands are out, and smart money is entering.
### 2. Don't Fight the HTF Trend
If the 4H is bearish, don't take long signals on the 15m just because the score is high. Always align with the bigger picture.
### 3. Wait for "IN ZONE"
Patience pays. The best setups come when price actually pulls back to the golden zone. Chasing breakouts leads to poor R:R.
### 4. Score 6+ is the Minimum
Scores of 4-5 can work, but your win rate will be significantly higher waiting for 6+. Scores of 8+ are rare but highly reliable.
### 5. Use Multiple Timeframes
Check the setup on your trading timeframe AND one timeframe higher. If both show bullish structure with good scores, confidence is higher.
### 6. Respect the Stop Loss
The SL is placed below the liquidity zone for a reason. If price closes below it, the setup is invalidated. Don't move your stop.
---
## Alerts Available
- **High Confluence Long/Short** — When score reaches your threshold
- **Bullish/Bearish Liquidity Sweep** — Premium reversal signal
- **RSI Divergence Detected** — Divergence in golden zone
- **Williams Vix Fix AE** — Aggressive entry signal
---
## Credits
Created by **Cosmic Crypto**
Combines concepts from:
- Fibonacci Retracement Trading
- Smart Money Concepts (Liquidity Sweeps)
- Williams Vix Fix
- Multi-Timeframe Analysis
- Stochastic RSI
- ADX Trend Strength
---
*Trade responsibly. Past performance does not guarantee future results. Always use proper risk management.*

Trading Monster - XAUUSD Trend EngineTrading Monster – XAUUSD Trend Engine is a clean, professional trend-following visual tool designed exclusively for Gold (XAUUSD).
The indicator focuses on identifying dominant market direction and keeping traders away from counter-trend trades. It is built to reduce noise and improve visual clarity during high-volatility sessions.
This tool is best suited for:
• Intraday and swing traders
• Trend continuation setups
• Traders who avoid counter-trend entries
Designed for clarity. Built for discipline.
This tool is best used with Trading Monster - XAUUSD Trend Validator
Trading Monster – XAUUSD Trend Validator
Trading Monster – XAUUSD Trend Validator is a focused confirmation tool designed to work alongside the Trading Monster – XAUUSD Trend Engine for Gold (XAUUSD).
The indicator helps traders validate whether market conditions are aligned with the prevailing trend, reducing the chances of entering during weak, choppy, or counter-trend phases. It acts as an additional layer of discipline by confirming trend strength before execution.
When used together with the Trend Engine, the Validator assists traders in filtering low-quality setups and staying aligned with higher-probability trend conditions.
This tool is best suited for:
• Traders seeking confirmation before entry
• Trend-aligned trade filtering
• Avoiding counter-trend and sideways market conditions
Designed for confirmation. Built for consistency.

Ichimoku Cloud Strategy - 1H HyperliquidStategy for Hyperliquid 1hr time frame using Ichimoku's Cloud.

Boyen_Clean Historical Key Levels (WO, MO, YO & Mon)Define historical Key Level Weekly Open, Montly Open and Yearly Open
Additional with current Monday low & Monday high level

Heikin Ashi Color Flip StrategyManual HA calculation → no repainting
✔ Entry on first green after red
✔ Exit on first red after green
✔ process_orders_on_close = false → orders execute on next bar open
✔ Logic is clean and readable
How to make it your kind of strategy (next step)
Given your past preferences, the best upgrade is:
• Trade only when price > EMA 21
• Or only when SPY > EMA 50 & VIX < 20
• Exit on price close below EMA 21 (your preferred rule)
Consider the following to increase win rate and decrease drawdown:
• Add EMA-21 exit instead of HA red
• Add SPY/VIX regime filter
• Give you real QQQ daily backtest metrics
• Convert this into a scan/alert-only indicator
Disclaimer:
This indicator is provided for educational and informational purposes only and does not constitute financial, investment, or trading advice. The signals generated by this indicator are not guaranteed to be accurate or profitable. Past performance is not indicative of future results. Trading and investing involve substantial risk, and you should perform your own analysis and consult a qualified financial professional before making any trading decisions. The author is not responsible for any financial losses incurred from the use of this indicator.

Global J-1 & W-1 Levels (Fixed Lines / Lignes Fixes)Description
This indicator automatically plots key price levels from the previous day (D-1) and the previous week (W-1). It is designed for Day Traders and Scalpers who need clear visual references without cluttering their chart with past history.
Unlike standard indicators that use plot() and create "step-like" lines, this script uses graphic objects (line.new) to display fixed, infinite horizontal lines, just as if you had drawn them manually.
Key Features:
D-1 Levels (Blue): Previous Day High (DR-1) and Low (DS-1).
W-1 Levels (Red): Previous Week High (WR-1) and Low (WS-1).
Clean Chart: Lines are displayed only for the current session. No historical clutter.
Readability: Dashed lines with level names and exact prices displayed on the right.
How to use it? These levels often act as institutional support and resistance. Watch for price reactions (bounces or breakouts) near these zones to confirm your trade entries.

Key Levels - BlackDelta.ioPivots Point of high interest these line are not ordinary lines they are indicating HTF Weekly levels, Base you trading ideas around these Key Levels to gain higher probability setup's once price touches one these Key Levels get ready for a big move to continuation or a reversal, pair it with your other confluences to get more edge in the market.
if this indicator helped you leave a comment below :)
@BlackDelta_
