King Trade 4-hour buy/sell strategyThis is a buy/sell system for 4-hour candlestick charts. For best results, use it on Heiken Ashi candlestick charts.
Trendanalyse

Mod_Capital-Fibo🔥 Mk_Suhropbek_Fibo — Smart Fibonacci Trading Tool 🔥
Everyone draws Fibonacci.
Only professionals use it correctly.
💎 Mk_Suhropbek_Fibo is an automated Fibonacci indicator that analyzes real market structure and displays only high-probability levels.
📊 How it works:
— Analyzes the last 100 candles
— Automatically detects market trend (BUY / SELL)
— Draws Fibonacci levels in the correct direction
— Clearly marks 0 / 0.236 / 0.382 / 1 / 1.618 (TP)
⏱ Designed for H1 and higher timeframes
✔️ No noisy scalping
✔️ Clean and readable charts
✔️ Suitable for real accounts and prop firms
🔄 Updates only every 25 bars
— Keeps the chart clean
— No constant redrawing
— Focus on quality setups, not quantity
🎯 One setup = a complete trading scenario
— Clear structure
— Logical profit target (1.618)
— No counter-trend trades
📈 Proven market logic
— No overfitting
— Reusable, consistent behavior
— Discipline over emotions
🧠 Who is this indicator for?
✔️ Traders who use Fibonacci seriously
✔️ Those tired of guessing where to draw fib levels
✔️ Traders who treat trading as a business
🚫 No random entries
✅ Clear system
✅ Structured trading
📌 Mk_Suhropbek_Fibo — not prediction, but calculation.

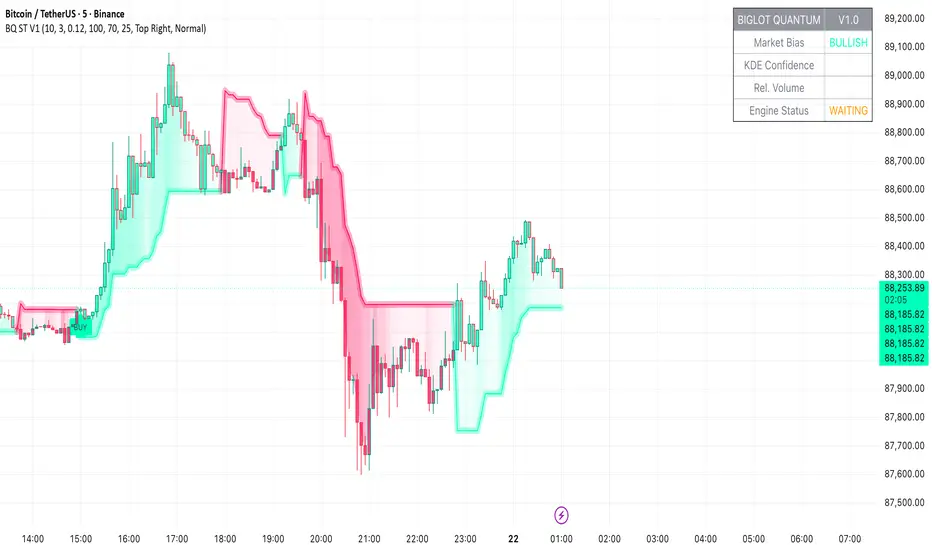
BigLot Quantum SuperTrend V1BigLot Quantum SuperTrend V1 is a trend-following indicator that enhances the traditional SuperTrend by integrating statistical volume analysis.
The script combines an ATR-based SuperTrend engine with Kernel Density Estimation (KDE) applied to relative buy and sell volume. Volume behavior is modeled statistically, allowing the indicator to filter breakout signals and activate only when volume conditions show high probability compared to historical data.
Bullish and bearish signals are generated when price crosses the SuperTrend line and the corresponding volume probability exceeds a user-defined threshold. This approach helps reduce false signals during low-liquidity or sideways market conditions.
The script includes visual trend highlighting, probability-based confidence filtering, and a real-time dashboard displaying trend direction, volume strength, and signal status. It is designed to work across all markets and timeframes without repainting.
VLB Cycle Market ToolThe VLB Dynamic Levels Tool provides a visual framework for observing price structure on XAUUSD.
It displays automatically generated levels based on a rules-based approach, allowing traders to study how price interacts with important reference areas on the chart.
The tool updates dynamically as market structure evolves, reflecting changes in price movement without requiring manual redrawing.
Its purpose is to offer a clear, consistent layout of structural levels that users can incorporate into their own market analysis.
Features:
Automatically displayed structural reference levels
Dynamic recalculation as new highs and lows form
Neutral, non-predictive visual layout
A consistent framework for studying price behavior
This tool does not generate trading signals or provide predictive information.
It simply organizes price structure into visual reference points that may assist users in their independent chart analysis.
Traders remain fully responsible for their own interpretation, timing, and risk management.
The VLB Dynamic Levels Tool is intended for those who prefer a clean and adaptable way to observe XAUUSD structure throughout changing market conditions.

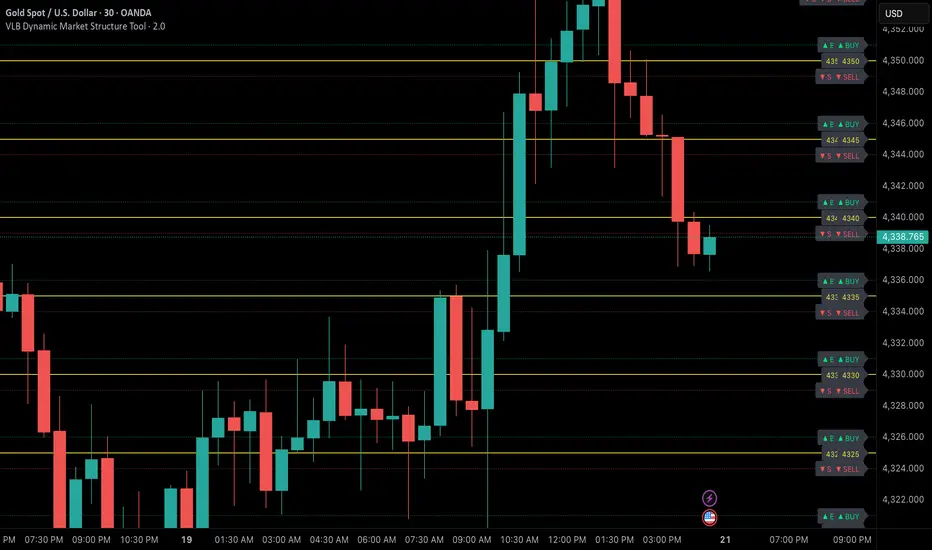
VLB Dynamic Market Structure ToolAdaptive Structural Continuation Framework for XAUUSD
The VLB Dynamic Market Structure Tool is a proprietary, rules-driven market structure framework designed specifically to analyze price continuation behavior in XAUUSD under live market conditions.
This tool does not plot static support and resistance.
Instead, it provides a continuously adapting structural model that reorganizes itself around current price, allowing traders to observe acceptance, rejection, and expansion behavior between key structural zones.
Core Conceptual Foundation
The framework is built on three integrated components that work together as a single methodology:
1. Dynamic Price-Anchored Structural Range
Unlike traditional indicators that rely on fixed historical levels, this tool anchors its entire structural range to live market price.
As price migrates:
Levels that are no longer relevant are automatically removed
New forward-relevant levels are introduced
The framework re-centers itself around active price action
This ensures that the trader is always viewing current, actionable structure, without manual redrawing or chart repositioning.
2. Evenly Spaced Structural Reference Levels
Within the dynamically anchored range, price is organized into consistent structural intervals that frequently act as transition points in XAUUSD price behavior.
These levels serve as objective reference boundaries, allowing traders to:
Compare reactions across identical structural distances
Observe recurring price behavior in a normalized framework
Maintain consistency across different sessions and market conditions
The levels are contextual, not predictive.
3. Post-Break Acceptance & Expansion Zones
The framework distinguishes between:
Initial structural breaks that fail or retrace
Confirmed acceptance beyond a defined offset from the level
Expansion phases as price transitions toward the next structural interval
By visualizing this sequence, the tool allows traders to study continuation behavior only after confirmation, rather than reacting to first-touch or initial breakouts.
Adaptive Behavior (Why This Is Not Static S&R)
A defining feature of the VLB Dynamic Levels Tool is its continuous recalculation and real-time adaptation:
The visible structure evolves with price
The framework moves up or down as market conditions change
Historical clutter is intentionally removed to preserve clarity
The trader’s focus remains on the active trading environment
This adaptive behavior is integral to the methodology and cannot be replicated through manual drawing or static indicators.
Intended Use
This tool is designed for discretionary traders who:
Study market structure, acceptance, and momentum
Prefer confirmation-based continuation frameworks
Value rule-based consistency over subjective interpretation
Combine structural context with their own execution, fundamentals, and risk management
The indicator does not generate automated buy or sell signals and does not execute trades.
Important Disclosures
No performance or outcome is guaranteed
No predictive claims are made
All trading decisions remain the responsibility of the user
Summary
The VLB Dynamic Levels Tool provides a self-adjusting, structurally consistent framework for observing how XAUUSD price transitions between key zones in real time.
Its proprietary value lies in the integration of dynamic price anchoring, structural normalization, and post-break acceptance visualization, offering a methodical way to study continuation behavior in changing market conditions.
CGM - Options Trial [Basic] - by ChartGptMarathiCGM - Options Premium Trial - by ChartGptMarathi
Description:
The CGM - Options Premium Trial is the introductory version of the advanced CGM Sniper suite, designed specifically for Option Buyers who need clarity in a chaotic market.
This indicator allows you to plot and compare Call (CE) and Put (PE) option charts simultaneously on a single pane, providing a direct view of premium behavior without switching tabs. It includes essential trend-following tools to help you identify momentum shifts instantly.
Key Features:
Dual Charting: Visualizes both Call and Put option candles on one screen for real-time comparison.
Trend Confirmation: Includes a built-in 8 EMA to gauge short-term momentum.
Volume Analysis: Integrated VWAP (Volume Weighted Average Price) for institutional level tracking.
Spot Tracking: Monitors the underlying Spot symbol (e.g., NIFTY/BANKNIFTY) data for better context.
Visual Clarity: Clean, color-coded candles (Green/Red) with customizable widths and visibility toggles.
How to Use:
Add the indicator to your chart.
In the settings, select your Call (CE) and Put (PE) symbols (e.g., NIFTY24000CE, NIFTY24000PE).
Select the Spot Symbol (e.g., NSE:NIFTY) for underlying data reference.
Use the EMA and VWAP lines to determine trend direction. If the premium price is above both lines, the momentum is bullish for that option.
Disclaimer:
This indicator is for educational and analytical purposes only. It does not constitute financial advice. Trading options involves significant risk. Please perform your own due diligence before executing any trades.
All rights reserved with ChartGptMarathi. For any feedback or support, contact at: chartgptmarathi@gmail.com

Dynamic EMA Trend Table [Customizable]Overview
The Dynamic EMA Trend Table is a comprehensive dashboard designed to give traders an instant overview of the market trend across five distinct Exponential Moving Averages (EMAs). Instead of cluttering your chart with multiple lines, this script organizes the data into a clean, customizable table, allowing you to assess trend alignment at a glance.
How It Works
This indicator calculates five user-defined EMAs (defaulting to the popular 5, 20, 50, 100, and 200 periods). It then compares the Current Price against each EMA value to determine the immediate trend status:
Bullish State: When the current price is above the specific EMA, the table cell turns Green (customizable).
Bearish State: When the current price is below the specific EMA, the table cell turns Red (customizable).
This logic allows swing traders and scalpers to instantly see if the asset is in a strong uptrend (all cells Green), a strong downtrend (all cells Red), or a consolidation phase (mixed colors).
Key Features
Fully Customizable Periods: Change the length of all 5 EMAs to fit your specific strategy (e.g., Fibonacci numbers or standard Swing Trading settings).
Dynamic UI: Position the table anywhere on the screen (Top/Bottom/Left/Right) and adjust the size to fit your screen resolution.
Visual Cleanliness: You can choose to show the table only, or toggle the "Show EMAs on Chart" option to plot the actual lines on your chart.
Smart Coloring: The lines on the chart (if enabled) inherit the same color logic as the table—turning Green when price is above them and Red when price is below.
Settings & Configuration
Price Source: Select Close, High, Low, etc. (Default is Close).
Table Position & Size: Customize where the dashboard appears.
EMA Lengths: Set your 5 preferred lookback periods.
Color Theme: Fully adjustable colors for Bullish, Bearish, Neutral, and Background elements to match your chart theme (Dark/Light mode friendly).
Use Case Example
Trend Confirmation: A trader looking for a "Buy" entry might wait for the short-term EMAs (5 and 20) and the medium-term EMA (50) to all turn Green in the table before entering.
Support/Resistance Watch: By quickly glancing at the values in the table, you can see exactly where the 200 EMA sits without needing to scroll back on your chart to find the line.

Swing Master by Pooja📘 Swing Master by Pooja
Invite-Only | Rule-Based Swing & Trend Structure Indicator
🔍 What this indicator is
Swing Master by Pooja is a rule-based technical analysis indicator designed to help traders identify high-quality swing opportunities within an established trend structure.
This script is not a trading strategy.
It does not execute trades and does not provide fixed targets or stop-loss levels.
Instead, it functions as a decision-support tool.
Visual signals appear only on confirmed candles, and only when trend structure, momentum, and market participation align together.
The core objective of this indicator is filtering low-quality market conditions and avoiding random entries, not generating frequent signals.
🎯 Intended Trading Use
This indicator is intended for traders who:
Trade trend-based swings and pullbacks
Prefer structure-aligned entries instead of chasing price
Want multi-factor confirmation before acting
Apply their own execution and risk-management rules
Applicable on:
Indices
Stocks
Futures
Intraday & higher-timeframe swing charts
🧠 Why this is NOT a simple indicator mashup
Although Swing Master uses EMA, RSI, Volume, and multi-timeframe context, each component serves a distinct and non-overlapping role.
No indicator is used to confirm itself, and no single condition can trigger a signal independently.
Signals are generated only when all required structural and momentum conditions align together on a confirmed bar, reducing noise and hindsight bias.
🔹 EMA Structure (50 / 100 / 200)
Defines trend hierarchy and market structure
Strictly filters trades in the dominant trend direction
Identifies pullback zones, not breakout points
EMA stacking is used to determine structural bias, not direct entries.
🔹 Pullback-Tolerance Logic (Key Original Component)
Instead of requiring exact EMA touches, the script applies a tolerance-based pullback zone around EMAs.
This allows:
More realistic swing entries
Fewer missed opportunities
Reduced noise compared to rigid EMA rules
This pullback-zone evaluation is custom-designed and central to the indicator’s behavior.
🔹 RSI Momentum Filter
Ensures pullbacks occur with momentum acceptance
Filters entries during weak or exhausted moves
Helps avoid counter-trend traps
RSI is used strictly as a momentum-quality filter, not as a standalone signal.
🔹 Volume Participation Filter
Confirms that price movement has market participation
Filters signals during low-interest or weak-volume phases
Helps avoid false continuation attempts
🚦 Signal Types Explained (Rule-Specific & Non-Repeating)
Each visual signal represents a distinct market condition, not repeated logic.
▸ sb — Swing Buy
Trend-aligned pullback near EMA structure
RSI confirms momentum
Volume confirms participation
▸ FS — Future Sell
Mirror logic of Swing Buy
Appears only in established downtrends
▸ SB / SS — Strong Buy / Strong Sell Zones
Price acceptance above or below all EMAs
Indicates strong directional control
Plotted only on the first bar of zone entry (no repetition)
▸ GB / GS — Golden Buy / Golden Sell
EMA 100 / EMA 200 crossover
Represents a structural trend transition
Appears only on confirmed crossovers
Each signal type follows its own independent rule-set.
📊 Multi-Timeframe Dashboard (Context Only)
The optional dashboard provides:
Trend state across higher timeframes
Top-down market context for directional bias
The dashboard is informational only and does not generate signals.
🔔 Alerts
Alert conditions are available for all signal types.
Alerts trigger only on confirmed candles and are intended to support manual analysis, not automated trading.
🔐 Why Invite-Only & Closed-Source
Swing Master incorporates:
Stateful signal control
Multi-condition validation
Non-repeating signal logic
Custom pullback-zone evaluation
The source code is protected to preserve the internal interaction, sequencing, and state management logic, not to conceal commonly known indicators.
⚠ Disclaimer
This indicator is provided for educational and analytical purposes only.
It does not constitute financial advice and does not guarantee results.
All trading decisions, execution, and risk management remain entirely the user’s responsibility.

Smart Triangles & S/R SystemOverview This indicator is a comprehensive technical analysis tool designed to automatically identify dynamic chart patterns and institutional support/resistance structures. Its primary focus is on detecting valid Triangle Patterns (Symmetrical, Ascending, Descending) and identifying high-probability breakout zones using a proprietary "Smart Apex" algorithm.
Why is this script Protected? This script utilizes a unique, custom-built algorithm called "Smart Start & Apex Validation". Unlike standard pivot-based indicators, this system dynamically recalculates the starting points of trendlines to exclude false wicks and noise (Smart Start). Furthermore, it employs a geometric validation logic that calculates the exact intersection point (Apex) of the trendlines to ensure the triangle exists in the future and has not already invalidated itself mathematically. Due to the complex and proprietary nature of these calculation methods and the specific filtering logic for "Fresh" vs. "Broken" horizontal levels, the source code is protected to maintain the integrity of the strategy.
Key Features
Smart Triangle Detection:
Uses Pivot Highs/Lows to draw trendlines.
Smart Start Logic: Automatically shifts the trendline start point if a candle body violates the slope, ensuring lines "hug" the price action correctly.
Apex Validation: Ensures lines are converging and the intersection point is valid.
Institutional S/R Levels:
Automatically plots horizontal Support and Resistance levels based on historical pivot clusters.
Distinguishes between Fresh Levels (Untouched) and Broken Levels (flipped S/R), color-coded for visual clarity.
Dynamic Targets:
Projects breakout targets based on the triangle's opening height (Base).
Target Memory: Once a breakout occurs, the target remains fixed on the chart until a completely new pattern invalidates it, allowing traders to track the trade lifecycle.
How to Use
Trendlines: Look for price compression between the Red (Resistance) and Green (Support) dotted lines.
Breakouts: Wait for a candle close outside the triangle structure. The indicator will generate a "Target Flag" indicating the potential price objective.
Confluence: Use the horizontal S/R lines as confirmation for entry or stop-loss placement.
Settings
Triangles: Adjust pivot lengths to catch larger or smaller structures. Toggle "Smart Start" for cleaner lines.
Slope Rules: Filter out weak patterns by enforcing minimum slope requirements.
S/R Zones: Customize the lookback period and visibility of horizontal levels.
Development & Feedback I am actively developing this tool to make it the definitive structure indicator. I highly value community feedback. Please leave your suggestions or feature requests in the comments section below. I read all feedback to improve future versions.
Disclaimer: This tool is for educational purposes and assists in technical analysis. Past performance is not indicative of future results.

The Cantillon Institutional overlay (pro)🏛 Stop Trading the "Rearview Mirror." Start Tracking the Flow.
Most retail indicators (RSI, MACD, Moving Averages) suffer from a fatal flaw: they are derivatives of past price. They tell you what has already happened.
The Cantillon Institutional Overlay is different. It is designed to track the "First Receivers" of liquidity—the institutions, banks, and market makers who move the market—rather than the retail crowd chasing it.
Based on the economic principles of Richard Cantillon (18th Century), this tool visualizes the "Unfair Advantage" of the insider. It answers two critical questions:
Where is the true trend? (The Institutional Average)
Where is the trap? (The Statistical Extremes)
🛠 What is Inside?
This script combines three institutional data points into a single, clean overlay:
1. The Institutional Anchor (Cyan AVWAP) This is not a standard Moving Average. It is an Anchored Volume Weighted Average Price, typically anchored to the session or week open.
Logic: This represents the average entry price of the "First Receivers."
Signal: If Price > AVWAP, institutions are net long (Markup Phase). If Price < AVWAP, institutions are net short (Markdown Phase).
2. The Sigma Bands (Statistical Traps) Standard Deviation channels that adapt to volatility.
The Red Band (+2σ): The "Statistical Ceiling." When price hits this, it is mathematically over-extended. This is where institutions often offload positions into retail FOMO (The Trap).
The Green Band (-2σ): The "Statistical Floor." This is the buy zone for mean reversion.
3. Institutional Order Blocks Automatically highlights hidden zones of liquidity where resting orders are likely waiting. These act as "magnets" for price action.
🎯 How to Trade This
Strategy A: The Trend Follower
Rule: Only take Longs when price is above the Cyan AVWAP line.
Trigger: Wait for price to pull back to the Gray "Fair Value" zone and reject.
Strategy B: The Reversion Trader (The Fade)
Rule: Fade the extremes.
Trigger: If price hits the Red Sigma Band (+2σ) and volume dries up, the move is exhausted. We look for shorts back to the mean.
⚠️ Why "First Receivers"?
In the Cantillon Effect, money flows to the insiders first. By the time it trickles down to retail indicators, the move is often over. This overlay allows you to align your bias with the "House" rather than the "Gambler."
Recommended Setup: For the complete institutional view, pair this Overlay with The Cantillon CVD to confirm volume intent behind every move.
Disclaimer: This tool provides statistical analysis and does not guarantee profits. Past performance is not indicative of future results.

Order Blocks & ImbalanceThis indicator automatically identifies and plots Order Blocks (also known as Fair Value Gaps or Imbalances) based on Smart Money Concepts (SMC) and ICT methodology. It detects significant price inefficiencies (gaps between candles) that often act as institutional supply or demand zones.
How It Works (Technical Methodology)
1. Fair Value Gap (FVG) Detection
The indicator identifies classic 3-candle imbalances:
- Bullish Order Block (Demand): When the low of the current candle is significantly below the high of the candle two bars ago (low - high ).
- Bearish Order Block (Supply): When the high of the current candle is significantly above the low of the candle two bars ago (low - high ).
A minimum size threshold is enforced using ATR(14) × user-defined multiplier (default 0.5) to filter out minor gaps and focus on meaningful inefficiencies.
2. Zone Creation
- Bullish zones are created at the candle two bars ago (the "origin" candle where inefficiency occurred).
- Bearish zones use the same origin candle.
- Zone boundaries:
Top = high of origin candle
Bottom = low of origin candle
This captures the full range where price moved aggressively, leaving an imbalance that institutions may later revisit.
3. Mitigation Detection
Zones can be mitigated in two ways (user-selectable):
- "Close": Zone is considered touched only if the close price enters the zone.
- "Wick": Zone is touched if any wick (high/low) enters the zone (more sensitive).
When mitigated:
- Background becomes more transparent
- Border turns dotted
- Label changes to "Mitigated"
Broken zones (price fully closes beyond the opposite side) are automatically deleted.
4. Zone Lifecycle Management
- Active Zone: Strong color fill (green for demand, red for supply) with solid border.
- Mitigated Zone: Faded color, dotted border – indicates partial fill or reduced strength.
- Broken Zone: Automatically removed from chart to reduce clutter.
Old zones are also pruned when exceeding 450 total to maintain performance.
5. Smart Visibility Engine (Optional)
When enabled:
- All zones are initially hidden.
- Only the closest relevant zones are shown:
- Up to user-defined limit (default 10) highest bullish zones (closest below price)
- Up to user-defined limit (default 10) lowest bearish zones (closest above price)
- Visible zones are automatically extended to the right and styled appropriately.
This keeps the chart clean while highlighting the most actionable zones near current price.
6. Visual Elements
- Demand Zones: Green fill, labeled "OB Demand"
- Supply Zones: Red fill, labeled "OB Supply"
- Tiny text size to minimize chart clutter
- Zones drawn as boxes using bar_index positioning
How to Use
Order Blocks represent areas of price inefficiency where smart money likely entered/exited positions aggressively.
- Demand Zones (Green): Potential long entry areas when price returns. Expect buying pressure to defend these levels. Best setups when price retests an active (non-mitigated) zone.
- Supply Zones (Red): Potential short entry areas when price returns. Expect selling pressure to emerge.
- Mitigated Zones: Lower probability – may act as weaker support/resistance.
- Smart Visibility: Highly recommended for cleaner charts. Focuses attention on zones most likely to be tested soon.
- Combine with:
- Break of Structure (BOS)/Change of Character (CHOCH)
- Liquidity grabs
- Higher timeframe confluence
- Volume or momentum confirmation
Use higher FVG threshold (e.g., 0.8–1.0) for fewer, higher-quality zones. Lower threshold for more aggressive detection.
Disclaimer
This indicator is a technical analysis tool and should be used in conjunction with other forms of analysis. Past performance does not guarantee future results. Always use proper risk management.

Exhaustion [Lite]EXHAUSTION — Lite is a simplified sequential exhaustion instrument based on a Hull Moving Average with a 9-count structure. It is designed to expose when continuation begins to weaken, not to call tops or bottoms. The Lite version shows local exhaustion pressure only (LTF/MTF).
What the Lite Version Shows
HMA-based trend state (Green / Red)
Sequential counting up to 9
Local exhaustion points in the current timeframe
What it does not include:
No higher-timeframe structure
No dashboard or multi-timeframe context
Those layers are intentionally removed.
How to Use (Lite Workflow) :
Core Idea :
Continuation weakens as the count progresses.
The higher the count, the less reliable continuation becomes.
Basic Reading
Counts 1–3 → early continuation
Counts 4–6 → trend aging
Counts 7–9 → exhaustion risk
A 9 marks pressure — not a guaranteed reversal.
Practical Usage :
Trend Context (Single Timeframe)
Stay aligned with the HMA color
Treat late counts (7–9) as risk, not signals
Avoid entering fresh positions late in the sequence
Timing Awareness
Exhaustion matters most near:
prior highs/lows
liquidity zones
session extremes
The Lite version is about awareness, not execution precision.
Important Note :
Exhaustion — Lite does not show higher-timeframe exhaustion or alignment.
Without HTF context, exhaustion should be treated as local pressure only. If you want: HTF interaction and a multi-time frame dashboard, that belongs to the Full indicator.
*This script doesn't constitute investment advice and isn't created solely for qualified investors.

RSS3 - Reversal Score System v3 [Rulph]RSS3 - Reversal Score System v3
RSS3 is a quantitative reversal detection system that combines volatility pressure analysis with directional momentum exhaustion to produce a unified reversal strength score from -1 (extreme bullish) to +1 (extreme bearish).
Unlike traditional single-indicator divergence systems (RSI, MACD), RSS3 cross-validates signals between two independent analytical engines (VPI and TDFI) and applies multi-timeframe contextual filtering to reduce false signals.
RSS3 is not a visual overlay of separate indicators. It implements a unified calculation pipeline where VPI and TDFI components feed into a single normalized Score through weighted aggregation. The divergence bonus system creates feedback loops where price-indicator relationships dynamically adjust the final Score, producing signals that cannot be replicated by simply viewing RSI, Bollinger Bands, and moving averages side-by-side.
━━━━━━━━━━━━━━━━━━━━━━━━━━━━━━━━━━
WHY COMBINE VOLATILITY + TREND FORCE?
━━━━━━━━━━━━━━━━━━━━━━━━━━━━━━━━━━
Most reversal systems rely on a single dimension:
• RSI divergence tracks momentum exhaustion
• Bollinger extremes track volatility expansion
• MACD divergence tracks trend deceleration
RSS3 recognizes that major reversals typically require both :
1. Volatility pressure buildup (market stretched beyond normal range)
2. Directional force exhaustion (trend losing momentum despite stretched price)
When VPI (volatility) and TDFI (trend force) diverge simultaneously from price, it signals a high-probability reversal zone. When only one diverges, the signal is weighted accordingly.
This dual-validation approach filters out:
• Momentum exhaustion in low-volatility consolidations (no VPI confirmation)
• Volatility spikes within strong trends (no TDFI exhaustion)
━━━━━━━━━━━━━━━━━━━━━━━━━━━━━━━━━━
COMPONENT 1: VOLATILITY PRESSURE INDEX (VPI)
━━━━━━━━━━━━━━━━━━━━━━━━━━━━━━━━━━
VPI quantifies how far the market has deviated from its equilibrium state using four factors:
1. RSI deviation from 50
Measures directional bias accumulation. When RSI stays at 70+ or 30- for extended periods, it signals persistent one-sided pressure.
2. Annualized volatility (VIX-style)
Calculates rolling standard deviation of returns scaled to annual terms. Rising volatility indicates increasing uncertainty and potential for mean reversion.
3. Normalized candle range
Compares current bar's range to recent average range. Expanding ranges signal climactic moves.
4. Bollinger Band position
Measures price distance from statistical mean (middle band). Touches or penetrations of outer bands indicate statistical overextension.
How they combine:
Each component is normalized to 0-1 scale, then weighted based on current market regime (trending vs ranging). The weighted average produces VPI reading where:
• VPI > 0.5 = overbought pressure zone
• VPI < -0.5 = oversold pressure zone
━━━━━━━━━━━━━━━━━━━━━━━━━━━━━━━━━━
COMPONENT 2: TREND DIRECTION FORCE INDEX (TDFI)
━━━━━━━━━━━━━━━━━━━━━━━━━━━━━━━━━━
TDFI measures the strength and sustainability of directional movement using moving average dynamics:
1. MA spread (fast MMA vs slow SMMA)
When fast MA pulls far from slow MA, it indicates strong directional momentum. When the spread contracts, momentum is fading.
2. Average impulse between MAs
Calculates the velocity of the spread change. Rapid expansion = acceleration phase; slowing expansion or contraction = deceleration/exhaustion.
3. Normalized trend strength
The spread and impulse are normalized relative to recent volatility to make TDFI comparable across different instruments and market conditions.
Output:
• TDFI > 0.7 = unsustainably strong bullish momentum
• TDFI < -0.7 = unsustainably strong bearish momentum
• TDFI near 0 = directionless or balanced market
━━━━━━━━━━━━━━━━━━━━━━━━━━━━━━━━━━
SCORE CALCULATION & DIVERGENCE INTEGRATION
━━━━━━━━━━━━━━━━━━━━━━━━━━━━━━━━━━
Base Score:
Score = (VPI_weight × VPI) + (TDFI_weight × TDFI)
This creates a continuous measure where:
• Score > +0.5 = bearish reversal zone (high VPI + weak bullish TDFI)
• Score < -0.5 = bullish reversal zone (low VPI + weak bearish TDFI)
Divergence Bonus System:
When classic divergences are detected (price makes new high/low but VPI or TDFI doesn't), a bonus/penalty is applied to Score:
• Decay mechanism: Divergence influence fades linearly over 15 bars (default). Fresh divergences have maximum impact; older ones gradually lose weight.
• Amplitude weighting: Larger divergences (bigger spread between price and indicator pivots) receive stronger bonuses.
• Dual-source amplification: When VPI and TDFI diverge on the same pivot (double divergence), their bonuses stack, creating extreme Score readings near ±1.0.
This means:
• Score = 0.9 with v3t2 label = third VPI + second TDFI bearish divergence, very high confidence
• Score = -0.85 with v1 label = first VPI bullish divergence, strong but early signal
━━━━━━━━━━━━━━━━━━━━━━━━━━━━━━━━━━
CALCULATION MECHANICS (DETAILED)
━━━━━━━━━━━━━━━━━━━━━━━━━━━━━━━━━━
VPI Component Weighting:
Weights are dynamically adjusted based on market regime detected by TDFI:
• Trending regime (|TDFI| > 0.5): RSI deviation 40%, BB position 30%, volatility 15%, range 15%
• Ranging regime (|TDFI| < 0.3): Volatility 35%, range 35%, RSI deviation 15%, BB position 15%
• Transition zones: linear interpolation between the two weight sets
Normalization Approach:
Each VPI/TDFI component is rescaled using rolling percentile rank over 100-bar window:
• Value at 100th percentile (highest) → 1.0
• Value at 0th percentile (lowest) → 0.0
• Current value → percentile position between 0-1
This makes the indicator adaptive to changing volatility and comparable across instruments.
Divergence Amplitude Measurement:
When a divergence is detected, its strength is quantified as:
Amplitude = (price_pivot_delta / ATR) × (indicator_pivot_delta / indicator_stddev)
Where:
• price_pivot_delta = distance between current and previous pivot
• indicator_pivot_delta = distance between indicator values at those pivots
• ATR and stddev provide normalization
Larger amplitude → larger bonus/penalty to Score (up to ±0.3 maximum).
Decay Function:
Divergence bonus decays linearly: Bonus(t) = Initial_Bonus × (1 - t/15), where t is bars since divergence. After 15 bars, bonus reaches zero. This ensures recent divergences dominate the Score.
Why This Design:
This architecture creates a system where:
• Components adapt to market regime automatically
• Signals are normalized across timeframes and instruments
• Multiple divergences create amplification (bonuses stack)
• Stale signals fade out naturally
This is fundamentally different from displaying RSI + Bollinger + MA separately, as the unified Score cannot be replicated by visual inspection alone.
━━━━━━━━━━━━━━━━━━━━━━━━━━━━━━━━━━
SEQUENTIAL DIVERGENCE LABELS (v/t SYSTEM)
━━━━━━━━━━━━━━━━━━━━━━━━━━━━━━━━━━
Each divergence is tracked separately for VPI and TDFI:
v-series: VPI divergences (v1, v2, v3...)
t-series: TDFI divergences (t1, t2, t3...)
The counter increments each time a new divergence appears in the same direction (e.g., consecutive bearish divergences). When direction flips (bearish → bullish), counters reset to 1.
Why this matters:
• v1 or t1 = early warning, potentially premature
• v3 or v4 = late-stage exhaustion, higher probability of reversal
• v2t3 = double divergence with second VPI + third TDFI = strong confluence
Traders can filter signals by label:
• Aggressive: trade v1/t1
• Conservative: wait for v2+/t2+ or double divergences
━━━━━━━━━━━━━━━━━━━━━━━━━━━━━━━━━━
MULTI-TIMEFRAME FILTER
━━━━━━━━━━━━━━━━━━━━━━━━━━━━━━━━━━
The MTF filter analyzes a higher timeframe to determine if the current market structure supports the divergence signal.
Modes:
• Off: All divergences shown
• Reduce: Counter-trend divergences have their bonus reduced by 70% (visual indication: dimmed/gray markers)
• Block: Counter-trend divergences completely hidden
Logic:
If 1H shows bearish divergence but 4H is in strong uptrend (Score < -0.3), the 1H signal is likely premature. MTF filter prevents entering shorts against higher timeframe momentum.
This protects against:
• Catching falling knives in strong downtrends
• Shorting pullbacks in strong uptrends
• Low-probability mean-reversion attempts
━━━━━━━━━━━━━━━━━━━━━━━━━━━━━━━━━━
HOW TO USE RSS3
━━━━━━━━━━━━━━━━━━━━━━━━━━━━━━━━━━
Entry Setup:
1. Wait for divergence marker (green = bullish, red = bearish)
2. Check Score magnitude:
• |Score| > 0.5 = higher confidence
• |Score| > 0.8 = extreme zone
3. Check v/t label:
• v1/t1 = early (more risk, more reward potential)
• v2+/t2+ or double = late but more reliable
4. Optional: wait +2 bars for pivot confirmation
Exit Options:
• Conservative: opposite divergence appears
• Aggressive: Score crosses through 0 or opposite ±0.5 threshold
• Always use volatility-based stop (2-3× ATR)
Timeframe Recommendations:
• 5-15m: intraday (use MTF 1H-4H)
• 1-4H: swing trading (use MTF Daily-Weekly)
• Daily: position trading (use MTF Weekly-Monthly)
Complementary Tools:
RSS3 is a reversal timing engine, not a complete strategy. Combine with:
• Support/resistance for target zones
• Volume analysis for confirmation
• Trend filters for directional bias
━━━━━━━━━━━━━━━━━━━━━━━━━━━━━━━━━━
WHAT MAKES RSS3 ORIGINAL
━━━━━━━━━━━━━━━━━━━━━━━━━━━━━━━━━━
vs Traditional RSI Divergence:
• RSI divergence = binary yes/no
• RSS3 = quantified strength score with dual-source validation
vs MACD Divergence:
• MACD = single dimension (momentum)
• RSS3 = volatility pressure + trend force + MTF context
vs Bollinger + RSI mashup:
• Standard mashup = two separate signals
• RSS3 = unified scoring system where components interact through weighted bonuses
Unique features:
• Decay-weighted divergence bonuses (recent divergences matter more)
• Amplitude-sensitive scoring (stronger divergences = higher score impact)
• Sequential tracking (v/t labels show signal maturity)
• MTF-aware filtering (context-dependent signal validation)
• Closed-loop system (divergences → Score → priority weighting → signal)
━━━━━━━━━━━━━━━━━━━━━━━━━━━━━━━━━━
EXAMPLE INTERPRETATION
━━━━━━━━━━━━━━━━━━━━━━━━━━━━━━━━━━
Scenario: BTC 2H chart shows:
• Red triangle appears above price
• Label: v1 + t2
• Recent Score Value: 1
What this means:
• Second consecutive TDFI bearish divergence detected (t2)
• First VPI bearish divergence on same pivot (v1)
• Double divergence stacking → Score near maximum
• Market is in extreme overbought/overextended zone
• High probability of short-term reversal
Trading decision:
• Aggressive trader: short immediately with tight stop
• Conservative trader: wait for Score to drop below 0.5 or opposite divergence for exit
━━━━━━━━━━━━━━━━━━━━━━━━━━━━━━━━━━
CHART LEGEND
━━━━━━━━━━━━━━━━━━━━━━━━━━━━━━━━━━
The published chart shows:
• Green triangles below price = bullish divergences (v/t labels indicate sequence)
• Red triangles above price = bearish divergences
• Score line in lower panel = reversal strength from -1 to +1
• Colored clouds = pressure accumulation zones (optional display)
• Text annotations = example entry/exit points for educational purposes
━━━━━━━━━━━━━━━━━━━━━━━━━━━━━━━━━━
Disclaimer: All trading involves risk. This indicator does not guarantee profits. Always backtest and apply proper risk management.

4 EMAs with Narrow Range HighlightThis script is apply 4 EMAs in single indicator 20, 50, 100, 200 EMAs, this also highlights narrow ranges with blue colour

Hybrid CCI Scalper ProHybrid CCI Scalper Pro is a sophisticated trading system designed to solve the biggest problem in scalping: False Signals in Choppy Markets.
Unlike standard CCI indicators that fire on every crossover, the HCS Pro uses a Hybrid Logic Engine that distinguishes between high-probability Trend Continuations and powerful Reversal Setups. It processes every potential entry through a 6-factor "Quality Filter" before generating a signal.
Core Features:
1. The Hybrid Signal Engine The script identifies two distinct market conditions:
TREND Mode: Triggers when price is aligned with the Daily/Local trend AND the CCI angle is steep.
REVERSAL Mode (REV): Triggers only on Extreme Momentum (steep angle) combined with a Zero-Line cross, allowing you to catch tops and bottoms without waiting for lagging trend indicators.
2. The Quality Scoring System (Q-Score) Every signal is rated from 0 to 6 stars based on confluence. The signal label shows Q: 4/6, Q: 5/6, etc.
Score 4+: High probability (Recommended).
Score 6: "The Perfect Storm" – All filters (Trend, Volume, RSI, ADX) align.
3. The "Ironclad" Filters To eliminate fake-outs, the script enforces strict rules:
Candle Color Guard: Never Buys on a Red candle or Sells on a Green one.
Angle validation: Flat CCI movement is ignored.
MTF Trend: Checks the Daily timeframe (D1 EMA) to ensure you aren't scalping against the major flow.
Noise Filter: Uses ATR and Volume to ignore low-volatility "dead" markets.
4. The Information Panel A clean dashboard on the top-right displays real-time metrics:
Current Daily Trend (Bull/Bear)
Momentum Strength (Weak/Strong/Extreme)
ADX Power (Trending vs Ranging)
Live Signal Score
How to Trade:
BUY Signal: Look for a Green Triangle. Ideally, the Label should say TREND or REV with a Quality Score of 4/6 or higher.
SELL Signal: Look for a Red Triangle with a high Quality Score.
No Signal? If the panel says "WAIT" or the score is low, the market is likely choppy. Stay out.
Recommended Settings:
Gold (XAUUSD): Works best on 15m.
Forex (EURUSD): Works well on 5m - 15m.
Default settings are optimized for a balance between frequency and accuracy.

Witch-Fire ALMA signals: Dynamic Liquidity & Trend GlowThe Witch-Fire ALMA is a high-precision trend bias and liquidity mapping tool designed for price action traders and Smart Money practitioners. Unlike traditional indicators that clutter your chart with lagging signals, this script provides a "clean-yet-powerful" visual anchor to help you stay on the right side of the market while identifying key Points of Interest (POIs).
At its core, the script utilizes an optimized Arnaud Legoux Moving Average (ALMA). Known for its superior ability to balance smoothness and responsiveness, the ALMA effectively filters out market noise and "whipsaws" that often plague standard EMAs.
Key Features:
The Witch-Fire Glow: A neon-styled ALMA line that shifts between Bullish Green and Bearish Red. The white core provides surgical precision for price intersection, while the outer glow visualizes the strength and dominance of the current trend.
Scaled Liquidity Levels: Automatically maps Buy Side Liquidity (BSL) and Sell Side Liquidity (SSL). These levels are dynamic—they scale proportionally with your ALMA settings. This ensures that the liquidity zones you see are always relevant to the trend cycle you are analyzing.
Strategic Bias Background: A subtle background tint provides an instant psychological filter. Only look for Longs in the green zone and Shorts in the red zone to maintain a high-probability strike rate.
How to Trade with Witch-Fire:
Identify the Bias: Look at the Fire ALMA. If the "fire" is red and the price is below the line, your bias is strictly bearish.
Watch the Sweeps: Wait for the price to "sweep" (pierce with a wick) the horizontal SSL (Green) or BSL (Red) lines.
Execution: Look for a strong rejection candle (long wick, small body) at these levels that closes back towards the ALMA line.
Best Used On: 15m, 1H, and 4H timeframes. Works exceptionally well for Crypto, Forex, and Indices.

Pre-Market + Daily + Weekly RTH Range Boxes📦 Pre-Market + Daily + Weekly RTH Range Boxes
This indicator automatically plots Pre-Market, Daily, and Weekly range boxes based strictly on US Regular Trading Hours (RTH).
What it does:
Pre-Market Box (04:00–09:30)
Captures the full pre-market high and low, then projects the range forward from the RTH open.
Daily RTH Box (09:30–16:00)
Tracks the previous day’s regular session high and low and plots the range starting at 04:00 the next day.
Weekly RTH Box (Mon–Fri, 09:30–16:00)
Accumulates the full weekly RTH range and plots it at 04:00 on Monday.

[ASFX] Free Automatic VWAPsAutomatic VWAP & Key Levels
Overview
This indicator is designed to help traders evaluate VWAP interactions in context, rather than treating every VWAP touch as a trade opportunity. It combines VWAP with a momentum-based directional filter to highlight situations where price interaction with VWAP is supported by broader intraday momentum. This indicator also shows you the initial balance and opening range each day.
Concept and Originality
VWAP is commonly used as an institutional reference level, but VWAP alone does not distinguish between meaningful acceptance/rejection and random intraday chop. This script addresses that limitation by conditioning VWAP interactions with a momentum filter. Signals are only displayed when price location and momentum alignment occur together, allowing traders to focus on higher-quality VWAP reactions instead of monitoring multiple indicators separately.
How It Works
• VWAP is used as the primary price reference level.
• A momentum filter evaluates directional bias and participation.
• Visual signals appear only when price is interacting with VWAP and momentum confirms acceptance or rejection in the same direction.
• No signals are shown during low-momentum or sideways conditions around VWAP.
How to Use
This indicator is best used as a confirmation tool, not as a standalone trading system. It is intended to assist traders in filtering VWAP-based trade ideas by highlighting when conditions are aligned versus when price is simply chopping around VWAP.
Markets and Timeframes
• Designed for index futures such as ES and NQ
• Optimized for intraday trading
• Works best on lower timeframes (1–5 minute charts)
Limitations
• Not predictive
• Not a complete trading strategy
• Does not replace price action analysis, trade management, or risk control
• Signals should be evaluated alongside market structure and context

ICT Liquidity Sweep/Swing Fail Pattern V.1# ICT Liquidity Sweep/Swing Fail Pattern V.1
## Indicator Description & User Guide
---
## 📊 Indicator Overview
**Name:** ICT Liquidity Sweep/Swing Fail Pattern V.1
**Type:** Support/Resistance & Liquidity Detection
**Trading Style:** ICT Concepts (Inner Circle Trader)
**Best Timeframes:** 1M, 5M, 15M, 1H
---
## 🎯 Core Features
### 1. **Support & Resistance Lines**
- Automatically draws key swing high and swing low levels
- Based on significant pivot points in price structure
- Updates dynamically as new swings form
### 2. **"X" Mark - Liquidity Sweep**
- **Symbol:** X marker on chart
- **Meaning:** Indicates a liquidity sweep (stop hunt)
- **What it shows:** Price briefly moved beyond a key level to trigger stops, then reversed
- **Trading significance:** High-probability reversal zones after liquidity is taken
### 3. **"SFP" Label - Swing Failure Pattern**
- **Symbol:** SFP text label
- **Meaning:** Swing Failure Pattern detected
- **What it shows:** Price attempted to make a new high/low but failed and reversed sharply
- **Trading significance:** Strong reversal signal - smart money rejecting the level
---
## 📈 How to Use This Indicator
### Entry Setup Strategy:
#### **For SHORT Trades (Sell):**
1. Wait for **SFP** to appear at a swing high
2. Look for **X marker** confirming liquidity sweep above the high
3. **Entry Zone (Red Box):** Enter SHORT positions when price returns to this zone
4. **Stop Loss:** Place above the red zone (above the swept high)
5. **Take Profit (Green Box):** Target the green zone below
#### **For LONG Trades (Buy):**
1. Wait for **SFP** to appear at a swing low
2. Look for **X marker** confirming liquidity sweep below the low
3. **Entry Zone (Green Box):** Enter LONG positions when price returns to this zone
4. **Stop Loss:** Place below the green zone (below the swept low)
5. **Take Profit (Red Box):** Target the red zone above
---
## 🎨 Color Coding System
| Color | Zone Type | Usage |
|-------|-----------|-------|
| 🔴 **Red Box** | Stop Loss / Supply Zone | Place SL here for LONG trades / Entry zone for SHORT trades |
| 🟢 **Green Box** | Take Profit / Demand Zone | Target zone for LONG trades / Place SL here for SHORT trades |
| ❌ **X Mark** | Liquidity Sweep Point | Stop hunt occurred - reversal likely |
| 📝 **SFP Label** | Swing Failure Pattern | Failed breakout - strong reversal signal |
---
## 💡 Trading Examples
### Example 1: SHORT Trade (As shown in your chart)
```
1. SFP appears at swing high (Red zone around 4,000)
2. X marker confirms liquidity sweep above the high
3. Entry: SHORT when price re-enters red zone
4. Stop Loss: Above red zone (e.g., 4,002)
5. Take Profit: Green zone below (3,964-3,972)
6. Risk:Reward = 1:3+
```
### Example 2: LONG Trade
```
1. SFP appears at swing low (Green zone)
2. X marker confirms liquidity sweep below the low
3. Entry: LONG when price re-enters green zone
4. Stop Loss: Below green zone
5. Take Profit: Previous red zone above
6. Risk:Reward = 1:2 minimum
```
---
## ⚠️ Important Trading Rules
### ✅ DO:
- Wait for BOTH SFP and X marker confirmation
- Enter on price returning to the zone (not on first touch)
- Use proper position sizing (1-2% risk per trade)
- Combine with market structure analysis
- Look for confluences (orderblocks, fair value gaps)
### ❌ DON'T:
- Trade against the higher timeframe trend
- Enter without confirmation signals
- Ignore the colored zones for SL/TP placement
- Overtrade - wait for quality setups
- Move stop loss to breakeven too early
---
## 🔧 Indicator Settings (Typical)
**Adjustable Parameters:**
- Swing Length: Number of bars to identify swing points
- Show/Hide X markers
- Show/Hide SFP labels
- Zone opacity and colors
- Line thickness
---
## 📚 ICT Concepts Explained
### **Liquidity Sweep:**
Smart money intentionally pushes price beyond key levels to trigger retail stop losses, then reverses to their intended direction. The X marker identifies these moments.
### **Swing Failure Pattern (SFP):**
Price attempts to make a new high/low but lacks follow-through, indicating weak momentum and likely reversal. Similar to a "false breakout" but more specific to swing structures.
### **Supply & Demand Zones:**
- **Red zones** = Areas where selling pressure overwhelmed buyers
- **Green zones** = Areas where buying pressure overwhelmed sellers
- These zones act as magnets for price to return and react
---
## 🎓 Best Practices
1. **Confluence is Key:**
- Combine with daily/weekly bias
- Check for orderblocks nearby
- Look for imbalances (FVG)
2. **Session Timing:**
- Best during London/New York sessions
- Avoid low liquidity periods
3. **Risk Management:**
- Never risk more than 1-2% per trade
- Use proper lot sizing
- Take partial profits at key levels
4. **Timeframe Correlation:**
- Check higher timeframe for bias
- Enter on lower timeframe for precision
- Exit based on higher timeframe targets
---
## 📞 Support & Updates
**Version:** 1.0
**Compatibility:** TradingView Pine Script v5
**Updates:** Regular improvements based on ICT methodology
---
## ⚡ Quick Reference Card
| Signal | Action | SL Placement | TP Target |
|--------|--------|--------------|-----------|
| SFP + X at High | SHORT at Red Zone | Above Red | Green Zone |
| SFP + X at Low | LONG at Green Zone | Below Green | Red Zone |
**Remember:** The indicator shows you WHERE to trade, but YOU decide WHEN based on confirmation and market context.
---
*Disclaimer: This indicator is a tool for technical analysis. Always use proper risk management and never trade with money you cannot afford to lose.*

Pre-Market + Daily + Weekly REGULAR HOURS 📦 Pre-Market + Daily + Weekly RTH Range Boxes
This indicator automatically plots Pre-Market, Daily, and Weekly range boxes based strictly on US Regular Trading Hours (RTH).
What it does:
Pre-Market Box (04:00–09:30)
Captures the full pre-market high and low, then projects the range forward from the RTH open.
Daily RTH Box (09:30–16:00)
Tracks the previous day’s regular session high and low and plots the range starting at 04:00 AM the next day.
Weekly RTH Box (Mon–Fri, 09:30–16:00)
Accumulates the full weekly RTH range and plots it at 04:00 AM on Monday.

Inside Bar Detector
Inside Bar & Internal Structure
A precise tool for identifying Inside Bars and tracking price range breakouts with internal market structure visualization.
🎯 What It Does
This indicator detects Inside Bars (consolidation patterns) and classifies how price breaks out of established ranges. It helps traders identify:
• Consolidation zones where price is coiling
• Directional breakouts (up or down)
• Liquidity sweeps where price tests both sides before committing to a direction
📊 Key Features
Inside Bar Detection - Automatically identifies when current bar's range is contained within the previous range
Range Visualization - Draws dashed rectangle boxes around Inside Bar sequences
Breakout Classification - Categorizes breaks as: Break High, Break Low, or Expansion
Sweep Detection - Labels bars that sweep both sides of the range before closing directionally
Internal Structure Lines - Connects swing highs and lows to visualize market structure
Statistics Panel - Real-time count of Inside Bars and breakout types
🔧 How It Works
1. Price Range Tracking : The indicator maintains a dynamic price range (high/low) that updates on each breakout
2. Inside Bar Logic : A bar is classified as Inside Bar when its high ≤ range high AND low ≥ range low
3. Breakout Detection :
• Break High : Price closes above the range (bullish)
• Break Low : Price closes below the range (bearish)
• Sweep : Price tests both sides but closes directionally (labeled as Sweep↑ or Sweep↓)
• Expansion : Price breaks both sides but closes in the middle (neutral)
⚙️ Settings
Display Settings
- Show Inside Bar Box: Toggle rectangle visualization
- Show Statistics: Display count panel
- Show Sweep Labels: Mark liquidity sweep events
Internal Structure Settings
- Show Internal Structure Lines: Connect swing points
- Line Color & Width: Customize appearance
Color Settings
- Inside Bar Box Color & Transparency
📈 How To Use
• Trend Continuation : Look for Inside Bars forming after a strong move, then trade the breakout in the trend direction
• Reversal Setups : Watch for sweep patterns (Sweep↑/Sweep↓) at key levels - these often indicate liquidity grabs before reversals
• Structure Analysis : Use internal structure lines to identify the current market bias
⚠️ Alerts
The indicator includes 4 alert conditions:
• Inside Bar Detected
• Break High (includes bullish sweeps)
• Break Low (includes bearish sweeps)
• Dual Expansion (neutral)
📋 Notes
• Works on all timeframes and instruments
• Consecutive Inside Bars are merged into a single box for cleaner visualization
• Internal structure lines ignore Inside Bars to reduce noise

MTF Fair Value GapsMTF Fair Value Gaps (MTF FVGs) plots Fair Value Gaps from up to 4 user-selectable higher timeframes directly on your chart.
Multi-timeframe support: Enable/disable each timeframe independently (e.g., 15m / 1h / 4h / 1D).
Clean chart mode: Show only the N closest bullish + bearish gaps per timeframe (reduces clutter).
Mitigation options: Choose how/when gaps are considered filled and automatically removed.
CE (0.5) midpoint line: Optional display with customizable style and width.
Per-timeframe colors: One color per timeframe (bull/bear share the same color).
Right-edge extension: Shift the right edge by X chart candles to keep gaps visible ahead of price.

SilverHawk Trend Flow Part of SilverHawk Suite
This script is designed to be used with the SilverHawk Suite workflow (context → trigger → confirmation → execution).
It works standalone, but the highest accuracy comes from using the full suite together.
Where it fits:
• Role: Context
What it does:
Colors candles based on detected trend regime, so you trade with the prevailing direction and avoid fighting structure.
How to use:
• Bullish color: prefer long triggers only
• Bearish color: prefer short triggers only
• No clear trend / transition: stand down and wait for the suite trigger + confirmation
Visual Tip: (important)
If candles look “hidden”: Settings → Visual Order → Bring To Front
Alerts:
New Up Trend / New Down Trend alerts trigger on confirmed candles (non-repainting style).
Suite note:
For full workflow and loadouts, start with: “SilverHawk Suite — Start Here (Workflow Guide)” (free)
Credits / License
Based on PhantomFlow Trend Detector (MPL-2.0). This script remains MPL-2.0.
