Price Range TableThe table shows the ranking of the price as a percentage relative to the past candles. 100 ~ highest price of the time frame 0 ~ lowest price of the time frame Pine Script® Indikatorvon miraalgo179
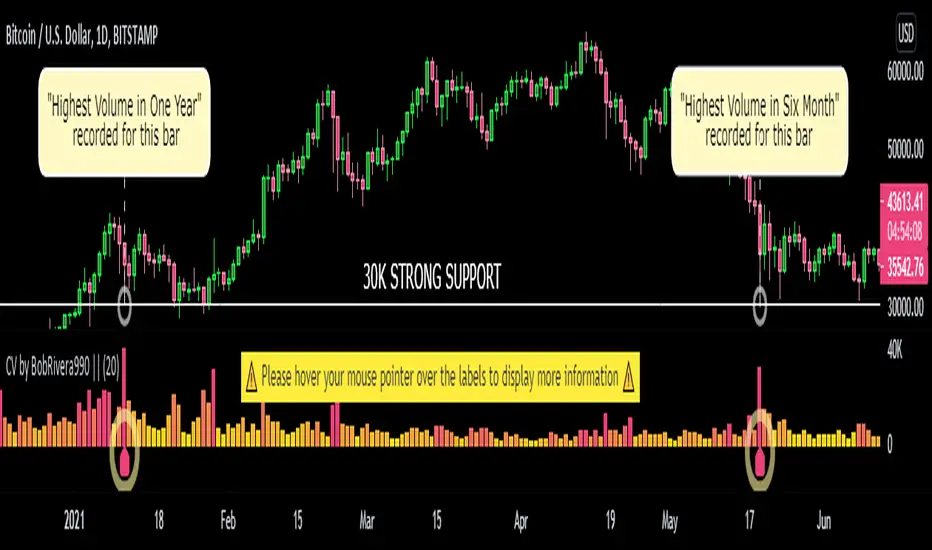
Custom Volume - Periodic Peaks & Troughs + AlertThis script is a custom volume indicator with additional features. But why is this useful? The minimum and maximum volumes, in different time periods, are displayed by labels below the bars. I call them "Peaks" and "Troughs". Hover your mouse cursor over the labels to see more details. These parameters are widely used in technical analysis. If traders want to confirm a reversal on a level of support–or floor–they look for high buying volume. Conversely, if traders are looking to confirm a break in the level of support, they look for low volume from buyers. If traders want to confirm a reversal on a level of resistance–or ceiling– they look for high selling volume. Conversely, if traders are looking to confirm a break in the level of resistance, they look for high volume from buyers. For example, take a look at the chart. Settings menu parameters {Dialog Box} => Parameter to show / hide the dialog box. {Visual Parameters} => Parameters to personalize the appearance of the indicator. { Alert Conditions Part 01: Peaks ⏰ "} => Parameters to customize the alert. { Alert Conditions Part 02: Troughs ⏰ "} => Parameters to customize the alert. {Volume MA} => Moving average settings How to use alerts Note that by creating an alert, an instance of the indicator, with all your settings, will be activated on the site's server and alerts will be triggered by it. After that, changing the indicator settings on the chart will no longer affect the alert. Open the settings window and select the alert conditions as you wish Click the Create Alert button (or press the A key while holding down the ALT key) In the Condition section, select the name of the indicator. Make the rest of the settings as you wish. Finally, click on the Create button. It's finished. After a few moments, your alert will be added to the Alerts menu. Limits The labels are displayed after the bars close. Labels are displayed for the last 10,000 bars. References: InvestopediaPine Script® Indikatorvon BobRivera990Aktualisiert 3232 2.3 K
Boom HunterEvery "boom" begins with a pullback... This indicator will help traders find bottoms and perfect entries into a pump. It combines two indicators, Dr. John Ehlers Early Onset Trend (EOT) and the infamous Stochastic RSI. The indicator features a built in dump and dip detector which usually picks up signals a few candles before it happens. The blue wave (EOT) shows trend, when waves travel up so does the price. Likewise for the opposite. Low points are revealed when EOT bottoms out and flat lines. Traders can then use the Stochastic RSI crossover to enter a trade. As the EOT lines get closer together there is more movement in price action, so as they get wider traders can expect sideways action. This indicator works on all timeframes but has had excellent results on hourly chart. Entry zones are marked with a green dot at top of indicator. This signals a bottom is being formed and traders should look for an entry. Exit points are marked with a red dot at top of indicator. This signals a peak and great time to exit. Dips and dumps are indicated in red at bottom of indicator. Pine Script® Indikatorvon veryfidAktualisiert 6363 2.9 K
StochasticLSMAIntroducing the worlds first StochasticLSMA. A powerful Stochastic that shows trends and highlights market tops/bottoms. This may be the ultimate tool in locating tops and bottoms on any timeframe. How to tune the settings: Depending on what chart you use and what timeframe you are on it may be necessary to dial in the settings to correctly locate the tops and bottoms you wish to trade. Here are some settings to try: 32 < Finds longer term Tops and bottoms. 21 < Great for longer term tops and bottoms on hourly and daily charts. 19 < If 21 is not accurate enough. 17 < If 19 is not accurate enough. 13 <Great setting for short to mid range tops and bottoms and lower timeframes. (default) 11 9 6 < Excellent for finding shorter term tops and bottoms on all timeframes. *Changing the “Stochastic Price” setting to “hl3” or “low” can help hone in on lows and highs.* It can be very useful to to use 2 StochasticLSMA indicators with different settings. Here we have two examples how to use multiple indicators on the ETHUSD Daily chart. One set on 13 and the other on 6. A trader can enter on the 6 length indicator and exit on the 13. It also shows how it has the potential to filter out “bad entries” by matching the bottoms. Example of different length settings. Alerts: Overbought: K line crosses over overbought line (Red Dot) Oversold: K line crosses under oversold line (Green Dot) Buy Signal: K line is under oversold line and trends up (Green Up Arrow) Sell Signal: K line is over oversold line and trends down (Red Down Arrow) Last Chance Sell Signal: As K line leaves overbought line (Yellow Dot) Last Chance Buy Signal: As K line leaves oversold line (Yellow Dot) Example of alert signals and trigger enabled in settingsPine Script® Indikatorvon veryfid11283
Chameleon indictor ║Tops and bottoms- This indicator uses a modified type of ADX, that offers a cleaner layout and improved signals. The indicator can be used by traders to identify possible tops, bottoms and changes in trends - If the purple line moves downward after having been inside of the red line signals that a security possibly can have reached the bottom - If the purple line moves upward after having been inside of the green line signals that a security possibly can reached the top - The middle acts as a confirmation of the signal // I have drawn lines on the chart to give examples of what the signals look likePine Script® Indikatorvon sylte2247
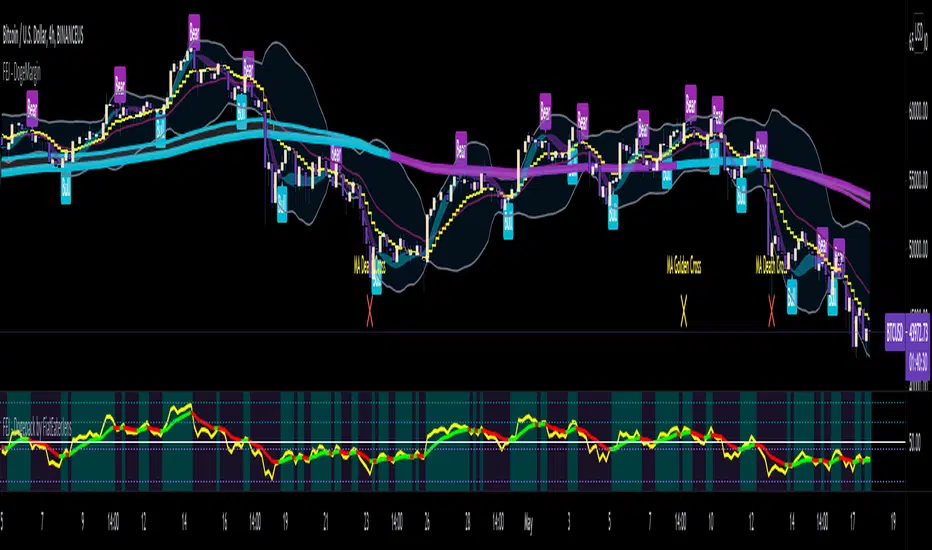
FAJ Dogepack Combines EMA + RSI indicator Dieses Script ist eine einfache Kombination aus RSI und EMA. Es erlaubt euch zu erkennen in welche Richtung der Trend in dem aktuellen TimeFrame geht und wie stark dieser aktuell ist. Außerdem zeigt es euch ob gerade eher die Bullen oder die Bären den Markt dominieren. Mit Hilfe des Indikators lassen sich Top und Bottom des aktuellen Time Frames erkennen. Ich Empfehle nur eine Nutzung bei BTC um Wellen besser zu erkennen. Erinnert euch daran, das ist nur eine Beta und gibt immer noch viele Fehlsignale aus, also testet es für euch selber in verschiedenen TimeFrames. This script is a simple combination of RSI and EMA. It allows you to see in which direction the trend is going in the current time frame and how strong it is currently. It also shows you whether the bulls or the bears are dominating the market. With the help of the indicator, the top and bottom of the current time frame can be recognized. recommended only use in BTC to better detect waves. remember that it is in beta and still sends many false signals so you have to test it well in several time periods.Pine Script® Indikatorvon FiatEaterJensAktualisiert 88548
Bitcoin Bullrun ATHFind Bitcoin's next ATH before bearmarket. This indicator, which successfully indicated the 3 previous tops, has been modified and improved. Its precision is the most accurate on the 2h timeframe. 3 features: - A visual percentage gauge will show the next potential high of the current bull run when it reaches 100% - Possibility to add an alert when the gauge reaches 100%. To do this, go to the tradingview alert menu and instead of the ticker, choose "Bitcoin Bullrun ATH" (Don't forget to set the timeframe on 2h or less.) - Possibility to choose if you want to see or not the tips/gauge/percentage only. Welcome and have a good bull run.Pine Script® Indikatorvon Silver-Wong3367
Pi Cycle Top IndicatorIndicator Overview The Pi Cycle Top Indicator has historically been effective in picking out the timing of market cycle highs to within 3 days. It uses the 111 day moving average (111DMA) and a newly created multiple of the 350 day moving average, the 350DMA x 2. Note: The multiple is of the price values of the 350DMA not the number of days. For the past three market cycles, when the 111DMA moves up and crosses the 350DMA x 2 we see that it coincides with the price of Bitcoin peaking. It is also interesting to note that 350 / 111 is 3.153, which is very close to Pi = 3.142. In fact, it is the closest we can get to Pi when dividing 350 by another whole number. It once again demonstrates the cyclical nature of Bitcoin price action over long time frames. Though in this instance it does so with a high degree of accuracy over the past 7 years. How It Can Be Used Pi Cycle Top is useful to indicate when the market is very overheated. So overheated that the shorter term moving average, which is the 111 day moving average, has reached a x2 multiple of the 350 day moving average. Historically it has proved advantageous to sell Bitcoin at this time in Bitcoin's price cycles. Created By Philip SwiftPine Script® Indikatorvon FreeFly7871414 1.5 K
Sharktank - Pi Cycle PredictionThe Pi Cycle indicator has called tops in Bitcoin quite accurately. Assuming history repeats itself, knowledge about when it might happen again could benefit you. The indicator is fairly simple: - A daily moving average of 350 ("long_ma" in script) - A daily moving average of 111 ("short_ma" in script) The value of the long moving average is multiplied by two. This way the longer moving average appears above the shorter one. When the shorter one (orange colored) crosses above the longer (green colored) one, it could mean the top is in. These moving averages rise at a certain rate. Using these rates we could try to estimate a possible crossover moment. That's exactly what this indicator does! It gives the user a prediction of when a crossover might happen. Special thanks to: - Ninorigo, for making his indicator public. This one uses his as a starting point. - The_Caretaker, for coming up with this idea about calling a top. Yet, his is more price-based, this one is more time-based.Pine Script® Indikatorvon BluntpilootAktualisiert 2525 1.4 K
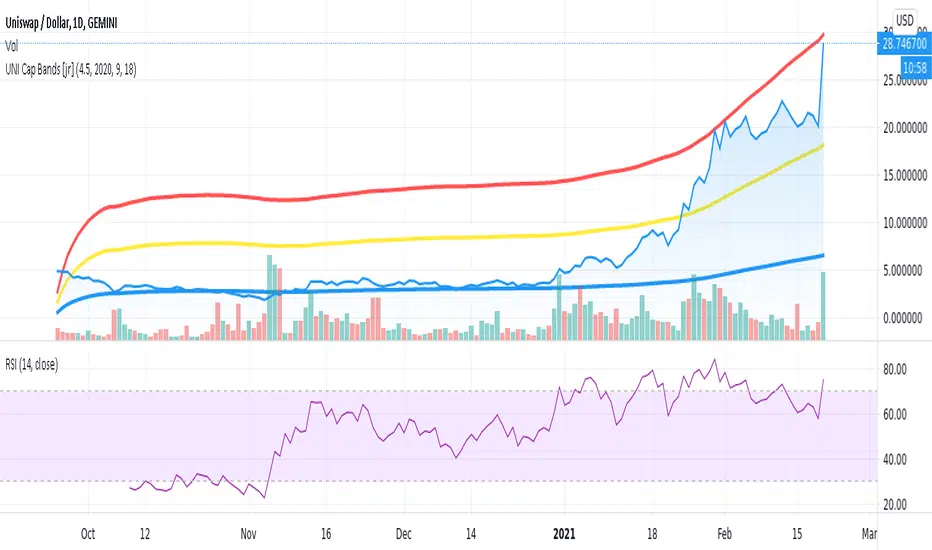
UNI Top Cap [jcray]Top cap indicator for UNI, the Uniswap Protocol token. Modified from BTC Top Cap by aamonkeyPine Script® Indikatorvon jcrayAktualisiert 105
Comparison (Malaysia Index & Sector)This is just a simple tool for convenient to compare and showing a clear image of all sector and index in Malaysia. They are just in one indicator. From this indicator, you can predict momentum of each sector in Malaysia, which is currently in bull or bear trend. STRUCTURE In the setting, the first line with the option of the following index (Malaysia Index) : 1. FBMKLCI 2. FTSEMYX:FBMSCAP 3. FTSEMYX:FBMACE 4. FTSEMYX:FBM70 5. FTSEMYX:FBMT100 6. FTSEMYX:FBMFLG 7. FTSEMYX:FBMEMAS 8. FTSEMYX:FA40 9. FTSEMYX:FBMMSCS 10. FTSEMYX:FBMAPMYR 11. FTSEMYX:FBMMSCAP The rest of lines is all of the following sector (Malaysia Sector): 1. Technology 2. Telecommunication 3. Health 4. Consumer Product 5. Industrial Product 6. Construction 7. Property 8. Plantation 9. Utilities 10. Transportation 11. Energy 12. REIT 13. Finance The last line (Line 15) is provided for other stock/index which is not available in option to manually fill. All sector and index price are smoothen by Moving Average (MA). The default moving average is Relative Moving Average (RMA) which is used in Relative Strength Index ( RSI ) Oscillator. But the range is different from RSI , it is from -100 to 100 instead of 0 to 100. In the end, result and interpretation are just the same as RSI . Green area indicates oversold area, while red area is overbought. Other choice of Moving Averages are available to change. The problem of putting all together is the script may take longer to process. It is just for convenient use. Bottom-Up or Top-Down Invest?Pine Script® Indikatorvon sxw6329Aktualisiert 22167
Top and BottomThe function of this indicator is to make regions that form top and bottom patterns visible. Especially beginners, do not know the real formation of a top or bottom. Some taking information only for maximum and minimum. ● The main characteristic of forming a top is to have the current maximum (1) less than the previous maximum (2) and the previous maximum (2) greater than the maximum previous to yours (3). ● The main characteristic of forming a fund is to have the current minimum (1) greater than the previous minimum (2) and the previous minimum (2) less than the minimum prior to yours (3). These are the main characteristics for forming a top and bottom. When you know where the top or bottom is, it will help you with the use of Fibonacci and also with breakouts. Alert: To have the graphic design of the indicator you need to have 3 candles. If the previous maximum is broken, you can remove the drawing. The same goes for the bottom. It can form a new top or bottom.Pine Script® Indikatorvon trader_fg22200
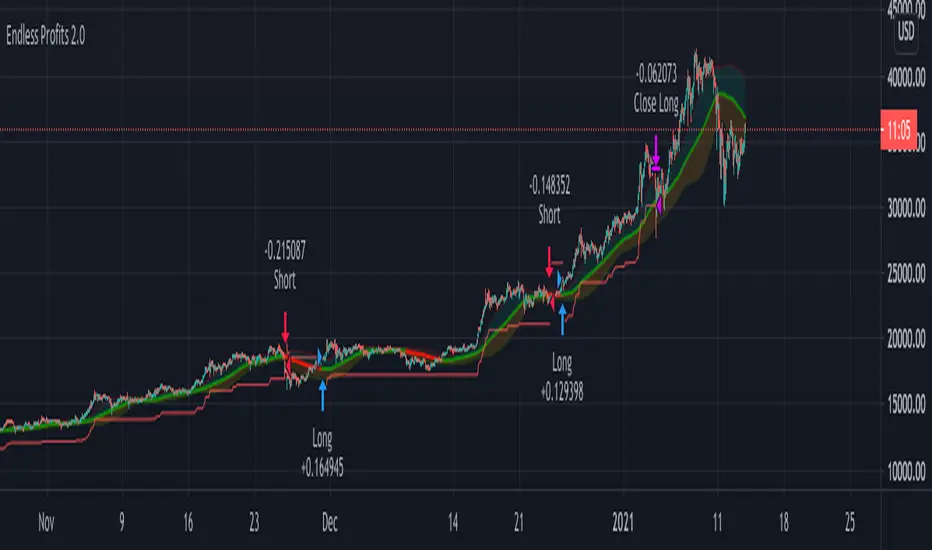
Profits Unlimited Pro Strategy** This is the backtesting (strategy) version of ~ Profits Unlimited Pro ~ proprietary script in TradingView. ** ~ Profits Unlimited Pro Strategy ~ ֎ Trading system script on tradingview that brings an easy approach to trading with a high profitability rate ֎ Our proprietary formula was developed over the course of the past two years through a combination of trial and error and algorithmic backtesting. -- HOW IT WORKS -- ֎ The algorithm starts with a proprietary script combining custom inputs with a formula that works with custom bollinger bands settings and specific RSI levels to results in deadly accurate signals for long and short entry points. but that's not all... ֎ When we first developed our formula, we noticed that it produced a lot of accurate signals but also didn't fully understand the dynamics of market momentum and trending directions... ...so there were a lot of needless calls being made that were reducing profitability. You see, most markets spend roughly 80% of the time trading sideways with no significant trend either up or down... ...And trading these sideways markets commonly result in what's called a "whipsaw"... A whipsaw is when price is moving in one direction but then quickly pivots to move in the opposite direction resulting in a loss. And nobody wants to be stuck trading in a sideways market getting killed by whipsaws all day... So what did we do to fix this?... -- THE WINNING FORMULA -- ֎ We added the Average Directional Index into our custom formula with a goal of teaching the algorithm to only trade during periods of strong momentum and trends whether up or down. ֎ We also added trend exhaustion levels to give clear indication for exit signals and help determine best times of getting out of a trade. ֎ Trend Exhaustion Levels work in conjunction with trailing stop loss % and both are customizable for ideal exits and profitability. ֎ The results are mind blowing! -- WHO IT'S FOR -- ֎ Optimized for crypto markets, to catch trend movements as soon as possible and maximize profitability ֎ It's A Swing Traders Dream. -- What You Get -- ֎ Sell & Buy alerts, Stop Loss alerts and always adding new features! ֎ Customizable settings. ֎ Chrome Extension in development for fine-tuning settings automatically(COMING SOON) -You will be able to select an asset. push a button. and the extension will find the best settings for you! ֎ Users Facebook community for learning, sharing and direct support If you’d like to test the trading script in TradingView, I can give you access to a 10 days trial. Please send me PM in tradingview and I’ll activate it right away. Thank you!Pine Script® Strategievon ProfitMeistroAktualisiert 9970
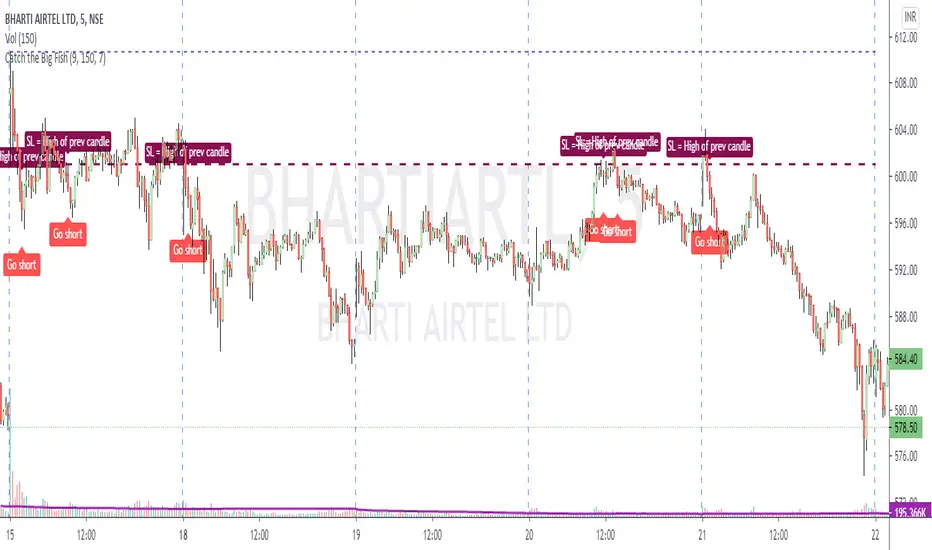
Catch the Big FishVolume based script to catch a big move. Works best on 5 min timeframe. The default sma duration for volume is set to 150 = number of candles in 5 mins timeframe for 2 days. Heavy volume is defined as = more than 9 times of sma. Both parameters are configurable. Trading strategy: Long buy at high / Short sell at low of the candle where the script gives the signal. Important note regarding SL - for Long / Short positions respectively, the SL should be placed at low / high of previous candle, and NOT of the same candle.Pine Script® Strategievon SushilKothawadeAktualisiert 1414 1.5 K
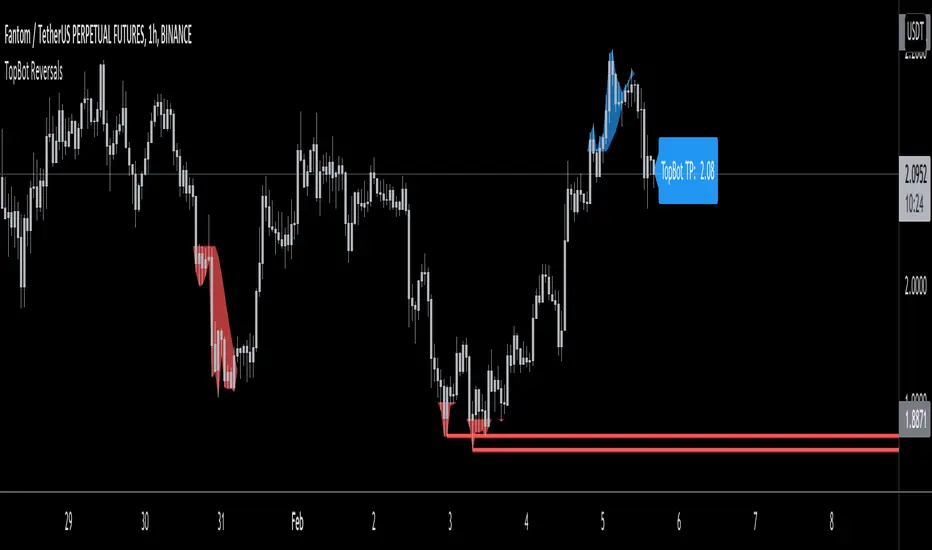
TopBot ReversalsThe TopBot Reversal indicator utilizes exhaustion and historical price levels to draw a possible recent top and bottom level. Using these lines together with other directional indicators such as Stochastic or RSI, we can draw a conclusion to a possible reversal at these levels. Use the link below to obtain access to this indicator.Pine Script® Indikatorvon TheTimeCountAktualisiert 3348
Ethereum: Price Action Integral BandsThis indicator tries to display absolute tops and bottoms for Ethereum. The price action gets integrated with three custom functions resulting in the blue top, green mid and red bottom price action integrals. From those integral values we allow 5% deviation in up and down direction, leading to price action integral bands of some non-zero width. Even during the liquidity crisis in March 2020 with abnormal price movements, Ethereum had no daily or weekly candle close below the support band. For longer-term trades it might be a good idea to buy ETH when price is around the red band, and temporarily sell/go short when ETH is around the blue band, although this is no financial advice and one should always cross-check with other indicators/informations. The green mid price action integral band indicates bullish/bearish zones. When price is located above the green band, the market is in a bullish environment, if price lies below it, the market is in a bearish environment. There's the option to plot or hide the bands individually. These integral bands are specifically designed for the Ethereum (ETHUSD) Kraken ticker on daily (D) or weekly (W) timeframe (the indicator automatically adjusts for both those timeframes). For other assets, tickers and timeframes the functionality of this indicator cannot be guaranteed and will most probably not deliver meaningful results. If you want to use the integral bands for Bitcoin, please see my other indicator titled 'Bitcoin: Price Action Integral Bands'. For access please contact me via DM on TradingView or on Twitter (linked in my TradingView profile and my signature).Pine Script® Indikatorvon Dean_TraderAktualisiert 106
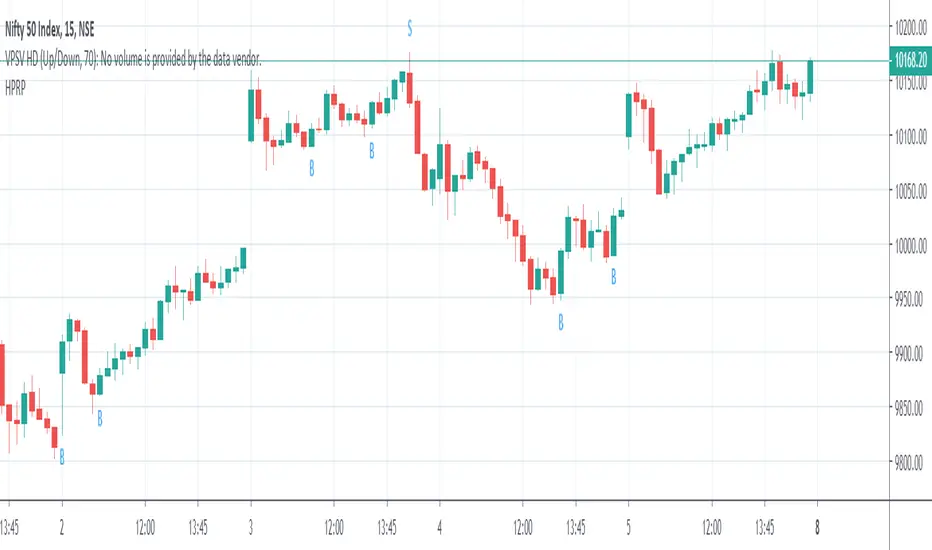
TOP BOTTOM SIGNALThis script identifies short term top and bottom in all time frames. Symbol "S" means a temporary top has been formed and Symbol "B" means a temporary bottom has been formed.Pine Script® Indikatorvon somenism22272
Fluffykat's Double Top indicator with alert v1This is a free double top indicator with an alert that has many settings to customize your double top. From Wikipedia "The double top is a frequent price formation at the end of a bull market. It appears as two consecutive peaks of approximately the same price on a price-versus-time chart of a market. The two peaks are separated by a minimum in price, a valley. The price level of this minimum is called the neck line of the formation. The formation is completed and confirmed when the price falls below the neck line, indicating that further price decline is imminent or highly likely." The following can be customized: The left and right bar strengths for both the Right Top (RT) and Left Top (LT). For an explanation on RT/LT bar strength see (pivothigh) tradingview pine script API notes. The price variance in % between RT / LT The minimum and maximum allowable separation between RT/LT Ability to toggle visibility of prices Best regards.Pine Script® Indikatorvon fluffykatAktualisiert 1414324
Bitcoin: Top & Bottom Mini-AlgoHere we have a mini-algorithm that tries to show absolute 4-year-cycle top and bottom zones for the case of the BraveNewCoin Liquid Index (BLX) for Bitcoin on the weekly (W) timeframe by using several oscillators as RSI, VPCI etc. employed with a custom logic. When the background gets red we might be near to a cycle peak, and when it gets green we might be near to the absolute bottom of the current cycle. Note that only absolute top/bottoms are indicated (at least since the end of 2013), so that the current strong drop in March 2020 was correctly not tagged, as it wasn't the lowest price of the current cycle. It is best to combine this mini-algorithm with some of my boundary indicators for BLX, e.g. "Bitcoin: Price Action Integrals", for confluence . For the next peak one could then watch for the mini-algo to go red and for the price to hit the boundary. You can change the background transparency if you like to have this indicator be more unobstrusive on the chart. For access please contact me via DM on TradingView or on Twitter (linked on my TradingView profile and my signature).Pine Script® Indikatorvon Dean_Trader6661
Cyatophilum Double Top & Bottom [ALERTSETUP]Private Indicator Version Alpha The indicator is subject to changes. This indicator's goal is to help automatically find double top and double bottom patterns. Its core algorithm uses purely price action and does not use any kind of overbought/oversold oscilator. To be validated, a double top/bottom must be preceded by a simple top/bottom. Parallel Channels To be validated, a double top/bottom must be inside the top/bottom parallel channel. Channels will expire after some time. A channel's range is automatically calculated when changing timeframe or symbol. Channels can be used to trade breakouts after a double top/bottom happened. Alerts This indicator allows to create automated alerts in order to receive signals for an event. The available alerts are: Double Bottom Double Top Simple Bottom Simple Top Send me a message if you would like to help me test the indicator.Pine Script® Indikatorvon cyatophilumAktualisiert 88147
Highs & Lows of Last [x] Bars=========== Highs & Lows of Last Bars =========== We have found this indicator invaluable over the past few years - whether you prefer to trade Crypto, Forex, Commodities or something else this indicator could prove really useful. It's always nice to know the highs and lows of the last Week or Month, the problem being the information is only really relevant at the start or end of that chosen time period; throughout the mid-section of that time period the chart will either be displaying irrelevant information or info that has been/is being re-painted. Not good! Our Highs & Lows of Last Bars Indicator will remove this re-painting problem and display up-to-date information from higher time frames without compromising the integrity of your current chart period. ----------- Most high & low finder indicators will use, (for example), a 'W' or 'M' as their higher TF to get HTF results - we do things just a little bit differently, it's like this: Most other High/Low Indicators: ~ MON 1st (get high/low value from 'W' TF) ~ ~ MON 8th (get new data and plot from 'W' TF) etc. - This leads to gaps in the data, re-painting and missing lots of potential mid-week trades. Our High & Low of Last Bars: ~ MON 1st (get high/low value from LAST 7 DAYS) ~ ~ TUE 2nd (get high/low value from LAST 7 DAYS) ~ etc. This provides a much smoother High/Low plot with more relevant information. You can clearly see areas of support and resistance, updated on the LTF chart using data from a HTF. Because we've included 2 TF's you can use simultaneously you can see when the lower TF touches the Higher TF this (generally, but not always!) means there's a breakout coming! Hope this is useful to you guys! Good Luck and Happy Trading!Pine Script® Indikatorvon theCrypster22143
Bitcoin: Price Action Integral BandsThis indicator tries to display absolute tops and bottoms for Bitcoin. The price action gets integrated with two custom functions resulting in the blue top and red bottom price action integrals. From those integral values we allow 5% deviation in up and down direction, leading to price action integral bands of some non-zero width. Even in the current liquidity crisis with abnormal price movements, Bitcoin had no weekly candle close below the support band. One thing to note is that in the here presented model, up until now only one single weekly candle touches the blue band in each of Bitcoin's cycles. For longer-term trades it might be a good idea to buy BTC when price is around the red band, and sell/go short when BTC is around the blue band, although this is no financial advice and one should always cross-check with other indicators/informations. There's the option to plot or hide the bands individually. The integral bands are specifically designed for the Bitcoin BLX (BraveNewCoin Liquid Index) ticker on weekly timeframe. For other assets, tickers and timeframes the functionality of this indicator cannot be guaranteed and will most probably not deliver meaningful results.Pine Script® Indikatorvon Dean_TraderAktualisiert 88101
RSI Call-outs [BigBitsIO]This is a simple RSI indicator that overlays the current chart to show labels for specified oversold and overbought areas defined with inputs. It will delete any labels of the same kind within the last 3 candles so you don't see as many labels as you would otherwise. Red labels with white text represent overbought RSI levels as defined by the user. Green labels with black test represent oversold RSI levels as defined by the user. This RSI overlay help easily call-out overbought and oversold candles on a chart without sacrificing screen space for a traditional RSI indicator that is not overlayed on the chart.Pine Script® Indikatorvon BigBitsIOAktualisiert 99 1.1 K