Market Structure Master [Takeda Trades 2026]Market Structure Master
by @TakedaTradesOfficial
v1 01/26/2026
════════════════════════════════════════════════════════
DESCRIPTION:
5 MODES. COMPLETE MARKET STRUCTURE.
═════════════════════════════════════════════════════════
MODES
═════════════════════════════════════════════════════════
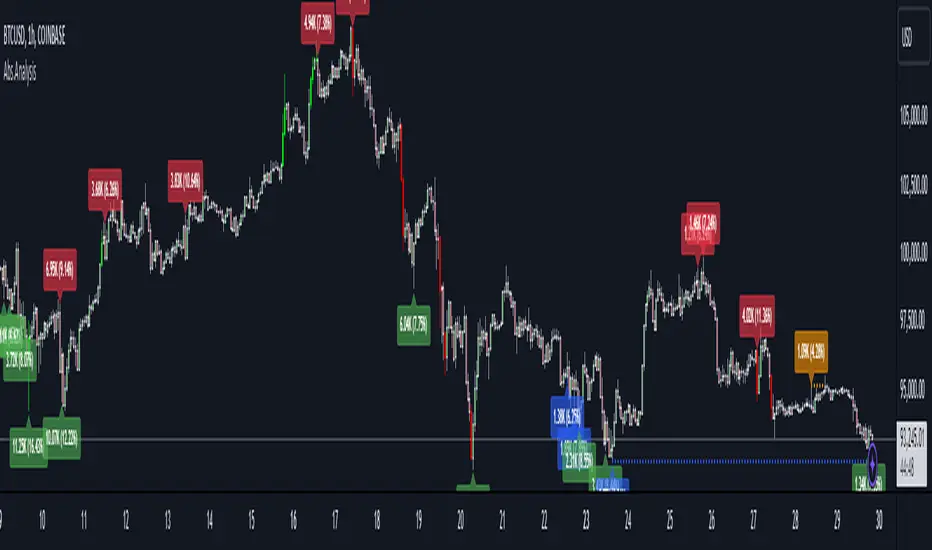
1. LONG - BUY at lows, TARGET at highs + Auto SL/TP
2. SHORT - SELL at highs, TARGET at lows + Auto SL/TP
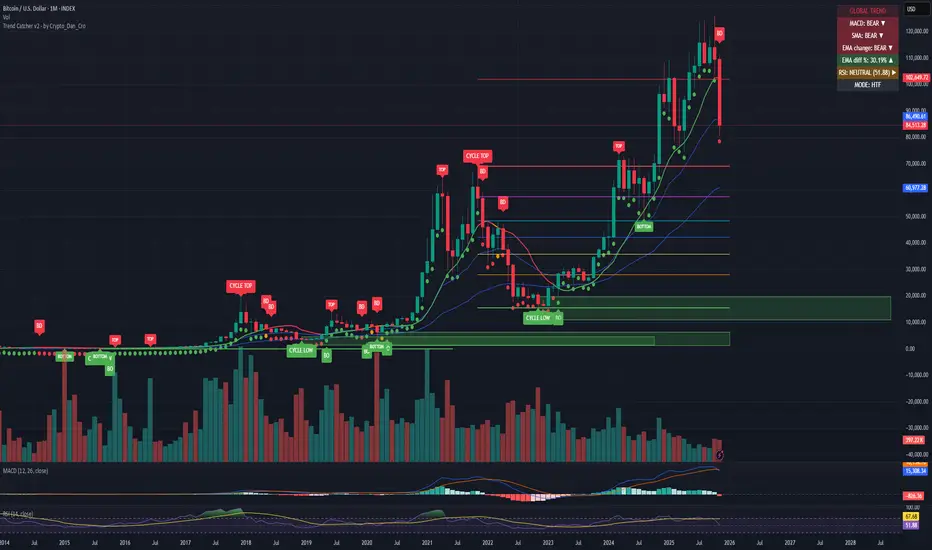
3. HH LL - Labels Higher Highs and Lower Lows
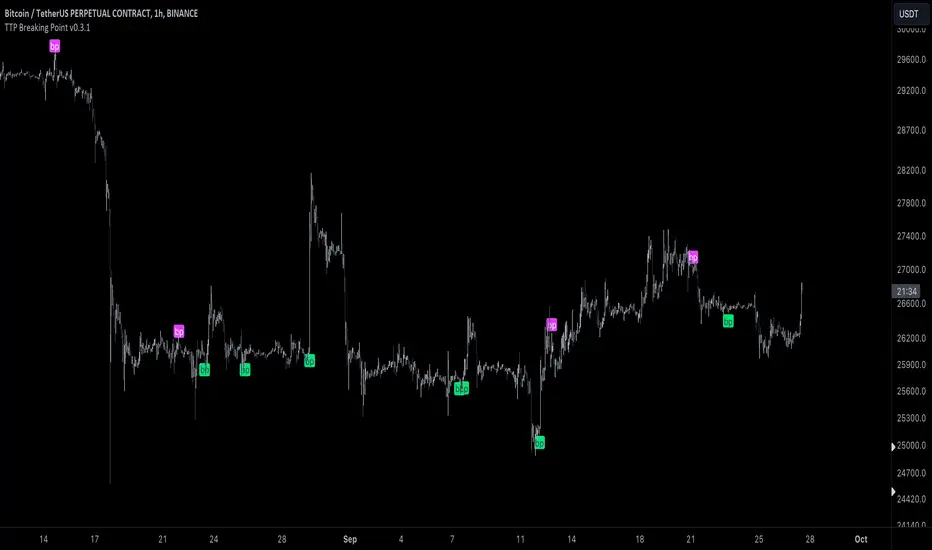
4. NUMBERED - Sequential (#1, #2, #3...)
5. COLORED - Gradient (Bright→Dark)
Multi-timeframe • Auto SL/TP • Bar colors • Full customization
═════════════════════════════════════════════════════════
HOW TO TRADE
═════════════════════════════════════════════════════════
📈 LONG | 📉 SHORT
1. Label appears (BUY at low / SELL at high)
2. Price breaks line
3. Bar colors (green/red)
4. Auto SL + TP appear
5. Exit at TP/TARGET
Entry: Line break + Color | Stop: SL line | Target: TP/TARGET
🔢 NUMBERED
Conservative: #1 only | Moderate: 70% #1, 30% #2 | Aggressive: 50-30-20
Warning: #1-2 Safe | #3-4 Reduce | #5+ Exit
🎨 COLORED
Bright → ENTER | Medium → HOLD | Dark → EXIT
⚡ HH LL
Uptrend: HH series | Downtrend: LL series | Reversal: First opposite
═════════════════════════════════════════════════════════
STRATEGIES
═════════════════════════════════════════════════════════
Multi-Timeframe: Higher TF pivots on lower TF (1m+5m, 15m+1H, 4H+Daily)
Confluence: 2 instances, different TFs. Enter when both signal.
Pyramiding: #1: Full | #2: 50% | #3: 25% | #4+: No entry
Momentum: Trade bright colors only. Exit medium, avoid dark.
═════════════════════════════════════════════════════════
SETTINGS
═════════════════════════════════════════════════════════
Scalp: 3/3, LONG/SHORT | Day: 5/5, NUMBERED/COLORED | Swing: 10/10, HH LL
Lower bars = More signals | Higher bars = Quality
═════════════════════════════════════════════════════════
QUICK START
═════════════════════════════════════════════════════════
1. Select mode
2. Choose timeframe
3. Set bars (5/5 default)
4. Enable SL/TP
5. Wait for label + line break
6. Enter on color change
═════════════════════════════════════════════════════════
TIPS
═════════════════════════════════════════════════════════
✓ Wait for line break | ✓ Use SL | ✓ Scale with NUMBERED | ✓ Bright colors only | ✓ Higher TF = Quality
═════════════════════════════════════════════════════════
⚠️ DISCLAIMER
═════════════════════════════════════════════════════════
Educational only. Use risk management. Past results don't guarantee future.
© 2026 Takeda Trades
Pine Script® Indikator