TradeX Guru: Kinetic RSI ProtocolThe Kinetic RSI Protocol is a physics-based system designed to separate market Trend (Mass) from Short-term Tension (Elasticity). Most traders get trapped in fakeouts because they trade every oversold signal. This protocol filters those signals by waiting for a "Kinetic Release" (Breakout) before confirming an entry.
THE PHYSICS BEHIND THE CODE
This script combines two distinct forces:
The Anchor (Mass): Uses a 14-period RSI to determine the "Weight" of the market. Bullish above 40, Bearish below 60.
The Rubber Band (Tension): Uses a 2-period RSI to measure extreme stretches (RSI < 10 or > 90).
HOW IT WORKS (TRAFFIC LIGHT LOGIC)
This indicator uses a "State Machine" logic to filter fakeouts:
1. The Setup (Pending): When the "Rubber Band" is stretched and snaps back, the script internally marks the setup. You will see a "SNAP" label.
Action: WAIT. This is just potential energy.
2. The Trigger (Confirmation): The script watches the High or Low of the setup candle.
LONG: If price breaks the High of the setup candle, the bar paints ORANGE.
SHORT: If price breaks the Low of the setup candle, the bar paints PURPLE.
Action: This is your entry signal.
3. The Invalidation (Safety): If the price breaks the wrong way (e.g., support breaks before the trigger), the setup is silently cancelled. No signal is painted.
KEY FEATURES
Visual Clarity: Normal candles for setups, Colored candles (Orange/Purple) only for confirmed entries.
Auto-Targets: Automatically plots 3 Kinetic Targets based on ATR Volatility (Release, Extension, Velocity).
Institutional Dashboard: A clean terminal tracking Anchor Status, Tension, and Session P&L.
Smart Sizing: Auto-detects NIFTY/BANKNIFTY for Indian traders to calculate P&L in Rupees.
DISCLAIMER
This tool is designed for educational analysis of market momentum. It does not provide financial advice. Always use proper risk management.
Strength

Real Deviation Strength (RDS) [ALPHA]Real Deviation Strength (RDS) – The mirror-image twin to Median Anchor Oscillator.
Same battle-tested foundation: rolling median + Median Absolute Deviation (MAD) scaling = a super-robust deviation measure that laughs at outliers (way tougher than classic mean/std-dev oscillators).
The fun part: we flipped the visuals so deviation becomes “strength.”
- Histogram inverted + fresh palette: magenta (#aa3bf5) bars shooting up for positive deviation strength (big stretch = caution or conviction?), cyan (#00f7ff) dropping down for negative (pullback energy = bounce setup?).
- Adjustable Strength Sweet Spots at ±2.5 (tweak to taste).
- Optional yellow fill zones for that high-octane “something’s cooking” vibe.
- Scales beautifully on wild charts—crypto, stocks, whatever throws spikes.
Where Median Anchor says “Whoa, too far—revert!”, RDS goes “Damn, that stretch has legs—respect the power.” Perfect for momentum hunters, contrarian plays, or just geeking out on the opposite lens.
Still very much ALPHA—early days, room to grow. Feel free to leave feedback in the comments:
- Colors popping right?
- Alerts on sweet-spot exits next?
- Add divergence next?
- What’s it crushing (or failing) on your favorite ticker?
Using this side-by-side with MAO? The magenta/cyan combo keeps them visually distinct—no chart confusion.
Hero version here: Median Anchor Oscillator →
Open-source. Let’s build this thing together. Cheers to the flipside 🍻

RSI [Hash Capital Research]RSI is a visually enhanced momentum indicator built on the classic Relative Strength Index.
This version expands RSI into a more flexible analytical tool through smoothing options, adaptive zone-based coloring, optional signal line overlays, and divergence detection.
It is designed as a context-building indicator, not a standalone entry system.
What This Indicator Does
This script calculates a smoothed RSI using user-defined parameters and then provides multiple optional enhancements:
1. Adaptive RSI Visualization
The core RSI is plotted with:
Zone-based color changes (neutral, oversold, overbought)
Optional glow effects to emphasize extreme conditions
User-defined color intensity and midline visibility
The goal is to provide clearer visual segmentation of trend strength and momentum behavior.
2. Custom Smoothing & Signal Line Options
The indicator allows:
Multi-layer smoothing for RSI stability
An optional signal line using the trader’s preferred moving-average method (SMA, EMA, SMMA/RMA, WMA, VWMA)
This helps operators examine whether momentum is accelerating or stabilizing relative to its mean.
3. Overbought/Oversold Tools
User-defined thresholds determine:
Highlighted zones
Optional markers for extreme reversals (based on RSI + momentum + velocity criteria)
Midline (50) cross highlights for trend-bias transitions
These features help contextualize where the RSI sits relative to broader momentum regimes.
4. Divergence Detection (Optional)
When enabled, the script scans for regular bullish and bearish divergences using pivot-based structure.
It compares:
Price making lower lows vs RSI making higher lows (bullish)
Price making higher highs vs RSI making lower highs (bearish)
Detected divergences are plotted on the RSI panel with visual labels.
This detection uses pivot lookbacks and range limits defined by the user.
5. Alerts
The indicator provides optional alerts for:
Extreme reversals
Overbought/oversold momentum shifts
Midline (50) crossovers
Bullish / bearish divergences
Alerts are intended for monitoring, not for automated execution.
How to Use It
This RSI modification is intended to support broader analysis workflows, including:
Identifying regime shifts using midline crosses
Monitoring momentum structure across trend phases
Highlighting oversold or overbought clustering
Adding a visual signal line to interpret momentum smoothing
Spotting divergence between price and RSI
As with all indicators, this tool should be used as one component of a complete analysis framework.
What Makes This Version Distinct
This script maintains the core behavior of RSI but introduces:
A multi-layer smoothing system
Adaptive colors calibrated to oversold/neutral/overbought zones
Optional glow visualizations
A modular signal-line engine with multiple MA types
Configurable divergence detection with visual labels
Multiple marker placement modes for extreme conditions
These features expand RSI’s readability while keeping its underlying logic transparent and consistent with common operator workflows.
Important Notes
This is an indicator, not a strategy. It does not execute trades or calculate performance metrics.
The visual enhancements are designed to improve clarity, not to generate automated “buy” or “sell” systems.
Divergence detection is optional because divergence is inherently contextual and may not apply equally across all markets or timeframes.

RS Score (1-100) vs NQ/ES/YM - TP# RS Score (1–100) vs NQ/ES/YM — How to Use & Interpret
## What this indicator is doing
It gives you a **single score from 1 to 100** that tells you whether a stock is acting like a **leader** or a **laggard** compared to the **overall U.S. market** (Nasdaq + S&P + Dow), using about **1 year of data**.
---
## The core idea: “Is this stock beating the market?”
This script compares your stock to a blended benchmark of:
* **Nasdaq futures (NQ)**
* **S&P futures (ES)**
* **Dow futures (YM)**
### Why that matters
A stock can be going up, but if the market is going up faster, the stock is **not a leader**.
This tool answers:
* “Is this stock outperforming the big market?”
* “Is it doing it consistently, or is it just wild and noisy?”
---
## What the 1–100 score means
Think of **50** as the “middle line.”
### The most important rule
* **Above 50 = outperforming the market blend**
* **Below 50 = underperforming**
* **Around 50 = roughly market-like**
### Easy interpretation bands
* **80–100 (Strong Leader):** stock is outperforming the market clearly and consistently
* **60–80 (Healthy):** generally outperforming, decent leadership
* **45–60 (Neutral-ish):** not special, close to market performance
* **30–45 (Weak):** lagging the market
* **1–30 (Very Weak):** strong underperformance
**Think “leaders live above 50,” and “real leaders tend to stay 70+.”**
---
## Why this score is “smarter” than just comparing returns
This script doesn’t just ask *“did it outperform?”*
It also asks *“did it outperform in a clean, steady way?”*
So it penalizes:
* choppy, unstable performance
* “one lucky spike” moves
That’s why it’s great for finding **higher-quality leadership**.
---
## Timeframe consistency: why it works on Daily, Weekly, Monthly
You added **Lock to last completed Daily bar**.
That means:
* it uses the **same daily reference point** no matter what chart timeframe you switch to
* your RS score won’t “walk around” just because the current day/week/month is still forming
**Practical meaning:**
If your score says 72, it should be 72 whether you’re looking at Daily, Weekly, or Monthly (as of the last completed day).
---
## The “RS New High” marker (NH) — what it’s telling you
The marker shows when your RS score hits a **new high** over your chosen lookback period (default ~252 trading days).
### In plain terms:
> “This stock is now showing its strongest relative performance vs the market (in about a year).”
### Why it’s powerful
A lot of the best leaders:
* show RS new highs **before** price breaks out
* or show RS new highs **during** breakouts
**So NH is a “leadership confirmation” signal.**
### How to use NH in real life
* **Best case:** RS hits a new high **while price is near breakout levels**
→ this often means institutions are accumulating and the stock is acting like a leader
* **Okay case:** price makes new highs but RS does not
→ stock is rising, but it’s not leading (could still work, but less attractive)
---
## Divergences: when RS and price disagree
This is one of the most useful ways to use RS.
### Bearish divergence (warning)
**Price makes a higher high, but RS makes a lower high.**
In simple terms:
> “The stock is still going up, but it’s losing leadership versus the market.”
This often shows up before:
* pullbacks
* breakout failures
* trend weakening
* rotation into stronger names
**It’s a caution sign, not an automatic sell.**
### Bullish divergence (early strength)
**Price makes a lower low, but RS makes a higher low.**
In simple terms:
> “The stock is holding up better than the market — strength is building underneath.”
This can happen before:
* reversals
* strong bounce setups
* early leadership emergence
---
## How to use this indicator in a simple trading workflow
### 1) Screening (finding leaders)
When scanning charts:
* Prefer stocks **above 50**
* Strong candidates are typically **70+**
* Bonus points if you see **NH markers** recently
**Quick rule:**
If RS < 50, it’s usually not worth your time unless you’re hunting deep value turnarounds.
---
### 2) Breakouts (confirming quality)
When a stock is near a breakout point:
* You want RS to be **rising**
* Ideally RS is near highs or prints **NH**
If price breaks out but RS is weak:
* it’s more likely to be a “meh breakout”
* sometimes it works, but it’s less “leader-like”
---
### 3) Managing positions (leadership health check)
If you’re already holding:
* RS staying high and rising = healthy leadership
* RS rolling over while price still rises = **possible early warning**
* RS plunging under 50 = the stock is now **lagging the market** (big red flag)
---
## Common “mistakes” and how to avoid them
### Mistake 1: Thinking RS > 50 means “guaranteed winner”
No — it means it’s acting **stronger than the market**, but price action still matters.
Use it with:
* trend structure
* volume/accumulation
* breakout levels
### Mistake 2: Overreacting to one divergence
One divergence is a warning.
You want confirmation like:
* failed breakout
* heavy sell volume
* loss of key moving averages
* repeated RS lower highs
### Mistake 3: Comparing RS values across totally different markets without context
RS works best when:
* comparing stocks within the same broad market environment
* keeping the same benchmark blend and same lookback
---
## Simple cheat sheet
* **RS > 50:** outperforming market (good)
* **RS 70–100:** leader zone
* **NH marker:** strongest relative strength in lookback window (leadership confirmation)
* **Price HH + RS LH:** bearish divergence (leadership weakening)
* **Price LL + RS HL:** bullish divergence (strength building)
Thank you!

Ultimate Major Contextual Dashboard (Multi-Asset)Overview : The Ultimate Major Dashboard is a performance-optimized market overview tool designed to provide a consolidated snapshot of the 7 major Forex pairs and Gold. It aggregates correlation, trend, momentum, and volatility data into a single, clean table, allowing users to view broader market context without switching charts.
Technical Logic & Components : This indicator utilizes a modular function to analyze EURUSD, GBPUSD, USDJPY, USDCHF, AUDUSD, USDCAD, NZDUSD, and XAUUSD across four key dimensions:
Intermarket Correlation (Pearson Coefficient): Uses ta.correlation() to compare each asset against the symbol currently on your main chart.
Logic: Values above 0.7 (Dark Green) suggest a strong positive relationship, while values below -0.7 (Dark Red) suggest inverse behavior. This is calculated over a rolling 50-period window to balance stability with current market sensitivity.
Trend Bias (EMA-200): Evaluates the long-term trend by checking price position relative to the 200-period Exponential Moving Average.
Visuals: An upward arrow (⬆) indicates price is above the EMA; a downward arrow (⬇) indicates it is below.
Momentum (RSI-14): Calculates the Relative Strength Index. The dashboard automatically highlights readings above 70 (OB) or below 30 (OS) to help identify potential momentum extremes.
Volatility (ATR-14): Displays the Average True Range as a reference for the current active range of each market, helping users compare volatility levels across the majors.
How to Interpret the Dashboard
Asset Alignment: Correlation values help identify when pairs are moving in "unison" versus when a specific currency is diverging from the group.
Directional Context: Combining the Trend (EMA) and Momentum (RSI) columns provides a quick view of whether a market is trending strongly or reaching an exhaustion point.
Volatility Benchmarking: The ATR values offer perspective on which pairs are currently the most active, assisting in market comparison based on volatility preference.
Data Handling & Customization
Multi-Symbol Sync: Data is fetched using request.security(). The calculations are synchronized with the chart's current bar state for real-time accuracy.
Dynamic TF: Users can select the analysis timeframe (60, 240, D, W) via the settings menu.
Flexibility: The dashboard position can be toggled between all four corners of the chart to avoid overlapping with price action.
Disclaimer
This tool is provided for analytical and educational purposes only. It does not generate trading signals and should not be considered financial advice.

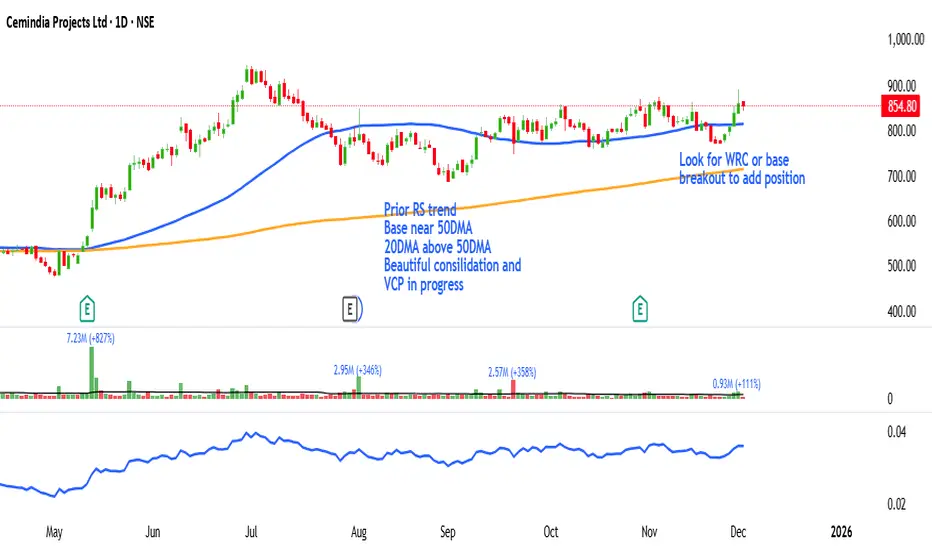
Minervini Ultimate +VCPMinervini Ultimate Suite (SEPA Dashboard)
This indicator implements Mark Minervini's "Trend Template" criteria combined with a Volatility Contraction Pattern (VCP) detector and a custom Relative Strength rating. It is designed to help traders visualize the technical health of a stock based on stage analysis concepts.
This indicator serves as a complete Control System (Dashboard) for Mark Minervini's SEPA trading strategy. Instead of manually checking five different metrics on every chart, this indicator performs the mathematical calculations and presents the "bottom line" in a single, organized table.
1. What This Indicator Does
The goal is to ensure you never enter a trade blindly. It verifies the stock against Minervini's strict requirements:
Trend: Is the stock in a healthy Stage 2 Uptrend?
Relative Strength: Is it stronger than the general market?
Buy Risk: Is it the right time to buy, or is the price extended?
Pressure: Are institutions accumulating or distributing?
VCP: Is there a breakout opportunity (volatility contraction) right now?
2. Key Benefits
Time-Saving: Instead of drawing lines and calculating percentages manually, you get immediate visual feedback (Green/Red).
Discipline: The indicator will flag "Extended" (Red) if you attempt to buy a stock that has run up too much, saving you from late entries and unnecessary losses.
Precision Timing: The VCP feature (Blue Dots) helps you identify the "calm before the storm"—the exact moment volatility contracts, which often precedes a major breakout.
3. Indicator Parameters & Features
A. Minervini Pressure (Buying vs. Selling)
What it checks: Money flow over the last 20 days.
Calculation: Sums up volume on "Up Days" (Green) versus volume on "Down Days" (Red).
Meaning:
🟢 Buying: More money is entering than leaving. A sign of institutional accumulation.
🔴 Selling: Selling pressure dominates. The price may be rising, but without strong volume backing.
B. Buy Risk (Price Extension)
What it checks: The distance of the current price from the 50-Day Moving Average. Minervini strictly warns against "chasing" stocks.
Signals:
🟢 Low Risk: Price is within 0% – 15% of the 50MA. This is the ideal "Buy Zone".
🟡 Caution: Price is 15% – 25% away. Buy with increased caution.
🔴 Extended: Price is >25% from the MA. Do not buy. The probability of a pullback is high.
⚪ Broken: Price is below the 50MA. The short-term trend is damaged.
C. TPR - Trend Template (Trend Power Rating)
What it checks: Is the stock in a Stage 2 Uptrend?
Strict Rules (All must be true for a PASS):
Price > 50MA > 150MA > 200MA.
The 200MA is trending UP (positive slope).
Price is near the 52-Week High (within 25%).
Price is above the 52-Week Low (at least 25%).
Meaning:
🟢 PASSED: Technically healthy and ready to move.
🔴 FAILED: The trend structure is broken (e.g., MAs are entangled).
D. RPR Score (Relative Performance Rating)
What it checks: How strong the stock is compared to the general market (S&P 500 / SPY).
Calculation: Weighted performance over 3, 6, 9, and 12 months vs. the SPY. The score ranges from 1 to 99.
Meaning:
🟢 80-99: Market Leader. These are the stocks Minervini targets.
🟡 70-80: Good, but not elite.
⚪ Below 70: Laggard (weaker than the market).
E. VCP Action (Volatility Contraction Pattern)
What it checks: Monitors price tightness. It calculates the range between the highest close and lowest close over the last 5 days.
Meaning:
🔵 SQUEEZE (Blue Text + Blue Dot on Chart): The price range has contracted to less than 2.5%.
Why it matters: When a stock stops moving wildly and trades in a tight range ("Flat Line"), it indicates supply has dried up. A high-volume breakout often follows immediately.

Adaptive Trend Mapper-ATM [Arjo]Adaptive Trend Mapper (ATM) is a directional pressure indicator designed to visualize how buying and selling commitment evolves during market trends.
Instead of focusing on price direction alone, ATM maps who is exerting stronger pressure —buyers or sellers—and how that pressure expands, weakens, or compresses over time.
Idea
ATM is built around a single concept:
Directional pressure is best understood by weighting trend strength against directional imbalance .
To achieve this, the indicator transforms trend strength into two opposing pressure measures:
Bull Pressure Index
Bear Pressure Index
These indices expand, contract, and converge based on how strongly buyers or sellers are committing, rather than simply tracking momentum or price changes.
How It Works
1. Bull & Bear Pressure Indices
ATM derives two pressure curves by weighting trend strength against directional imbalance:
The Bull Pressure Index increases when upward pressure strengthens.
The Bear Pressure Index increases when downward pressure strengthens.
Both indices operate on a 0–100 scale and are designed to diverge during strong trends and converge during non-directional or compressed phases.
Optional smoothing can be applied to reduce noise and improve readability.
2. Compression / Squeeze Detection
When:
Trend strength weakens,
Bull and Bear pressure converge,
And convergence continues over time,
ATM highlights a compression zone, signaling reduced directional conviction.
These zones often precede directional expansion once pressure rebuilds.
3. Adaptive Trend Context
An adaptive smoothed price curve is displayed on the chart to provide trend context.
Color changes reflect short-term directional shifts, helping align pressure signals with price structure.
This component is contextual only and does not generate signals by itself.
4. Optional Trend Bias Reference
An optional EMA-50 can be enabled to help identify broader directional bias and align pressure behavior with the prevailing trend.
5. Step-Based Visualization
The pressure indices can be optionally step-compressed, improving clarity on fast or noisy charts by reducing minor fluctuations.
How to Use ATM
Rising Bull Pressure → strengthening buyer commitment
Rising Bear Pressure → strengthening seller commitment
Wide separation between indices → strong directional trend
Convergence with compression highlight → range or pre-breakout environment
Notes
ATM uses widely known market concepts such as trend strength, directional imbalance, and adaptive smoothing as conceptual inputs.
All calculations, pressure mapping logic, and compression detection are original implementations developed specifically for this script.
ATM is effective when used to assess participation quality, not as a standalone signal generator.
Disclaimer
This indicator is intended for analysis and educational purposes only.
It does not generate buy or sell signals.
Always apply proper risk management.
Happy Trading.

Mini RSI+STOCH-RSI+RSI-DIVERGENCE @Marx_CapitalMini version of RSI + STOCHASTIC-RSI with RSI-Divergence detection - all in one, adjustable small table overlayed on your chart. The table box gives RSI and Stoch-RSI values and signals detected RSI divergences.
Uncheck 'Update only on bar close' in indicator settings if the box does not appear right away.

RSI + STOCH RSI - Marx_CapitalSimple RSI + STOCH RSI indicator in one pane. In addition to the standard 30/70 and 20/80 RSI levels you have three adjustable levels (eg. 0, 50, 100) to indicate STOCH RSI overbought/oversold scenarios.

Kinetic RSI [Vel + Accel] + AlertsThe Problem with Standard RSI
Most traders use the Relative Strength Index (RSI) to see if a market is "Overbought" (above 70) or "Oversold" (below 30). The problem? A strong trend can stay overbought for days, burning short sellers, or an asset can stay oversold while price continues to crash. Standard RSI tells you where the price is, but it doesn't tell you how hard it is moving.
The Solution: Kinetic RSI
This script reimagines RSI by applying basic physics concepts: Velocity and Acceleration.
Instead of asking "Is RSI below 30?", this indicator asks: "Is RSI below 35 AND did it just make a violent, high-speed turn upwards?"
It filters out lazy, drifting price action and only signals when momentum is accelerating in a new direction.
How It Works (The Math)
Velocity: We calculate the speed of the RSI change (Current RSI - Previous RSI).
Acceleration: We calculate if that speed is increasing (Current Velocity - Previous Velocity).
The Trigger: A signal is only generated if the RSI is in an extreme zone (<35 or >65) AND it has high Velocity AND positive Acceleration.
How to Trade It
1. The "Kick" Signals (Background Highlights)
🟢 Green Background (Bullish Kick): The RSI was low, but buyers stepped in aggressively. The momentum is not just positive; it is accelerating upward. This is often a "V-Bottom" catch.
🔴 Red Background (Bearish Kick): The RSI was high, but sellers slammed the price down. Momentum is accelerating downward.
2. The Line Color
Lime Line: Velocity is positive (Momentum is rising).
Fuchsia Line: Velocity is negative (Momentum is falling).
Usage: If the background flashes Green (Buy Signal), but the line turns back to Fuchsia (Red) a few bars later, the move has failed—exit the trade.
Settings & Alerts
RSI Length: Standard 14 (Adjustable).
Velocity Threshold: Controls sensitivity.
Lower (e.g., 2-3): More signals, catches smaller reversals.
Higher (e.g., 5+): Fewer signals, catches only massive "shocks" to the price.
Alerts Included: You can set alerts for "Bullish Kick," "Bearish Kick," or "Any Kick" to get notified of volatility spikes.
Best Practices
Wait for the Close: This indicator measures the closing velocity. Always wait for the bar to close to confirm the background color signal.
Trend Filtering: This works best as a "Reversal" indicator. If the market is in a super-strong uptrend, ignore the Bearish (Red) signals and only take the Bullish (Green) dips.

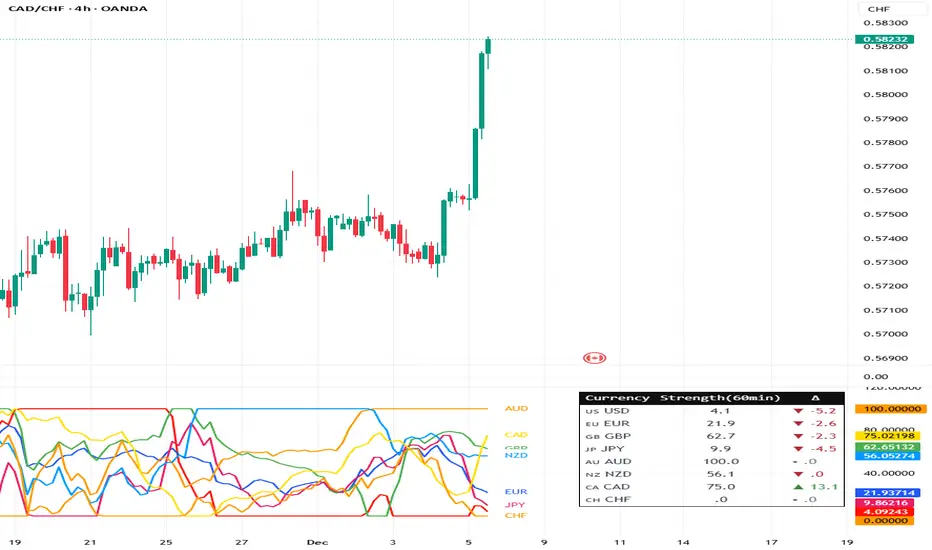
Currency Strength Meter (8 Majors) — invincible3
📊 Currency Strength Meter (8 Majors) — Description
The Currency Strength Meter (8 Majors) calculates the relative performance of the major global currencies — USD, EUR, GBP, JPY, AUD, NZD, CAD, CHF — using aggregated logarithmic returns across all major FX pairs. Strength values are normalized on every bar, allowing users to quickly identify the strongest and weakest currencies at any moment in time.
Each currency’s strength is computed from a basket of 7 related currency pairs, smoothed with EMA, converted into z-scores, and finally normalized to a 0–100 scale for easy comparison.
A built-in table displays the real-time strength for all currencies, along with bar-to-bar delta and directional arrows.
🔶 SETTINGS
General
Broker Prefix
Select the broker symbol prefix used for pair requests (e.g., OANDA:, FX_IDC:).
Calculation Timeframe
Timeframe used to calculate the log returns of currency pairs.
Higher timeframes reduce noise, lower timeframes increase sensitivity.
Lookback Bars
Number of bars (on the calculation timeframe) used to measure logarithmic performance.
Smoothing (EMA)
Smooths currency strength with an EMA of selectable length.
Plot Lines
Option to display the normalized strength of each currency (0–100) directly on the chart.
🔹 Strength Meter Table
Show Table
Enables the on-chart strength meter table.
Show ▲▼ Delta Arrows
Displays directional arrows indicating bar-over-bar momentum:
▲ increasing strength
▼ decreasing strength
• neutral
Size
Controls the table text size (Tiny → Huge).
Layout
Shows:
Currency name & flag
Strength (0–100)
Delta (current – previous bar)
🔶 USAGE
This indicator helps traders quickly determine which currencies are strong and which are weak , and how that strength evolves over time.
Because currencies are evaluated relative to one another , trend strength becomes easier to identify across FX pairs.
Use cases include:
Finding strong vs. weak currency pair combinations
Confirming trend continuation or exhaustion
Identifying momentum shifts through the delta column
Spotting early reversals when strength begins to diverge
Comparing currency performance over multiple timeframes
📈 Example Interpretation
If the USD shows:
Strength = 82
Delta = +3 (▲)
…USD is not only strong, but also getting stronger relative to the previous bar.
If AUD shows:
Strength = 22
Delta = -5 (▼)
…AUD is weak and weakening further.
This makes strong/weak pairing intuitive:
Prefer strong vs weak pairs (e.g., USD/AUD if USD strong & AUD weak)
Avoid neutral or mixed-strength pairs
🔶 DETAILS
Currency Strength Calculation
For each currency pair, the indicator calculates the log-return over the selected lookback window.
Each currency aggregates 7 major related pairs to form a composite strength value.
The aggregated value is smoothed using EMA.
All 8 currencies are converted into z-scores, then normalized to a 0–100 scale for cross-sectional comparison.
A bar-to-bar delta is computed to reveal strengthening or weakening momentum.
This structure ensures the indicator remains stable, consistent, and highly responsive for intraday and higher-timeframe trading.
Volumetric Inverse Fair Value Gap (IFVG) [Kodexius]The Volumetric Inverse Fair Value Gap (IFVG) indicator detects and visualizes inverse fair value gaps (IFVGs) zones where previous inefficiencies in price (fair value gaps) are later invalidated or “inverted.”
Unlike traditional FVG indicators, this tool integrates volume-based analysis to quantify the bullish, bearish, and overall strength of each inversion. It visually represents these metrics within a dynamically updating box on the chart, giving traders deeper insight into market reactions when liquidity imbalances are filled and reversed.
Features
Inverse fair value gap detection
The script identifies bullish and bearish fair value gaps, stores them as pending zones, and turns them into inverse fair value gaps when price trades back through the gap in the opposite direction. Each valid inversion becomes an active IFVG zone on the chart.
Sensitivity control with ATR filter and strict mode
A minimum gap size based on ATR is used to filter out small and noisy gaps. Strict mode can be enabled so that any wick contact between the relevant candles prevents the gap from being accepted as a fair value gap. This lets you decide how clean and selective the zones should be.
Show Last N Boxes control
The indicator can keep only the most recent N IFVG zones visible. Older zones are removed from the chart once the number of active objects exceeds the user setting. This prevents clutter on higher timeframes or long histories and keeps attention on the most relevant recent zones.
Ghost box for the original gap
When the ghost option is enabled, the script draws a faint box that marks the original fair value gap from which the inverse zone came. This makes it easy to see where the initial imbalance appeared and how price later inverted that area.
Volumetric bull, bear and strength metrics
For each IFVG, the script estimates how much of the bar volume is associated with buying and how much with selling, then computes bull percentage, bear percentage and a strength score that uses a percentile rank of volume. These values are stored with the IFVG object and drive the visualization inside the zone.
Three band visual layout inside each IFVG
Each active IFVG is drawn as a container with three horizontal sections. The top band represents the bull percentage, the middle band the bear percentage and the bottom band the strength metric. The width of each bar reflects its respective value so you can read the structure of the zone at a glance.
Customizable colors and label text
Colors for bull, bear, strength, the empty background area, the ghost box and label text can be adjusted in the inputs. This allows you to match the indicator to different chart themes or highlight specific aspects such as strength or direction.
Automatic invalidation and cleanup
When price clearly closes beyond the IFVG in a way that breaks the logic of that zone, the script marks it as inactive and deletes all boxes and labels linked to it. Only valid and active IFVGs remain on the chart, which keeps the display clean and focused.
Calculations
1. Detecting Fair Value Gaps (FVGs)
A fair value gap is identified when price action leaves an imbalance between candle wicks. Depending on the mode:
Bullish FVG: When low > high
Bearish FVG: When high < low
Optionally, the strict mode ensures wicks do not touch.
The gap’s significance is filtered using the ATR multiplier input to exclude minor noise.
Once detected, FVGs are stored as pending zones until inverted by opposite movement (price crossing through).
bool bull_cond = strict_mode ? (low > high ) : (close > high )
bool bear_cond = strict_mode ? (high < low ) : (close < low )
float gap_size = 0.0
if bull_cond and close > open
gap_size := low - high
if bear_cond and close < open
gap_size := low - high
2. Creating IFVGs (Inversions)
When price later moves through a previous FVG in the opposite direction, an Inverse FVG (IFVG) is created.
For example:
A previous bearish FVG becomes bullish IFVG if price moves upward through it.
A previous bullish FVG becomes bearish IFVG if price moves downward through it.
The IFVG is initialized with structural boundaries (top, bottom) and timestamp metadata to anchor visualization.
if not p.is_bull_gap and close > p.top
inverted := true
to_bull := true
if p.is_bull_gap and close < p.btm
inverted := true
to_bull := false
3. Volume Metrics (Bull, Bear, Strength)
Each IFVG calculates buy and sell volumes from the current bar’s price spread and total volume.
Bull % = proportion of upward (buy) volume
Bear % = proportion of downward (sell) volume
Strength % = normalized percentile rank of total volume
These are obtained through a custom function that estimates directional volume contribution:
calc_metrics(float o, float h, float l, float c, float v) =>
float rng = h - l
float buy_v = 0.0
if rng == 0
buy_v := v * 0.5
else
if c >= o
buy_v := v * ((math.abs(c - o) + (math.min(o, c) - l)) / rng)
else
buy_v := v * ((h - math.max(o, c)) / rng)
float sell_v = v - buy_v
float total = buy_v + sell_v
float p_bull = total > 0 ? buy_v / total : 0
float p_bear = total > 0 ? sell_v / total : 0
float p_str = ta.percentrank(v, 100) / 100.0

ST - Relative StrengthST - Relative Strength plots the relative strength of the current stock versus a benchmark index. It divides the stock’s close by the index close on the same timeframe, and you can switch the benchmark to any index or symbol you prefer. This helps you quickly see whether the stock is outperforming or underperforming its chosen benchmark over time.
NQUSB Sector Industry Stocks Strength
A Comprehensive Multi-Industry Performance Comparison Tool
The complete Pine Script code and supporting Python automation scripts are available on GitHub:
GitHub Repository: github.com
Original idea from by www.tradingview.com
━━━━━━━━━━━━━━━━━━━━━━━━━━━━━━━━━━━━━━━━
═══ WHAT'S NEW ═══
4-Level Hierarchical Navigation:
Primary: All 11 NQUSB sectors (NQUSB10, NQUSB15, NQUSB20, etc.)
Secondary (Default): Broad sectors like Technology, Energy
Tertiary: Industry groups within sectors
Quaternary: Individual stocks within industries (37 semiconductors)
Enhanced Stock Coverage:
1,176 total stocks across 129 industries
37 semiconductor stocks
Market-cap weighted selection: 60% tech / 35% others
Range: 1-37 stocks per industry
━━━━━━━━━━━━━━━━━━━━━━━━━━━━━━━━━━━━━━━━
═══ CORE FEATURES ═══
1. Drill-Down/Drill-Up Navigation
View NVDA at different granularity levels:
Quaternary: ● NVDA ranks #3 of 37 semiconductors
Tertiary: ✓ Semiconductors at 85% (strongest in tech hardware)
Secondary: ✓ Tech Hardware at 82% (stronger than software)
Primary: ✓ Technology at 78% (#1 sector overall)
Insight: One indicator, one stock, four perspectives - instantly see if strength is stock-specific, industry-specific, or sector-wide.
━━━━━━━━━━━━━━━━━━━━━━━━━━━━━━━━━━━━━━━━
2. Visual Current Stock Identification
Violet Markers - Instant Recognition:
● (dot) marker when current stock is in top N performers
✕ (cross) marker when current stock is below top N
Violet color (#9C27B0) on both symbol and value labels
Example: "NVDA ● ranks #3 of 37"
━━━━━━━━━━━━━━━━━━━━━━━━━━━━━━━━━━━━━━━━
3. Rank Display in Title
Dynamic title shows performance context:
"Semiconductors (RS Rating - 3 Months) | NVDA ranks #3 of 37"
#1 = Best performer, higher number = lower rank
Total adjusts if current stock auto-added
━━━━━━━━━━━━━━━━━━━━━━━━━━━━━━━━━━━━━━━━
4. Auto-Add Current Stock
Always Included:
Current stock automatically added if not in predefined list
Example: Viewing PRSO → "PRSO ranks #37 of 39 ✕"
Works for any stock - from NVDA to obscure small-caps
Violet markers ensure visibility even when ranked low
━━━━━━━━━━━━━━━━━━━━━━━━━━━━━━━━━━━━━━━━
═══ DUAL PERFORMANCE METRICS ═══
RS Rating (Relative Strength):
Normalized strength score 1-99
Compare stocks across different price ranges
Default benchmark: SPX
% Return:
Simple percentage price change
Direct performance comparison
11 Time Periods:
1 Week, 2 Weeks, 1 Month, 2 Months, 3 Months (Default) , 6 Months, 1 Year, YTD, MTD, QTD, Custom (1-500 days)
Result: 22 analytical combinations (2 metrics × 11 periods)
━━━━━━━━━━━━━━━━━━━━━━━━━━━━━━━━━━━━━━━━
═══ USE CASES ═══
Sector Rotation Analysis:
Is NVDA's strength semiconductors-specific or tech-wide?
Drill through all 4 levels to find answer
Identify which industry groups are leading/lagging
Finding Hidden Gems:
JPM ranks #3 of 13 in Major Banks
But Financials sector weak overall (68%)
= Relative strength play in weak sector
Cross-Industry Comparison:
129 industries covered
Market-wide scan capability
Find strongest performers across all sectors
━━━━━━━━━━━━━━━━━━━━━━━━━━━━━━━━━━━━━━━━
═══ TECHNICAL SPECIFICATIONS ═══
V32 Stats:
Total Industries: 129
Total Stocks: 1,176
File Size: 82,032 bytes (80.1 KB)
Request Limit: 39 max (Semiconductors), 10-16 typical
Granularity Levels: 4 (Primary → Quaternary)
Smart Stock Allocation:
Technology industries: 60% coverage
Other industries: 35% coverage
Market-cap weighted selection
Formula: MIN(39, MAX(5, CEILING(total × percentage)))
━━━━━━━━━━━━━━━━━━━━━━━━━━━━━━━━━━━━━━━━
═══ KEY ADVANTAGES ═══
vs. Single Industry Tools:
✓ 129 industries vs 1
✓ Market-wide perspective
✓ Hierarchical navigation
✓ Sector rotation detection
vs. Manual Comparison:
✓ No ETF research needed
✓ Instant visual markers
✓ Automatic ranking
✓ One-click drill-down
━━━━━━━━━━━━━━━━━━━━━━━━━━━━━━━━━━━━━━━━
For complete documentation, Python automation scripts, and CSV data files:
github.com
Version: V32
Last Updated: 2025-11-30
Pine Script Version: v5


stock-vs-industry using NQUSB benchmark idexesOriginal idea from Stock versus Industry by Tr33man .
━━━━━━━━━━━━━━━━━━━━━━━━━━━━━━━━━━━━━━━━
═══ PRIMARY IMPROVEMENT: NQUSB Hierarchical Index Benchmarks ═══
The KEY improvement: Multi-Level Industry Granularity with Drill-Down/Drill-Up Navigation
From: Simple ETF Comparison (1 Level) Stock → Industry ETF (e.g., "SOXX" for all semiconductors)
To: NQUSB Hierarchical Comparison (4 Levels)
Level 4 (Primary): NQUSB10102010 → Semiconductors (most specific)
Level 3 (Secondary): NQUSB101020 → Technology Hardware and Equipment
Level 2 (Tertiary): NQUSB101010 → Software and Computer Services
Level 1 (Quaternary): NQUSB10 → Technology (broadest sector)
Users can now drill up and down the industry hierarchy to see how their stock performs against different levels of industry classification!
━━━━━━━━━━━━━━━━━━━━━━━━━━━━━━━━━━━━━━━━
═══ WHY THIS MATTERS ═══
Original Limitations:
Single comparison level - ETF only
No drill-down capability - Can't zoom in to more specific industries
No drill-up capability - Can't zoom out to broader sectors
ETF limitations - Not all industries have dedicated ETFs
Arbitrary mappings - Manual ETF selection may not represent true industry
Improved Capabilities:
4-level hierarchical navigation - Drill-down and drill-up through industry classifications
361 NQUSB official indices - NASDAQ US Benchmark Index structure
Official NASDAQ classification - Industry-standard taxonomy
Large Mid Cap (LM) option - Focus on larger companies when needed
Enhanced UI - Clear level indicators and full index descriptions
━━━━━━━━━━━━━━━━━━━━━━━━━━━━━━━━━━━━━━━━
═══ EXAMPLE: ANALYZING NVDA (Semiconductors) ═══
Level 4 - Primary (Most Specific):
NQUSB10102010 - Semiconductors
→ NVDA vs. AMD, AVGO, QCOM, TXN, etc. (direct competitors)
Level 3 - Secondary (Broader):
NQUSB101020 - Tech Hardware & Equipment
→ NVDA vs. AAPL, CSCO + semiconductors
Level 2 - Tertiary (Even Broader):
NQUSB101010 - Software and Computer Services
→ NVDA vs. all tech hardware
Level 1 - Quaternary (Broadest):
NQUSB10 - Technology Sector
→ NVDA vs. entire technology sector
You can now zoom in to see direct competitors or zoom out to understand macro sector trends - all in one indicator!
━━━━━━━━━━━━━━━━━━━━━━━━━━━━━━━━━━━━━━━━
═══ COMPARISON SUMMARY ═══
Original Version:
Comparison System: Industry ETFs
Industry Levels: 1 (flat ETF mapping)
Total Classifications: ~140 industries
Hierarchy Navigation: ❌ No
Data Source: Manual ETF curation
Improved Version:
Comparison System: NQUSB Official Indices
Industry Levels: 4 (hierarchical drill-down/up)
Total Classifications: 361 NQUSB indices
Hierarchy Navigation: ✅ 4-level drill navigation
Data Source: NASDAQ official taxonomy
Large/Mid Cap Option: ✅ LM variant toggle
Level Indicator: ✅ to labels
━━━━━━━━━━━━━━━━━━━━━━━━━━━━━━━━━━━━━━━━
═══ ADDITIONAL FEATURES ═══
Dual Comparison System - Toggle between ETF mode (original) and Index Benchmark mode (NQUSB hierarchy)
Better Fallback Logic - Manual Override > NQUSB Index > ETF > SPY default
Enhanced Display - 4-row information table with full NQUSB index description
Backward Compatible - All original ETF mappings still work, existing charts won't break
Large Mid Cap Toggle - Optional "LM" suffix for focusing on larger companies only
━━━━━━━━━━━━━━━━━━━━━━━━━━━━━━━━━━━━━━━━
For complete documentation, data files, technical details, and the full NQUSB hierarchy structure, visit the GitHub repository.
The result: More accurate, more flexible, and more comprehensive industry strength analysis - enabling traders to understand exactly where their stock's performance comes from by drilling through multiple levels of industry classification.

Average Directional Index infoAverage Directional Index (ADX) is a technical indicator created by J. Welles Wilder that measures trend strength (not direction!). Values range from 0 to 100.
This indicator is a supplementary tool for assessing whether trend strategies are worthwhile, monitoring changes in trend strength and avoiding weak, choppy movements
Value Interpretation:
0-25: Weak trend or sideways market
25-50: Moderate to strong trend
50-75: Very strong trend
75-100: Extremely strong trend (rare)
Important: ADX does not indicate trend direction (up/down), only its strength!
This script indicator includes additional features:
1. ADX Plot (purple line)
Basic ADX value showing current trend strength.
2. ADX Trend Analysis (arrows)
The script compares current ADX with its 10-period moving average with ±5% tolerance:
↑ (green): ADX rising → trend strengthening
↓ (red): ADX falling → trend weakening
⮆ (gray): ADX stable → trend strength unchanged
3. Information Table
Displays current ADX value with trend arrow in the top-right corner.
Parameters to Configure
Smoothing (default: 14) - Indicator smoothing period
Lower values (e.g., 7): more sensitive, more signals
Higher values (e.g., 21): more stable, less noise
Indicator Length (default: 14) - Period for calculating directional movement (+DI/-DI)
Wilder's standard value is 14
Trend Length (default: 10) - Period for moving average to analyze ADX dynamics
Determines how quickly changes in trend strength are detected
Practical Application
✅ Strategy 1: Trend Strength Filter
1. ADX > 25 → look for positions aligned with the trend
2. ADX < 25 → avoid trend strategies, consider oscillators
✅ Strategy 2: Entries on Strengthening Trend
1. ADX crosses above 25 + arrow ↑ → trend gaining momentum
2. Combine with other indicators (e.g., EMA) for direction confirmation
✅ Strategy 3: Exhaustion Warning
1. ADX > 50 + arrow ↓ → strong trend may be exhausting
2. Consider profit protection or trailing stop

Relative Performance Areas [LuxAlgo]The Relative Performance Areas tool enables traders to analyze the relative performance of any asset against a user-selected benchmark directly on the chart, session by session.
The tool features three display modes for rescaled benchmark prices, as well as a statistics panel providing relevant information about overperforming and underperforming streaks.
🔶 USAGE
Usage is straightforward. Each session is highlighted with an area displaying the asset price range. By default, a green background is displayed when the asset outperforms the benchmark for the session. A red background is displayed if the asset underperforms the benchmark.
The benchmark is displayed as a green or red line. An extended price area is displayed when the benchmark exceeds the asset price and is set to SPX by default, but traders can choose any ticker from the settings panel.
Using benchmarks to compare performance is a common practice in trading and investing. Using indexes such as the S&P 500 (SPX) or the NASDAQ 100 (NDX) to measure our portfolio's performance provides a clear indication of whether our returns are above or below the broad market.
As the previous chart shows, if we have a long position in the NASDAQ 100 and buy an ETF like QQQ, we can clearly see how this position performs against BTSUSD and GOLD in each session.
Over the last 15 sessions, the NASDAQ 100 outperformed the BTSUSD in eight sessions and the GOLD in six sessions. Conversely, it underperformed the BTCUSD in seven sessions and the GOLD in nine sessions.
🔹 Display Mode
The display mode options in the Settings panel determine how benchmark performance is calculated. There are three display modes for the benchmark:
Net Returns: Uses the raw net returns of the benchmark from the start of the session.
Rescaled Returns: Uses the benchmark net returns multiplied by the ratio of the benchmark net returns standard deviation to the asset net returns standard deviation.
Standardized Returns: Uses the z-score of the benchmark returns multiplied by the standard deviation of the asset returns.
Comparing net returns between an asset and a benchmark provides traders with a broad view of relative performance and is straightforward.
When traders want a better comparison, they can use rescaled returns. This option scales the benchmark performance using the asset's volatility, providing a fairer comparison.
Standardized returns are the most sophisticated approach. They calculate the z-score of the benchmark returns to determine how many standard deviations they are from the mean. Then, they scale that number using the asset volatility, which is measured by the asset returns standard deviation.
As the chart above shows, different display modes produce different results. All of these methods are useful for making comparisons and accounting for different factors.
🔹 Dashboard
The statistics dashboard is a great addition that allows traders to gain a deep understanding of the relationship between assets and benchmarks.
First, we have raw data on overperforming and underperforming sessions. This shows how many sessions the asset performance at the end of the session was above or below the benchmark.
Next, we have the streaks statistics. We define a streak as two or more consecutive sessions where the asset overperformed or underperformed the benchmark.
Here, we have the number of winning and losing streaks (winning means overperforming and losing means underperforming), the median duration of each streak in sessions, the mode (the number of sessions that occurs most frequently), and the percentages of streaks with durations equal to or greater than three, four, five, and six sessions.
As the image shows, these statistics are useful for traders to better understand the relative behavior of different assets.
🔶 SETTINGS
Benchmark: Benchmark for comparison
Display Mode: Choose how to display the benchmark; Net Returns: Uses the raw net returns of the benchmark. Rescaled Returns: Uses the benchmark net returns multiplied by the ratio of the benchmark and asset standard deviations. Standardized Returns: Uses the benchmark z-score multiplied by the asset standard deviation.
🔹 Dashboard
Dashboard: Enable or disable the dashboard.
Position: Select the location of the dashboard.
Size: Select the dashboard size.
🔹 Style
Overperforming: Enable or disable displaying overperforming sessions and choose a color.
Underperforming: Enable or disable displaying underperforming sessions and choose a color.
Benchmark: Enable or disable displaying the benchmark and choose colors.

Luxy Sector & Industry RS AnalyzerEver wonder why some stocks soar while others in the same sector barely move? Or why your perfectly timed entry still loses money? Possibly the answer can be found in Relative Strength.
The Luxy Sector & Industry RS Analyzer solves a critical problem that most traders overlook: picking strong stocks in strong sectors AND strong industries . It's not enough for a stock to go up - you want stocks that are crushing their competition at both the sector AND industry level. This indicator does the heavy lifting by automatically comparing your stock against its sector ETF, industry ETF, the broader market, sector leader, and industry leader, giving you a complete multi-level picture of relative performance.
What makes this different?
- Automatic sector AND industry detection - no manual setup required
- Multi-level hierarchy analysis: Market → Sector → Industry → Stock
- Multi-timeframe analysis (1 month to 1 year) in one glance
- Industry ETF mapping (30+ industries covered)
- Clear 0-100 scoring system with letter grades (A+ to F)
- Works on stocks, crypto, forex, and commodities
- Real-time updates with anti-repaint protection
Think of it as your performance dashboard - instantly showing you if you're trading a champion or a laggard at every level of the market hierarchy.
METHODOLOGY & ATTRIBUTION
This indicator is based on classical Relative Strength (RS) analysis principles from technical analysis. RS methodology compares an asset's price performance against a benchmark to identify relative outperformance or underperformance. This concept has been used by professional traders and institutions for decades.
Key Concepts Used:
Relative Strength (RS) - Classical technical analysis concept measuring comparative performance
Multi-Level Hierarchy Analysis - Market → Sector → Industry → Stock comparison
Sector Rotation Analysis - Identifying which sectors are leading or lagging the market
Industry Rotation Analysis - Identifying which industries are leading within their sectors
Multi-period Performance Analysis - Evaluating strength across multiple timeframes
Beta Calculation - Standard statistical measure of volatility relative to a benchmark
DISCLAIMER: This indicator is for educational and informational purposes only. It should not be considered financial advice or a recommendation to buy or sell. Past performance does not guarantee future results. Trading involves risk and may not be suitable for all investors. Always do your own research and consult with a financial advisor before making investment decisions.
with all rows visible - capture when stock has strong RS score (70+) so users can see what a "good" setup looks like]
WHAT THE INDICATOR SHOWS
1. AUTOMATIC ASSET TYPE DETECTION
The indicator automatically identifies what you're analyzing and adjusts accordingly:
Stocks - Compares to sector ETF (XLK, XLF, XLV, etc.) and SPY
Crypto - Compares to Total Crypto Market Cap and Bitcoin
Forex - Compares to relevant currency index (DXY, EXY, etc.)
Commodities - Compares to Gold (GLD) as benchmark
Indices - Compares to broader market indices
How it works: The indicator reads your chart's asset type and ticker, then automatically maps it to the correct sector or benchmark. For stocks, it uses intelligent sector detection (looking at the sector field) to match you with the right sector ETF. For example:
- Technology stocks get compared to XLK (Technology Select Sector SPDR)
- Financial stocks get compared to XLF (Financial Select Sector SPDR)
- Healthcare stocks get compared to XLV (Health Care Select Sector SPDR)
This happens instantly when you add the indicator to any chart - no configuration needed.
2. SECTOR & MARKET BENCHMARKS
What is a Sector ETF?
A sector ETF is an exchange-traded fund that tracks a specific industry group. For example, XLK contains all major technology companies. By comparing your stock to its sector ETF, you can see if your stock is outperforming or underperforming its peers.
The indicator shows three key comparison points:
Stock vs Sector (Benchmark)
This tells you how your stock performs compared to companies in the same industry. Positive numbers mean your stock is beating the sector average. Negative numbers mean it's lagging behind.
Stock vs Market (SPY)
This shows performance against the broader S&P 500 index. This is important because even if a stock beats its sector, the entire sector might be weak. You want stocks that beat both their sector AND the market.
Sector vs Market
This reveals "sector rotation" - whether money is flowing into or out of this sector. When this number is positive, the whole sector is hot and leading the market. This is powerful because strong sectors tend to lift all boats, making it easier to find winners.
3. MULTI-PERIOD PERFORMANCE ANALYSIS
The indicator calculates performance across four timeframes simultaneously:
1 Month (1M) - Recent short-term momentum
3 Months (3M) - Medium-term trend strength
6 Months (6M) - Longer-term positioning
1 Year (1Y) - Full-cycle performance view
Why multiple periods matter:
A stock might look great over 1 month but terrible over 6 months - that's a red flag. The best stocks show consistent strength across all timeframes . When you see positive RS (Relative Strength) values across all four periods, you've found a stock with sustained outperformance.
Each row in the table shows:
- Raw performance percentage for that period
- RS value (the difference compared to benchmark)
- Color coding: Green for positive, red for negative, white for neutral
4. SECTOR LEADER COMPARISON
The indicator automatically identifies and compares your stock to the sector leader - the dominant stock in that industry.
Sector leaders by industry:
Technology: Apple (AAPL)
Healthcare: UnitedHealth (UNH)
Financial: JPMorgan Chase (JPM)
Energy: ExxonMobil (XOM)
Consumer Discretionary: Amazon (AMZN)
Consumer Staples: Walmart (WMT)
And more...
Why this matters:
Comparing to the leader shows you if you're trading a champion or a follower. If your stock consistently beats the sector leader, you've found something special. If it's lagging the leader, you might want to trade the leader instead.
Optional Custom Leader:
You can override the automatic leader and compare to any stock you choose. This is useful if you want to benchmark against a specific competitor or reference stock.
NEW! INDUSTRY ANALYSIS (STOCKS ONLY)
The indicator now provides multi-level analysis by automatically detecting and comparing your stock to its specific industry , not just the broad sector.
Why Industry matters:
Technology sector (XLK) contains many different industries: Software, Semiconductors, Hardware, etc. A software stock might beat the broad tech sector but lag behind other software companies. Industry analysis provides this granular view.
Industry ETF Mapping (30+ industries):
Software/Applications: IGV (iShares Software ETF)
Semiconductors: SMH (VanEck Semiconductor ETF)
Biotech: IBB (iShares Biotechnology ETF)
Pharmaceuticals: XPH (SPDR Pharmaceuticals ETF)
Banks: KBE (SPDR S&P Bank ETF)
Regional Banks: KRE (SPDR Regional Banking ETF)
Oil & Gas Exploration: XOP (SPDR Oil & Gas Exploration ETF)
Homebuilders: XHB (SPDR Homebuilders ETF)
Retail: XRT (SPDR S&P Retail ETF)
Aerospace & Defense: ITA (iShares U.S. Aerospace & Defense ETF)
And many more...
Industry Leader Mapping:
The indicator also identifies the leader within each industry:
Software: Microsoft (MSFT)
Semiconductors: NVIDIA (NVDA)
Biotech: Amgen (AMGN)
Pharmaceuticals: Eli Lilly (LLY)
Banks: JPMorgan (JPM)
Oil Exploration: ConocoPhillips (COP)
And more...
New Table Rows for Stocks:
Industry ETF Performance - How the specific industry performed (green background)
Industry Leader Performance - How the top stock in the industry performed
vs Industry RS - Your stock's outperformance vs its industry ETF
Industry vs Sector RS - Is this industry hot or cold within its sector?
vs Industry Leader RS - Your stock's performance vs the industry's best
Why this is powerful:
A stock that beats both its sector AND its industry is showing strength at every level. This indicates true relative strength, not just riding sector-wide momentum.
Optional Custom Industry:
You can override automatic detection for both Industry ETF and Industry Leader in settings.
5. RS SCORE & GRADING SYSTEM (0-100)
The heart of the indicator is the RS Score - a weighted calculation that distills all the performance data into one clear number from 0 to 100.
How the score is calculated:
FOR STOCKS (with Industry data):
The indicator splits the weight between Sector (60%) and Industry (40%):
SECTOR RS (60% of total weight):
1 Month RS: 24% weight (40% × 0.6)
3 Month RS: 18% weight (30% × 0.6)
6 Month RS: 12% weight (20% × 0.6)
1 Year RS: 6% weight (10% × 0.6)
INDUSTRY RS (40% of total weight):
1 Month RS: 16% weight (40% × 0.4)
3 Month RS: 12% weight (30% × 0.4)
6 Month RS: 8% weight (20% × 0.4)
1 Year RS: 4% weight (10% × 0.4)
FOR OTHER ASSETS (Crypto, Forex, Commodities):
Uses full 100% weight on benchmark:
1 Month RS: 40% weight
3 Month RS: 30% weight
6 Month RS: 20% weight
1 Year RS: 10% weight
It starts at 50 (neutral) and adds or subtracts points based on your asset's relative strength in each period.
Bonus points:
+5 points if the sector is outperforming the market (sector rotation is bullish)
+5 points if the industry is outperforming its sector (hot industry) - STOCKS ONLY
+5 points if RS momentum is improving (getting stronger over time)
-5 points if RS momentum is declining (getting weaker)
The final score is capped between 0-100.
Letter Grade System:
90-100: A+ - Elite performer, crushing the sector
85-89: A - Excellent, strong outperformer
80-84: A- - Very good, above average
75-79: B+ - Good, solid performer
70-74: B - Above average, decent strength
65-69: B- - Slightly above average
60-64: C+ - Average, neutral strength
55-59: C - Below average
50-54: C- - Weak, slight underperformance
45-49: D+ - Concerning weakness
40-44: D - Poor, significant underperformance
0-39: F - Failing, avoid this stock
What scores mean for trading:
- RS Score above 70: Strong stocks worth considering for long positions
- RS Score 50-70: Average stocks, better opportunities elsewhere
- RS Score below 50: Weak stocks, avoid or consider for shorts
6. CONSISTENCY SCORE
This metric shows what percentage of time periods show positive RS .
For STOCKS (with Industry data):
Counts both Sector RS periods AND Industry RS periods (up to 8 total periods):
- If a stock beats both sector and industry in all 4 periods each: Consistency = 100% (8/8)
- If it beats in 6 out of 8 total periods: Consistency = 75%
- If it beats in 4 out of 8 total periods: Consistency = 50%
For OTHER ASSETS:
Counts benchmark periods only (4 total):
- If it beats benchmark in all 4 periods (1M, 3M, 6M, 1Y): Consistency = 100%
- If it beats in 3 out of 4 periods: Consistency = 75%
- If it beats in 2 out of 4 periods: Consistency = 50%
Why consistency matters:
A high RS Score with low consistency might indicate a recent spike that could fade. The best stocks show both high RS Score AND high consistency - they're strong now AND have been strong historically at both the sector AND industry level.
Look for stocks with:
Consistency above 75%: Very reliable strength across all levels
Consistency 50-75%: Decent but check other metrics
Consistency below 50%: Weak or erratic, proceed with caution
7. BETA CALCULATION (Volatility Measure)
Beta measures how much more volatile your stock is compared to its sector.
Beta > 1.2 : High volatility - stock moves more aggressively than sector (marked as "High")
Beta 0.8-1.2 : Normal volatility - moves roughly in line with sector
Beta < 0.8 : Low volatility - stock is more stable than sector (marked as "Low")
Formula used:
Beta = Correlation(Stock, Sector) × (Standard Deviation of Stock / Standard Deviation of Sector)
This uses a 20-period calculation for reliability.
How to use Beta:
- High Beta stocks offer bigger gains but also bigger risks - good for aggressive traders
- Low Beta stocks are more defensive - good for conservative positions
- Match Beta to your risk tolerance and strategy
8. DAYS ABOVE/BELOW SECTOR
This tracks consecutive periods (bars) where your stock outperforms or underperforms its sector.
Days Above Sector:
Counts how many bars in a row your stock has beaten the sector.
10+ days: Strong sustained strength (shown in bright green)
5-9 days: Building momentum (shown in yellow)
1-4 days: Early strength (shown in white)
0 days: Not currently outperforming
Days Below Sector:
Counts how many bars in a row your stock has lagged the sector.
10+ days: Sustained weakness (shown in bright red)
5-9 days: Losing momentum (shown in orange)
1-4 days: Minor weakness (shown in white)
0 days: Not underperforming (this is good!)
Why this matters:
Long streaks show trend persistence. A stock with 15+ days above sector is riding strong momentum. A stock with 15+ days below sector is in a sustained downtrend relative to peers.
9. PRICE VS 52-WEEK HIGH
Shows where current price sits relative to its 52-week high (or equivalent for your timeframe).
95%+ (green) : Stock is near all-time highs - strong positioning
80-94% (yellow) : Stock is in a pullback but still relatively strong
Below 80% : Stock has pulled back significantly from highs
Why this matters:
The strongest stocks stay near their highs. When you see a stock with high RS Score AND price near 52W high, you've found a stock with institutional support and strong buying pressure.
10. RELATIVE VOLUME
Compares current volume to the 20-period average volume.
1.5x+ (green) : High volume - significant interest and participation
Around 1.0x : Average volume - normal trading activity
Below 1.0x : Low volume - less interest or inactive period
Why volume matters:
High relative volume confirms price moves. When a stock makes a strong move on 2x or 3x normal volume, it's more likely to sustain. Low volume moves are often just noise.
11. AVERAGE RS STRENGTH
This calculates the average absolute value of all RS readings across the four timeframes.
It shows the magnitude of divergence from the sector, regardless of direction. A high number means the stock moves very differently from its sector (could be much stronger or much weaker). A low number means it tracks closely with the sector.
High Average RS: Stock has strong character, moves independently
Low Average RS: Stock follows sector closely, lacks individual strength
12. SECTOR ROTATION SIGNAL
This indicator automatically detects when a sector is experiencing bullish rotation - meaning money is flowing into the sector and it's outperforming the broader market.
Condition for bullish rotation:
Sector must be beating SPY (market) in both 1-month AND 3-month periods.
Why this matters:
Stocks in hot sectors tend to perform better because they have tailwinds from sector-wide buying. When sector rotation is bullish and your stock has a high RS Score, you've found an ideal setup.
The indicator adds +5 bonus points to the RS Score when sector rotation is bullish.
13. MOMENTUM DETECTION
The indicator compares 1-month RS to 3-month RS to detect if momentum is improving or declining.
RS Momentum Improving: 1M RS is better than 3M RS - stock is getting stronger (adds +5 to score)
RS Momentum Declining: 1M RS is worse than 3M RS - stock is getting weaker (subtracts -5 from score)
Why momentum matters:
You want to catch stocks as momentum is building, not after it's already peaked. Improving momentum suggests the strength is accelerating, not fading.
14. OVERALL ASSESSMENT & RECOMMENDATION
The indicator provides two quick summary rows:
Overall Rating:
Based on grade and RS Score, you get an instant quality rating:
Strong Leader (A/A+) - Top tier stock, crushing it
Above Average (A-/B+) - Solid performer, better than most
Average (B/B-) - Middle of the pack
Below Average (C/C+) - Struggling, watch carefully
Underperformer (D/F) - Weak stock, underperforming badly
Trading Signal:
Combines multiple factors to give setup quality:
STRONG BUY SETUP - RS Score 70+, Consistency 75+, AND sector rotation bullish. This is the perfect storm - strong stock, consistent strength, hot sector.
BULLISH - RS Score 60+, Consistency 50+. Good quality stock worth considering.
NEUTRAL - RS Score 50+. Okay but not exciting, better opportunities exist.
WEAK - RS Score 40-49. Below average, risky.
AVOID - RS Score below 40. Stay away, too weak.
IMPORTANT: These are educational signals only, not financial advice. Always do your own analysis and risk management.
KEY FEATURES
1. AUTOMATIC EVERYTHING
- Auto-detects asset type (stock, crypto, forex, commodity, index)
- Auto-maps stocks to correct sector ETF (11 sectors covered)
- Auto-maps stocks to correct industry ETF (30+ industries covered)
- Auto-identifies sector leader AND industry leader
- Auto-selects appropriate market benchmark
- Zero configuration required - just add to chart
2. MULTI-ASSET SUPPORT
Works on all asset classes:
US Stocks - Compares to sector ETFs (XLK, XLF, XLV, etc.)
Crypto - Compares to Total Crypto Market Cap
Forex - Compares to currency indices (DXY, EXY, etc.)
Commodities - Compares to Gold (GLD)
Indices - Compares to broader market benchmarks
3. FLEXIBLE DISPLAY
9 table positions (top/middle/bottom, left/center/right)
4 size options (tiny, small, normal, large)
Show/hide table completely
Real-time indicator toggle
4. TIMEFRAME FLEXIBILITY
Choose your analysis timeframe:
Chart Timeframe (default) - Uses whatever timeframe your chart is on
Fixed: 1 Hour, 4 Hours, Daily, Weekly - Forces calculations to specific timeframe
This means you can be on a 5-minute chart but analyze RS on Daily timeframe if you prefer.
5. RS SCORE FILTERING
Set a minimum RS Score threshold to only see strong stocks:
Set to 0 - Shows all stocks
Set to 70 - Only displays stocks with RS Score 70+ (strong stocks only)
Warning message displays if stock doesn't meet threshold
Perfect for screening - quickly scan multiple charts and the indicator only shows tables for stocks that pass your quality filter.
6. CUSTOM LEADER COMPARISON
Override automatic leader detection:
Compare to any ticker you choose
Benchmark against specific competitors
Use your own reference stocks
7. COMPREHENSIVE TOOLTIPS
Every input parameter and every table row has detailed tooltips explaining:
What the metric measures
How to interpret the values
What thresholds indicate strength/weakness
Why it matters for trading
Hover over any element to learn - it's like having a trading coach built in.
8. SMART ALERTS
Built-in alert system for key events:
Divergence Alerts:
Get notified when your stock diverges significantly from its sector.
Bullish Divergence: Stock beating sector by threshold percentage
Bearish Divergence: Stock losing to sector by threshold percentage
Set your threshold (default 5%) - this determines how big a divergence triggers the alert.
RS Score Alerts:
Get notified when RS Score crosses your threshold:
Crossed Above: RS Score went from below to above your threshold (bullish)
Crossed Below: RS Score dropped from above to below threshold (bearish)
Set your threshold (default 70) to focus on strong stocks.
Sector Rotation Alert:
Fires when sector shows bullish rotation (outperforming market).
HOW TO USE THE INDICATOR
FOR SWING TRADERS:
1. Add indicator to your watchlist stocks
2. Look for RS Score 70+ with Consistency 75%+
3. Check if sector rotation is bullish (bonus!)
4. Verify price is near 52W high (95%+)
5. Wait for entry setup on your chart
6. Use stop loss below key support
Example Setup:
Stock shows:
- RS Score: 82 (Grade: A-)
- Consistency: 100% (strong across all periods)
- Sector Rotation: Bullish
- Price vs 52W High: 96%
- Days Above Sector: 12 days
- Relative Volume: 1.8x
This is a textbook strong stock in a hot sector near highs - ideal for swing long.
FOR POSITION TRADERS:
1. Focus on 6-month and 1-year RS values
2. Look for sustained outperformance (Consistency 75%+)
3. Prefer lower Beta stocks (less volatility)
4. Check Days Above Sector for trend persistence
5. Monitor RS Score monthly, exit if drops below 60
FOR ACTIVE TRADERS:
1. Use on intraday timeframes (1H or 4H)
2. Set RS Score filter to 60+ for quick screening
3. Enable Divergence Alerts
4. Watch for momentum improving signal
5. Higher Beta stocks offer more movement
FOR SHORT SELLERS:
1. Look for RS Score below 40 (Grade: D or F)
2. Check for declining momentum
3. Verify Days Below Sector is increasing (10+)
4. Sector rotation should be bearish
5. Price should be well off 52W high
WHAT MAKES A PERFECT SETUP:
The holy grail combination:
RS Score: 75+ (A- or better)
Consistency: 80%+ (strong across time - beats sector AND industry)
Sector Rotation: Bullish (hot sector)
Industry vs Sector: Positive (hot industry within sector)
Days Above Sector: 10+ (sustained strength)
Momentum: Improving (getting stronger)
Price vs 52W High: 90%+ (near highs)
Relative Volume: 1.5x+ (volume confirmation)
When you find this combination, you've located a stock with every advantage in its favor - strong at the stock level, industry level, AND sector level. That's multi-level confirmation of relative strength.
IMPORTANT NOTES
Data Reliability:
All calculations use lookahead=off for anti-repaint protection
Historical values will never change
Real-time indicator toggle only affects the visual clock icon, not data reliability
All security requests are properly configured to prevent future data leakage
Sector Mapping Notes:
Sector detection uses TradingView's sector field
Some stocks may not have sector data - indicator will adapt
Sector ETFs used: XLK, XLF, XLV, XLE, XLY, XLP, XLI, XLB, XLRE, XLU, XLC
Major market ETFs (SPY, QQQ, DIA) are treated as market benchmarks, not stocks
Multi-Asset Notes:
Crypto compares to CRYPTOCAP:TOTAL (total crypto market cap)
Forex compares to relevant currency index based on base currency
Commodities compare to Gold (GLD) as primary commodity benchmark
Custom leaders can be set for any asset type
FREQUENTLY ASKED QUESTIONS
Q: What does RS Score of 75 actually mean?
A: It means your stock is strongly outperforming its sector across multiple timeframes. The score is weighted toward recent performance (1-month gets 40% weight), so 75 indicates sustained relative strength with emphasis on current momentum.
Q: My stock has high RS Score but is going down. Why?
A: RS Score measures relative performance (vs sector/market), not absolute price direction. A stock can fall 5% while its sector falls 10% - that's still positive relative strength. In bear markets or sector corrections, high RS stocks often fall less than peers.
Q: Should I only trade stocks with RS Score above 70?
A: For long positions, yes - focus on 70+ scores. These stocks have proven they can beat their sector. However, for pairs trading or relative value plays, you might also short stocks with scores below 40 while longing stocks above 70.
Q: What if my stock doesn't have a sector?
A: The indicator handles this gracefully. If no sector is detected, it will compare directly to the market (SPY for stocks). Some rows may show N/A, but the indicator will still provide useful market-relative data.
Q: Why does the sector sometimes show N/A?
A: This happens when: 1) Your asset has no sector classification, 2) The stock IS the sector ETF itself, 3) You're analyzing a non-stock asset (crypto, forex, commodity). The indicator adapts by focusing on market-relative metrics instead.
Q: Can I use this on cryptocurrencies?
A: Yes! The indicator automatically detects crypto and compares to the Total Crypto Market Cap (CRYPTOCAP:TOTAL). You can also set a custom leader like Bitcoin (BTCUSD) to compare against the dominant crypto.
Q: What's the difference between RS Score and Consistency?
A: RS Score is the weighted average of how much you're beating the sector (magnitude). Consistency is what percentage of time periods show outperformance (reliability). You want both high - that means strong AND consistent.
Q: Do the alerts repaint?
A: No. All alerts fire only on bar close (barstate.isconfirmed) and use properly configured data with lookahead=off. Once an alert fires, it's final and won't change.
Q: What timeframe should I use?
A: For swing trading: Daily or Weekly. For day trading: 1H or 4H. For position trading: Weekly. Use "Chart Timeframe" mode and switch your chart timeframe to change the analysis period easily.
Q: Why is Days Above Sector showing 0?
A: This means your stock is not currently outperforming its sector. If Days Below Sector is also 0, it means the RS is exactly neutral (very rare). Check the actual RS values to see current standing.
Q: Can I compare to a different market benchmark than SPY?
A: Currently the indicator uses SPY (S&P 500) as the default US stock market benchmark. For crypto it uses CRYPTOCAP:TOTAL, for forex it uses currency indices, etc. The benchmark auto-adjusts based on asset type.
Q: What's a good Beta value?
A: It depends on your strategy. Aggressive traders prefer Beta above 1.2 (more volatility = bigger moves). Conservative traders prefer Beta 0.8-1.0 (more stable). Beta is neutral - it's about matching your risk tolerance.
Q: How often does the table update?
A: With Real-time Indicator enabled: Every tick (constant updates). With it disabled: Only on bar close. Either way, the underlying data is identical and non-repainting - the toggle only affects update frequency and the clock icon display.
Q: My stock is showing "AVOID" but it's up 50% this year. Is the indicator wrong?
A: Not necessarily. The indicator measures RELATIVE performance. If your stock is up 50% but the sector is up 100%, your stock is actually underperforming by 50%. The indicator helps you identify when you should switch to stronger stocks in the same sector.
Q: What does "Strong Buy Setup" really mean?
A: It means three things aligned: 1) RS Score above 70 (strong stock), 2) Consistency above 75% (reliable strength), 3) Sector rotation is bullish (hot sector). This combination historically correlates with stocks that continue outperforming. However, this is NOT financial advice - always do your own analysis.
Q: Can I use this for options trading?
A: Yes! High RS Score stocks make good candidates for call options (bullish bets) while low RS Score stocks may work for puts (bearish bets). Higher Beta stocks will have more volatile options (higher premiums but more movement).
Q: Why is my crypto showing N/A for sector?
A: Cryptocurrencies don't have "sectors" like stocks do. Instead, the indicator compares crypto to the total crypto market cap. This is normal and expected behavior.
Q: What happens if I'm analyzing an ETF?
A: If you're analyzing a sector ETF (like XLK), it will compare to SPY (market). If you're analyzing SPY itself, some comparisons won't be available (can't compare SPY to itself). The indicator intelligently adapts to avoid circular comparisons.
Q: What if my stock doesn't have industry data?
A: Not all stocks are mapped to specific industries (only 30+ major industries are covered). If no industry is detected, the indicator will still work using only sector analysis. The RS Score calculation will use 100% sector weight instead of the 60%/40% split.
Q: Why does Industry vs Sector matter?
A: Industry vs Sector shows if your specific industry is hot or cold within its broader sector. For example, Semiconductors (SMH) might be outperforming Technology sector (XLK) even though both are up. This helps you find not just strong sectors, but the strongest industries within those sectors.
Q: Can I disable Industry analysis?
A: Yes! In the "Industry Analysis" settings group, you can toggle off "Show Industry Analysis in Table" to hide all industry rows. However, even when hidden, industry data still contributes to the RS Score calculation for stocks.
Q: Why is my Consistency Score lower for stocks than other assets?
A: For stocks with industry data, Consistency counts 8 periods (4 Sector + 4 Industry periods) instead of just 4. This means the bar is higher - your stock needs to beat both sector AND industry consistently. A stock that beats sector in all 4 periods but lags industry in 2 periods will show 75% consistency (6/8), not 100%.
BEST PRACTICES
Use as a screening tool - Set RS Score filter to 70+ and quickly scan your watchlist. Only strong stocks will show the table.
Combine with technical analysis - RS Score tells you WHAT to trade, your chart tells you WHEN to enter.
Check multiple timeframes - Switch between Daily and Weekly to see if strength holds across different time horizons.
Monitor sector rotation - When sector goes from bearish to bullish rotation, it's often a great time to enter stocks in that sector.
Watch Industry vs Sector - Stocks in hot industries within hot sectors have double tailwinds. Prioritize Industry vs Sector positive values.
Pay attention to consistency - High RS Score with low consistency might be a spike that fades. Look for 70%+ consistency across BOTH sector and industry.
Use the leader comparison - If your stock consistently beats both sector leader AND industry leader, you may have found the next champion.
Watch days above/below sector - Long streaks (15+ days) indicate strong trends. Look for these in conjunction with high RS Score.
Set alerts on key stocks - Enable RS Score alerts at 70 threshold to get notified when watchlist stocks become strong.
Consider Beta for position sizing - Size smaller positions in high Beta stocks, larger in low Beta stocks for balanced risk.
Exit when RS Score drops - If a stock's RS Score falls below 60, consider reducing or exiting - the strength may be fading.
Leverage industry-level insight - If Industry ETF is weak but stock is strong, that's standout strength. If Industry is hot but stock is lagging, consider switching to the industry leader instead.
SETTINGS EXPLAINED
Display Settings:
Show Performance Table - Master on/off switch for the table
Table Position - 9 positions available (corners, edges, center)
Table Size - 4 sizes (tiny, small, normal, large) for different screen sizes
Timeframe Settings:
Chart Timeframe (recommended) - Dynamic, uses whatever chart TF you're on
Fixed Timeframes - Locks analysis to 1H, 4H, Daily, or Weekly regardless of chart
Filtering Settings:
Minimum RS Score - Set threshold (0-100) for displaying table
Show Warning - When enabled, displays message if stock doesn't meet filter
Alert Settings:
Divergence Alerts - Enable alerts when stock diverges from sector
Threshold (%) - How big a divergence triggers alert (default 5%)
RS Score Alerts - Enable alerts when RS Score crosses threshold
Threshold - What RS Score level triggers alert (default 70)
Sector Analysis Settings:
Use Custom Sector ETF - Override automatic sector ETF detection
Sector ETF Symbol - Enter any sector ETF to compare against
Use Custom Sector Leader - Override automatic sector leader detection
Sector Leader Symbol - Enter any ticker as sector leader
Industry Analysis Settings:
Use Custom Industry ETF - Override automatic industry ETF detection
Industry ETF Symbol - Enter specific industry ETF (e.g., IGV, SMH)
Use Custom Industry Leader - Override automatic industry leader detection
Industry Leader Symbol - Enter specific industry leader
Show Industry Analysis - Toggle all industry rows on/off
Display Settings:
Show Real-time Indicator - Toggle clock icon in header (doesn't affect data)
WHAT THIS INDICATOR DOESN'T DO
To set proper expectations:
Does NOT provide entry/exit signals - this is a strength analyzer, not a trading system
Does NOT predict future price movement - shows current and historical relative strength
Does NOT guarantee profits - strong RS stocks can still decline
Does NOT replace your own analysis - use as one tool among many
Does NOT work on stocks with no sector data - will adapt but some rows show N/A
This indicator is a decision support tool . It helps you identify which stocks are showing relative strength so you can make more informed trading decisions. You still need your own entry strategy, risk management, and position sizing rules.
SUPPORT & CONTACT
Questions or feedback? Use the comments section below or send me a message.
If you find this indicator useful, please give it a boost and share with other traders who might benefit from relative strength analysis.
FINAL REMINDER
This indicator is a tool for analyzing relative strength - it shows you which stocks are outperforming their sector and market. It does NOT provide financial advice or trade signals. Always conduct your own research, manage your risk appropriately, and consult with a financial advisor before making investment decisions.
Past performance of relative strength does not guarantee future results. Strong stocks can become weak, and sectors rotate in and out of favor. Use this indicator as part of a comprehensive trading strategy, not as a standalone decision-making system.
Trade smart, manage risk, and may your RS Scores stay high!
If you got till here and you like my work a BOOST and a COMMENT would make me happy

Market Extreme Zones IndexThe Market Extreme Zones Index is a new mean reversion (valuation) tool focused on catching long term oversold/overbought zones. Combining an enhanced RSI with a smoothed Z-score this indicator allows traders to find oppurtunities during highly oversold/overbought zones.
I will separate the explanation into the following parts:
1. How does it work?
2. Methodologies & Concepts
3. Use cases
How does it work?
The indicator attempts to catch highly unprobable events in either direction to capture reversal points over the long term. This is done by calculating the Z-Score of an enhanced RSI.
First we need to calculate the Enhanced RSI:
For this we need to calculate 2 additional lengths:
Length1 = user defined length
Length2 = Length1/2
Length3 = √Length
Now we need to calculate 3 different RSIs:
1st RSI => uses classic user defined source and classic user defined length.
2nd RSI => uses classic user defined source and Length 2.
3rd RSI => uses RSI 2 as source and Length 2
Now calculate the divergence:
RSI_base => 2nd RSI * 3 - 1st RSI - 3rd RSI
After this we need to calculate the median of the RSI_base over √Length and make a divergence of these 2:
RSI => RSI_base*2 - median
All that remains now is the Z-score calculations:
We need:
Average RSI value
Standard Deviation = a measure of how dispersed or spread out a set of data values are from their average
Z-score = (Current Value - Average Value) / Standard Deviation
After this we just smooth the Z-score with a Weighted Moving average with √Length
Methodology & Concepts
Mean Reversion Methodology:
The methodology behind mean reversion is the theory that asset prices will eventually return to their long-term average after deviating significantly, driven by the belief that extreme moves are temporary.
Z-Score Methodology:
A Z-score, or standard score, is a statistical measure that indicates how many standard deviations a data point is from the mean of a dataset. A positive z-score means the value is above the mean, a negative score means it's below, and a score of zero means the value is equal to the mean.
You might already be able to see where I am going with this:
Z-Score could be used for the extreme moves to capture reversal points.
By applying it to the RSI rather than the Price, we get a more accurate measurement that allow us to get a banger indicator.
Use Cases
Capturing reversal points
Trend Direction
- while the main use it for mean reversion, the values can indicate whether we are in an uptrend or a downtrend.
Advantages:
Visualization:
The indicator has many plots to ensure users can easily see what the indicator signals, such as highlighting extreme conditions with background colors.
Versatility:
This indicator works across multiple assets, including the S&P500 and more, so it is not only for crypto.
Final note:
No indicator alone is perfect.
Backtests are not indicative of future performance.
Hope you enjoy Gs!
Good luck!

Trapper Absolute PriceActionThe Trapper Absolute PriceAction (TAPA) indicator is a custom, momentum-based oscillator designed to help traders visually read shifts in bullish and bearish price strength — with no reliance on volume or external data.
TAPA calculates and smooths both bullish and bearish momentum using multiple methods (RSI, Stochastic, or ADX) and compares their relative strength in real time. The result is a clean dual-line oscillator with color-coded histograms that highlight which side of the market currently has control.
It was built to give traders a sniper-level precision tool for detecting early momentum shifts before they appear clearly on price charts, allowing confirmation or invalidation of setups faster than with lagging indicators.
How It Works
Momentum Strength Calculation
The script measures directional price movement across the chosen mode (RSI, Stochastic, or ADX).
These values are smoothed twice using a selectable moving average type (WMA, EMA, SMA, ALMA, HMA, etc.).
Bullish & Bearish Curves
The green line represents smoothed bullish momentum (SmthBulls).
The orange/red line represents smoothed bearish momentum (SmthBears).
Histogram Strength Visualization
The distance between the two curves forms a color-coded histogram.
Green/Lime bars indicate growing bullish control, while Orange/Red bars show bearish dominance.
A gray neutral zone reflects indecision or range-bound conditions.
Signal Triggers
BUY 🐂 appears when the green line crosses up through the orange — signaling a bullish momentum flip.
SELL 🐻 appears when the green line crosses down through the orange — signaling bearish control.
Alerts can be enabled directly in TradingView through the BUY (🐂) or SELL (🐻) alert conditions for automated notifications or integrations.
How to Use
1. Confirm Early Momentum Shifts
When a crossover appears, check that the histogram color supports the move (green shades for bullish, red/orange for bearish).
Avoid signals when both lines are tangled and the histogram alternates gray, that usually indicates consolidation or low volatility.
2. Validate with Higher-Timeframe Structure
TAPA is most powerful when aligned with trend structure from higher timeframes.
Example: A bullish crossover on the 1-hour timeframe, while the daily TAPA shows the green line already rising, can confirm momentum alignment before entry.
3. Combine with Support/Resistance
Mark your key support and resistance zones (manual or using your “Trapper S&R PRO” indicator).
Look for a TAPA bullish crossover occurring at a major support zone, that’s often the start of a reversal move.
4. Multi-Mode Analysis
Experiment with “Indicator Method” in the inputs:
RSI Mode - smoother and responsive for swing trading.
Stochastic Mode - better for short-term entries and exits.
ADX Mode - captures trending momentum on strong breakouts.
Examples
Bullish Example:
Price forms a higher low on the chart while TAPA’s green line crosses up through orange with a lime/green histogram. That’s a strong early signal that momentum is reversing before price confirms on structure.
Bearish Example:
Price rallies into resistance, then TAPA shows a red histogram and a bearish cross (green dropping under orange). That’s typically a high-probability short signal once structure breaks.
What Makes TAPA Different
No Volume Dependency: Focuses purely on price behavior, not volume spikes or anomalies.
Multi-Mode Engine: Switch between RSI, Stochastic, or ADX-style momentum math instantly.
Customizable Visuals: Editable histogram color layers (weak/strong bull/bear, neutral) and line color control.
Sniper Labeling System: Clean, minimal BUY/SELL cues at each verified crossover.
Alert-Ready: Built-in conditions allow for TradingView alerts, webhooks, or bot automation.
Modernized Core: Rebuilt in Pine v6 with optimized performance and compliance to TradingView standards.
TAPA is designed to filter out the noise and show what truly drives a move — the shift in control between buyers and sellers.
Best Pairing Indicators
To get maximum clarity and confluence:
Trapper Support & Resistance PRO
Helps identify key zones where momentum flips from TAPA have the most impact. A bullish crossover at a defined support level often marks an early trend reversal.
Trapper Volume Trigger
While TAPA doesn’t use volume internally, pairing it with a volume-based trigger confirms that momentum shifts have institutional participation.
Simple Moving Averages (5, 20, or 50)
Overlay short and mid-term SMAs on your chart to confirm directional bias. A bullish TAPA cross that aligns with SMA-5 crossing above SMA-20 increases reliability.
Disclaimer
This indicator is provided for educational and analytical purposes only.
It does not constitute financial advice or a recommendation to buy or sell any security.
Always conduct your own due diligence and practice proper risk management before trading any strategy.
© 2025 RAMS-offthecharts | “Read • Analyze • Mark • Snipe.”
TAPA is part of the RAMS ecosystem of tactical market tools, designed for traders who focus on precision, discipline, and momentum awareness.
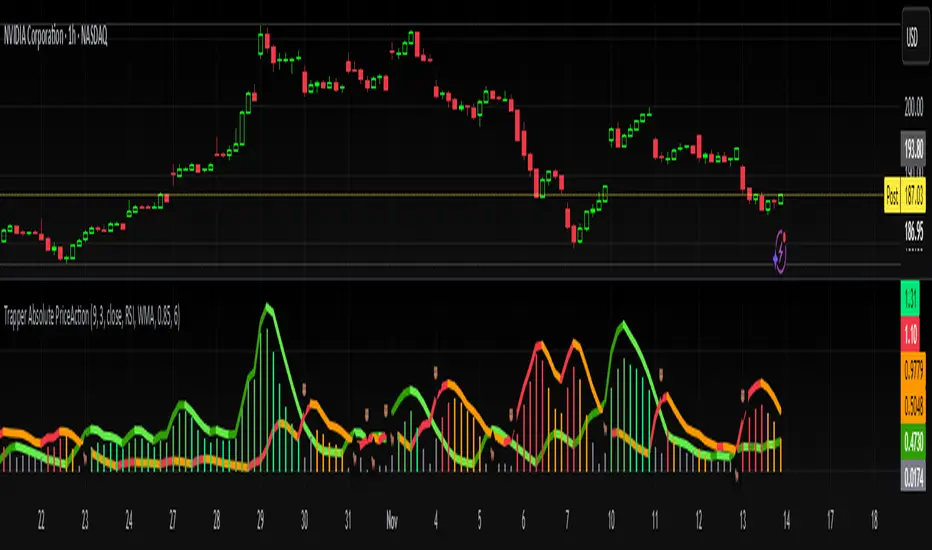
ADX Trend Strength Filter + TRAMA [DotGain]Summary
Are you tired of trading trend signals, only to get stopped out in volatile, sideways chop?
The ADX Trend Strength Filter (ADX TSF) is designed to solve this exact problem. It is a comprehensive trend-following system that only generates signals when a trend not only has the right direction and momentum, but also sufficient strength.
This indicator filters out weak or indecisive market phases (the "chop") and will only color the bars Green or Red when all conditions for a strong, confirmed trend are met.
⚙️ Core Components and Logic
The ADX TSF relies on a triple-filter logic to generate a clear trade signal:
Trend Filter (TRAMA): A TRAMA (Trending Adaptive Moving Average) is used as the main trendline. This adaptive average automatically adjusts to market volatility, acting as a dynamic support/resistance level.
Price > TRAMA = Bullish
Price < TRAMA = Bearish
Momentum Filter (RSI Crossover): Momentum is measured by a crossover of two moving averages of the RSI (a fast EMA and a slow SMA). This confirms whether the momentum is pointing in the same direction as the trend.
Strength Filter (ADX): This is the most important filter. A signal is only considered valid if the ADX (Average Directional Index) is above a defined threshold (Default: 30). This ensures the trend has sufficient strength.
🚦 How to Read the Indicator
The indicator has three states, displayed directly as bar colors on your chart:
🟩 GREEN BARS (Strong Uptrend) All three conditions are met:
Price is above the TRAMA.
RSI momentum is bullish (Fast MA > Slow MA).
ADX is above 30 (Strong trend is present).
🟥 RED BARS (Strong Downtrend) All three conditions are met:
Price is below the TRAMA.
RSI momentum is bearish (Fast MA < Slow MA).
ADX is above 30 (Strong trend is present).
🟧 ORANGE BARS (Neutral / Caution) This state appears if any of the following conditions are true:
Weak Trend: The ADX is below 30. The market is in consolidation or a sideways phase. (This is the primary filter!)
Indecision: The price is caught in the "Neutral Zone" between the TRAMA and the 200 SMA.
Visual Elements
Bar Colors: (Green/Red/Orange) Show the current trend status.
TRAMA (Orange Line): Your primary adaptive trendline.
200 SMA (White Line): Serves as a reference for the long-term trend.
Orange Background (Fill): Fills the area between the TRAMA and SMA to visually highlight the "Neutral Zone."
Key Benefit
The goal of the ADX TSF is to keep traders out of weak, unpredictable markets and help them participate only in strong, momentum-confirmed trends.
Have fun :)
Disclaimer
This "Buy The F*cking Dip" (BTFD) indicator is provided for informational and educational purposes only. It does not, and should not be construed as, financial, investment, or trading advice.
The signals generated by this tool (both "Buy" and "Sell") are the result of a specific set of algorithmic conditions. They are not a direct recommendation to buy or sell any asset. All trading and investing in financial markets involves substantial risk of loss. You can lose all of your invested capital.
Past performance is not indicative of future results. The signals generated may produce false or losing trades. The creator (© DotGain) assumes no liability for any financial losses or damages you may incur as a result of using this indicator.
You are solely responsible for your own trading and investment decisions. Always conduct your own research (DYOR) and consider your personal risk tolerance before making any trades.

Mean Reversion Trading V1Overview
This is a simple mean reversion strategy that combines RSI, Keltner Channels, and MACD Histograms to predict reversals. Current parameters were optimized for NASDAQ 15M and performance varies depending on asset. The strategy can be optimized for specific asset and timeframe.
How it works
Long Entry (All must be true):
1. RSI < Lower Threshold
2. Close < Lower KC Band
3. MACD Histogram > 0 and rising
4. No open trades
Short Entry (All must be true):
1. RSI > Upper Threshold
2. Close > Upper KC Band
3. MACD Histogram < 0 and falling
4. No open trades
Long Exit:
1. Stop Loss: Average position size x ( 1 - SL percent)
2. Take Profit: Average position size x ( 1 + TP percent)
3. MACD Histogram crosses below zero
Short Exit:
1. Stop Loss: Average position size x ( 1 + SL percent)
2. Take Profit: Average position size x ( 1 - TP percent)
3. MACD Histogram crosses above zero
Settings and parameters are explained in the tooltips.
Important
Initial capital is set as 100,000 by default and 100 percent equity is used for trades
