Relative Strength Trend Indicator (RSTI)This indicator is called the "Relative Strength Trend Indicator" (RSTI), designed to assess the relative strength of a trend.
Here is a detailed explanation of how it works and how traders can interpret it:
Indicator Operation:
1. Data Source (src): The indicator considers a data source, typically the closing price (close), but this can be adjusted according to the trader's preferences.
2. Period Length (Length): This determines the period used to calculate the simple moving average (SMA) of the data source. A longer period smoothes the indicator, while a shorter period makes it more responsive.
3. Multiplier (Multiplier): This is a multiplication factor applied to the Average True Range (ATR), adjusting the width of the bands.
4. Signal Length (Signal Length): This period is used to calculate the simple moving average of the relative strength (l_strength). It determines the sensitivity of the signal to changes in relative strength.
Interpretation of the Indicator:
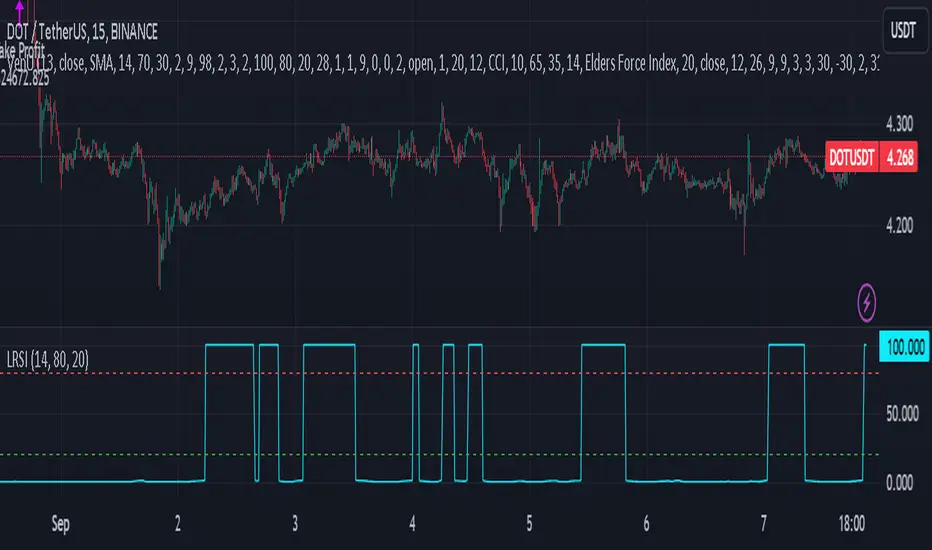
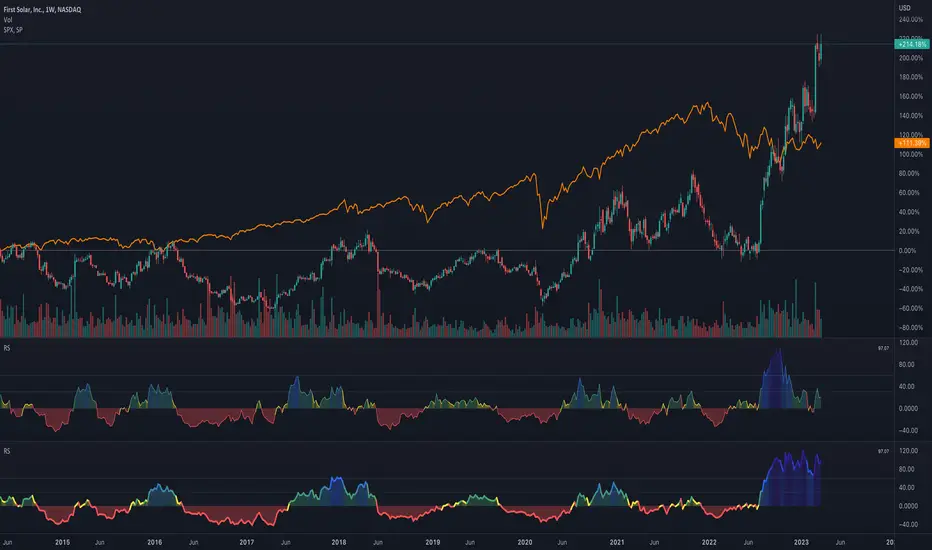
1. Upper Strength Band (Upper Level): This line is drawn at 80 and represents a high strength level. When relative strength exceeds this value, it may indicate a potential overbought market.
2. Lower Strength Band (Lower Level): This line is drawn at 20 and represents a low strength level. When relative strength is below this value, it may indicate a potential oversold market.
3. RSTI Strength: The main line of the indicator, representing the calculated relative strength. When this line exceeds 50, it may indicate an uptrend, while a value below 50 may indicate a downtrend.
4. Filling Zones: These colored zones between levels 80 and 50, and between 50 and 20, can help quickly visualize relative strength. A colored zone above 50 indicates positive strength, while a colored zone below 50 indicates negative strength.
Qualities of the Indicator:
1. Adaptability: The use of ATR and the flexibility of parameters (length, multiplier, signal_length) allow the indicator to adapt to different market conditions.
2. Visual Clarity: Colored filling zones and horizontal lines make it easy to visualize relative strength levels.
3. Strength Signal: The signal line (RSTI Strength) allows traders to quickly spot changes in relative strength, facilitating decision-making.
4. Responsiveness: The combination of smoothed moving averages and relative strength indicators allows responsiveness to trend changes while reducing false signals.
It is essential to note that while this indicator can provide valuable insights, it is always recommended to use it in conjunction with other technical analysis tools for informed decision-making.
Pine Script® Indikator