Litecoin Trailing-Stop StrategyAltcoins Trailing-Stop Strategy
This strategy is based on a momentum breakout approach using PKAMA (Powered Kaufman Adaptive Moving Average) as a trend filter, and a delayed trailing stop mechanism to manage risk effectively.
It has been designed and fine-tuned Altcoins, which historically shows consistent volatility patterns and clean trend structures, especially on intraday timeframes like 15m and 30m.
Strategy Logic:
Entry Conditions:
Long when PKAMA indicates an upward move
Short when PKAMA detects a downward trend
Minimum spacing of 30 bars between trades to avoid overtrading
Trailing Stop:
Activated only after a customizable delay (delayBars)
User can set trailing stop % and delay independently
Helps avoid premature exits due to short-term volatility
Customizable Parameters:
This strategy uses a custom implementation of PKAMA (Powered Kaufman Adaptive Moving Average), inspired by the work of alexgrover
PKAMA is a volatility-aware moving average that adjusts dynamically to market conditions, making it ideal for altcoins where trend strength and direction change frequently.
This script is for educational and experimental purposes only. It is not financial advice. Please test thoroughly before using it in live conditions, and always adapt parameters to your specific asset and time frame.
Feedback is welcome! Feel free to clone and adapt it for your own trading style.
In den Scripts nach "momentum" suchen

02 SMC + BB Breakout (Improved)This strategy combines Smart Money Concepts (SMC) with Bollinger Band breakouts to identify potential trading opportunities. SMC focuses on identifying key price levels and market structure shifts, while Bollinger Bands help pinpoint overbought/oversold conditions and potential breakout points. The strategy also incorporates higher timeframe trend confirmation to filter out trades that go against the prevailing trend.
Key Components:
Bollinger Bands:
Calculated using a Simple Moving Average (SMA) of the closing price and a standard deviation multiplier.
The strategy uses the upper and lower bands to identify potential breakout points.
The SMA (basis) acts as a centerline and potential support/resistance level.
The fill between the upper and lower bands can be toggled by the user.
Higher Timeframe Trend Confirmation:
The strategy allows for optional confirmation of the current trend using a higher timeframe (e.g., daily).
It calculates the SMA of the higher timeframe's closing prices.
A bullish trend is confirmed if the higher timeframe's closing price is above its SMA.
This helps filter out trades that go against the prevailing long-term trend.
Smart Money Concepts (SMC):
Order Blocks:
Simplified as recent price clusters, identified by the highest high and lowest low over a specified lookback period.
These levels are considered potential areas of support or resistance.
Liquidity Zones (Swing Highs/Lows):
Identified by recent swing highs and lows, indicating areas where liquidity may be present.
The Swing highs and lows are calculated based on user defined lookback periods.
Market Structure Shift (MSS):
Identifies potential changes in market structure.
A bullish MSS occurs when the closing price breaks above a previous swing high.
A bearish MSS occurs when the closing price breaks below a previous swing low.
The swing high and low values used for the MSS are calculated based on the user defined swing length.
Entry Conditions:
Long Entry:
The closing price crosses above the upper Bollinger Band.
If higher timeframe confirmation is enabled, the higher timeframe trend must be bullish.
A bullish MSS must have occurred.
Short Entry:
The closing price crosses below the lower Bollinger Band.
If higher timeframe confirmation is enabled, the higher timeframe trend must be bearish.
A bearish MSS must have occurred.
Exit Conditions:
Long Exit:
The closing price crosses below the Bollinger Band basis.
Or the Closing price falls below 99% of the order block low.
Short Exit:
The closing price crosses above the Bollinger Band basis.
Or the closing price rises above 101% of the order block high.
Position Sizing:
The strategy calculates the position size based on a fixed percentage (5%) of the strategy's equity.
This helps manage risk by limiting the potential loss per trade.
Visualizations:
Bollinger Bands (upper, lower, and basis) are plotted on the chart.
SMC elements (order blocks, swing highs/lows) are plotted as lines, with user-adjustable visibility.
Entry and exit signals are plotted as shapes on the chart.
The Bollinger band fill opacity is adjustable by the user.
Trading Logic:
The strategy aims to capitalize on Bollinger Band breakouts that are confirmed by SMC signals and higher timeframe trend. It looks for breakouts that align with potential market structure shifts and key price levels (order blocks, swing highs/lows). The higher timeframe filter helps avoid trades that go against the overall trend.
In essence, the strategy attempts to identify high-probability breakout trades by combining momentum (Bollinger Bands) with structural analysis (SMC) and trend confirmation.
Key User-Adjustable Parameters:
Bollinger Bands Length
Standard Deviation Multiplier
Higher Timeframe
Higher Timeframe Confirmation (on/off)
SMC Elements Visibility (on/off)
Order block lookback length.
Swing lookback length.
Bollinger band fill opacity.
This detailed description should provide a comprehensive understanding of the strategy's logic and components.
***DISCLAIMER: This strategy is for educational purposes only. It is not financial advice. Past performance is not indicative of future results. Use at your own risk. Always perform thorough backtesting and forward testing before using any strategy in live trading.***

PowerZone Trading StrategyExplanation of the PowerZone Trading Strategy for Your Users
The PowerZone Trading Strategy is an automated trading strategy that detects strong price movements (called "PowerZones") and generates signals to enter a long (buy) or short (sell) position, complete with predefined take profit and stop loss levels. Here’s how it works, step by step:
1. What is a PowerZone?
A "PowerZone" (PZ) is a zone on the chart where the price has shown a significant and consistent movement over a specific number of candles (bars). There are two types:
Bullish PowerZone (Bullish PZ): Occurs when the price rises consistently over several candles after an initial bearish candle.
Bearish PowerZone (Bearish PZ): Occurs when the price falls consistently over several candles after an initial bullish candle.
The code analyzes:
A set number of candles (e.g., 5, adjustable via "Periods").
A minimum percentage move (adjustable via "Min % Move for PowerZone") to qualify as a strong zone.
Whether to use the full candle range (highs and lows) or just open/close prices (toggle with "Use Full Range ").
2. How Does It Detect PowerZones?
Bullish PowerZone:
Looks for an initial bearish candle (close below open).
Checks that the next candles (e.g., 5) are all bullish (close above open).
Ensures the total price movement exceeds the minimum percentage set.
Defines a range: from the high (or open) to the low of the initial candle.
Bearish PowerZone:
Looks for an initial bullish candle (close above open).
Checks that the next candles are all bearish (close below open).
Ensures the total price movement exceeds the minimum percentage.
Defines a range: from the high to the low (or close) of the initial candle.
These zones are drawn on the chart with lines: green or white for bullish, red or blue for bearish, depending on the color scheme ("DARK" or "BRIGHT").
3. When Does It Enter a Trade?
The strategy waits for a breakout from the PowerZone range to enter a trade:
Buy (Long): When the price breaks above the high of a Bullish PowerZone.
Sell (Short): When the price breaks below the low of a Bearish PowerZone.
The position size is set to 100% of available equity (adjustable in the code).
4. Take Profit and Stop Loss
Take Profit (TP): Calculated as a multiple (adjustable via "Take Profit Factor," default 1.5) of the PowerZone height. For example:
For a buy, TP = Entry price + (PZ height × 1.5).
For a sell, TP = Entry price - (PZ height × 1.5).
Stop Loss (SL): Calculated as a multiple (adjustable via "Stop Loss Factor," default 1.0) of the PZ height, placed below the range for buys or above for sells.
5. Visualization on the Chart
PowerZones are displayed with lines on the chart (you can hide them with "Show Bullish Channel" or "Show Bearish Channel").
An optional info panel ("Show Info Panel") displays key levels: PZ high and low, TP, and SL.
You can also enable brief documentation on the chart ("Show Documentation") explaining the basic rules.
6. Alerts
The code generates automatic alerts in TradingView:
For a bullish breakout: "Bullish PowerZone Breakout - LONG!"
For a bearish breakdown: "Bearish PowerZone Breakdown - SHORT!"
7. Customization
You can tweak:
The number of candles to detect a PZ ("Periods").
The minimum percentage move ("Min % Move").
Whether to use highs/lows or just open/close ("Use Full Range").
The TP and SL factors.
The color scheme and what elements to display on the chart.
Practical Example
Imagine you set "Periods = 5" and "Min % Move = 2%":
An initial bearish candle appears, followed by 5 consecutive bullish candles.
The total move exceeds 2%.
A Bullish PowerZone is drawn with a high and low.
If the price breaks above the high, you enter a long position with a TP 1.5 times the PZ height and an SL equal to the height below.
The system executes the trade and exits automatically at TP or SL.
Conclusion
This strategy is great for capturing strong price movements after consolidation or momentum zones. It’s automated, visual, and customizable, making it useful for both beginner and advanced traders. Try it out and adjust it to fit your trading style!

EMA 10/55/200 - LONG ONLY MTF (4h with 1D & 1W confirmation)Title: EMA 10/55/200 - Long Only Multi-Timeframe Strategy (4h with 1D & 1W confirmation)
Description:
This strategy is designed for trend-following long entries using a combination of exponential moving averages (EMAs) on the 4-hour chart, confirmed by higher timeframe trends from the daily (1D) and weekly (1W) charts.
🔍 How It Works
🔹 Entry Conditions (4h chart):
EMA 10 crosses above EMA 55 and price is above EMA 55
OR
EMA 55 crosses above EMA 200
OR
EMA 10 crosses above EMA 500
These entries indicate short-term momentum aligning with medium/long-term trend strength.
🔹 Confirmation (multi-timeframe alignment):
Daily (1D): EMA 55 is above EMA 200
Weekly (1W): EMA 55 is above EMA 200
This ensures that we only enter long trades when the higher timeframes support an uptrend, reducing false signals during sideways or bearish markets.
🛑 Exit Conditions
Bearish crossover of EMA 10 below EMA 200 or EMA 500
Stop Loss: 5% below entry price
⚙️ Backtest Settings
Capital allocation per trade: 10% of equity
Commission: 0.1%
Slippage: 2 ticks
These are realistic conditions for crypto, forex, and stocks.
📈 Best Used On
Timeframe: 4h
Instruments: Trending markets like BTC/ETH, FX majors, or growth stocks
Works best in volatile or trending environments
⚠️ Disclaimer
This is a backtest tool and educational resource. Always validate on demo accounts before applying to real capital. Do your own due diligence.

IU Bigger than range strategyDESCRIPTION
IU Bigger Than Range Strategy is designed to capture breakout opportunities by identifying candles that are significantly larger than the previous range. It dynamically calculates the high and low of the last N candles and enters trades when the current candle's range exceeds the previous range. The strategy includes multiple stop-loss methods (Previous High/Low, ATR, Swing High/Low) and automatically manages take-profit and stop-loss levels based on user-defined risk-to-reward ratios. This versatile strategy is optimized for higher timeframes and assets like BTC but can be fine-tuned for different instruments and intervals.
USER INPUTS:
Look back Length: Number of candles to calculate the high-low range. Default is 22.
Risk to Reward: Sets the target reward relative to the stop-loss distance. Default is 3.
Stop Loss Method: Choose between:(Default is "Previous High/Low")
- Previous High/Low
- ATR (Average True Range)
- Swing High/Low
ATR Length: Defines the length for ATR calculation (only applicable when ATR is selected as the stop-loss method) (Default is 14).
ATR Factor: Multiplier applied to the ATR to determine stop-loss distance(Default is 2).
Swing High/Low Length: Specifies the length for identifying swing points (only applicable when Swing High/Low is selected as the stop-loss method).(Default is 2)
LONG CONDITION:
The current candle’s range (absolute difference between open and close) is greater than the previous range.
The closing price is higher than the opening price (bullish candle).
SHORT CONDITIONS:
The current candle’s range exceeds the previous range.
The closing price is lower than the opening price (bearish candle).
LONG EXIT:
Stop-loss:
- Previous Low
- ATR-based trailing stop
- Recent Swing Low
Take-profit:
- Defined by the Risk-to-Reward ratio (default 3x the stop-loss distance).
SHORT EXIT:
Stop-loss:
- Previous High
- ATR-based trailing stop
- Recent Swing High
Take-profit:
- Defined by the Risk-to-Reward ratio (default 3x the stop-loss distance).
ALERTS:
Long Entry Triggered
Short Entry Triggered
WHY IT IS UNIQUE:
This strategy dynamically adapts to different market conditions by identifying candles that exceed the previous range, ensuring that it only enters trades during strong breakout scenarios.
Multiple stop-loss methods provide flexibility for different trading styles and risk profiles.
The visual representation of stop-loss and take-profit levels with color-coded plots improves trade monitoring and decision-making.
HOW USERS CAN BENEFIT FROM IT:
Ideal for breakout traders looking to capitalize on momentum-driven price moves.
Provides flexibility to customize stop-loss methods and fine-tune risk management parameters.
Helps minimize drawdowns with a strong risk-to-reward framework while maximizing profit potential.

ThinkTech AI SignalsThink Tech AI Strategy
The Think Tech AI Strategy provides a structured approach to trading by integrating liquidity-based entries, ATR volatility thresholds, and dynamic risk management. This strategy generates buy and sell signals while automatically calculating take profit and stop loss levels, boasting a 64% win rate based on historical data.
Usage
The strategy can be used to identify key breakout and retest opportunities. Liquidity-based zones act as potential accumulation and distribution areas and may serve as future support or resistance levels. Buy and sell zones are identified using liquidity zones and ATR-based filters. Risk management is built-in, automatically calculating take profit and stop loss levels using ATR multipliers. Volume and trend filtering options help confirm directional bias using a 50 EMA and RSI filter. The strategy also allows for session-based trading, limiting trades to key market hours for higher probability setups.
Settings
The risk/reward ratio can be adjusted to define the desired stop loss and take profit calculations. The ATR length and threshold determine ATR-based breakout conditions for dynamic entries. Liquidity period settings allow for customized analysis of price structure for support and resistance zones. Additional trend and RSI filters can be enabled to refine trade signals based on moving averages and momentum conditions. A session filter is included to restrict trade signals to specific market hours.
Style
The strategy includes options to display liquidity lines, showing key support and resistance areas. The first 15-minute candle breakout zones can also be visualized to highlight critical market structure points. A win/loss statistics table is included to track trade performance directly on the chart.
This strategy is intended for descriptive analysis and should be used alongside other confluence factors. Optimize your trading process with Think Tech AI today!

ETH/USDT EMA Crossover Strategy - OptimizedStrategy Name: EMA Crossover Strategy for ETH/USDT
Description:
This trading strategy is designed for the ETH/USDT pair and is based on exponential moving average (EMA) crossovers combined with momentum and volatility indicators. The strategy uses multiple filters to identify high-probability signals in both bullish and bearish trends, making it suitable for traders looking to trade in trending markets.
Strategy Components
EMAs (Exponential Moving Averages):
EMA 200: Used to identify the primary trend. If the price is above the EMA 200, it is considered a bullish trend; if below, a bearish trend.
EMA 50: Acts as an additional filter to confirm the trend.
EMA 20 and EMA 50 Short: These short-term EMAs generate entry signals through crossovers. A bullish crossover (EMA 20 crosses above EMA 50 Short) is a buy signal, while a bearish crossover (EMA 20 crosses below EMA 50 Short) is a sell signal.
RSI (Relative Strength Index):
The RSI is used to avoid overbought or oversold conditions. Long trades are only taken when the RSI is above 30, and short trades when the RSI is below 70.
ATR (Average True Range):
The ATR is used as a volatility filter. Trades are only taken when there is sufficient volatility, helping to avoid false signals in quiet markets.
Volume:
A volume filter is used to confirm sufficient market participation in the price movement. Trades are only taken when volume is above average.
Strategy Logic
Long Trades:
The price must be above the EMA 200 (bullish trend).
The EMA 20 must cross above the EMA 50 Short.
The RSI must be above 30.
The ATR must indicate sufficient volatility.
Volume must be above average.
Short Trades:
The price must be below the EMA 200 (bearish trend).
The EMA 20 must cross below the EMA 50 Short.
The RSI must be below 70.
The ATR must indicate sufficient volatility.
Volume must be above average.
How to Use the Strategy
Setup:
Add the script to your ETH/USDT chart on TradingView.
Adjust the parameters according to your preferences (e.g., EMA periods, RSI, ATR, etc.).
Signals:
Buy and sell signals will be displayed directly on the chart.
Long trades are indicated with an upward arrow, and short trades with a downward arrow.
Risk Management:
Use stop-loss and take-profit orders in all trades.
Consider a risk-reward ratio of at least 1:2.
Backtesting:
Test the strategy on historical data to evaluate its performance before using it live.
Advantages of the Strategy
Trend-focused: The strategy is designed to trade in trending markets, increasing the probability of success.
Multiple filters: The use of RSI, ATR, and volume reduces false signals.
Adaptability: It can be adjusted for different timeframes, although it is recommended to test it on 5-minute and 15-minute charts for ETH/USDT.
Warnings
Sideways markets: The strategy may generate false signals in markets without a clear trend. It is recommended to avoid trading in such conditions.
Optimization: Make sure to optimize the parameters according to the market and timeframe you are using.
Risk management: Never trade without stop-loss and take-profit orders.
Author
Jose J. Sanchez Cuevas
Version
v1.0

MACD Crossover Strategy MACD Crossover Strategy:
This strategy is based on the Moving Average Convergence Divergence (MACD) indicator, a popular tool used in technical analysis to identify potential trend changes and momentum in price movements. The strategy focuses on MACD crossovers within a specific "important zone" to generate trading signals.
Key Components:
1. MACD Calculation: The strategy uses customizable parameters for fast length (default 12), slow length (default 26), and signal length (default 9) to calculate the MACD line and signal line.
2. Important Zone: Defined by upper and lower thresholds (default 0.5 and -0.5), this zone helps filter out potentially less significant crossovers.
3. Entry Conditions:
- Long (Buy) Entry: When the MACD line crosses above the signal line within the important zone.
- Short (Sell) Entry: When the MACD line crosses below the signal line within the important zone.
4. Exit Conditions: The strategy closes positions on opposite crossover signals. Long positions are closed on bearish crossovers, and short positions on bullish crossovers.
5. Visualization:
- MACD line (blue) and signal line (orange) are plotted.
- The zero line, upper threshold, and lower threshold are displayed for reference.
- Buy signals are represented by green triangles at the bottom of the chart.
- Sell signals are shown as red triangles at the top of the chart.
This strategy aims to capture trend changes while filtering out potentially false signals that occur when the MACD is at extreme values. By focusing on crossovers within the important zone, the strategy attempts to identify more reliable trading opportunities.
Traders can adjust the MACD parameters and the important zone thresholds to fine-tune the strategy for different assets or timeframes. As with any trading strategy, it's crucial to thoroughly backtest and consider risk management before using it in live trading.

Double Bollinger Bands Strategy with Signals (By Rolwin)Double Bollinger Bands Strategy with Signals 1.0 (By Rolwin)
📌 Overview
The Double Bollinger Bands Strategy is a trend-following system that utilizes two sets of Bollinger Bands (2 standard deviations and 3 standard deviations) to identify high-probability entry and exit points. This strategy helps traders capitalize on strong price movements and potential reversals by detecting overbought and oversold conditions more effectively.
📊 How It Works
• Bollinger Bands Setup:
o Middle Band: 20-period Simple Moving Average (SMA)
o Upper & Lower Bands (2 SD): Standard Bollinger Bands (±2 standard deviations)
o Extreme Bands (3 SD): Additional Bollinger Bands (±3 standard deviations) for extreme price moves
• Entry Signals:
✅ Buy (Long Entry): When the price crosses above the lower 3SD band (oversold zone)
❌ Sell (Short Entry): When the price crosses below the upper 3SD band (overbought zone)
• Exit Signals:
🔼 Exit Long: When the price reaches the upper 2SD band
🔽 Exit Short: When the price reaches the lower 2SD band
• Additional Features:
✅ Buy & Sell Signals plotted directly on the chart
🎨 Candles turn white when price touches the extreme 3SD band
🔥 Why Use This Strategy?
✔️ Clear Entry & Exit Points: Based on strong statistical levels
✔️ Effective in Trending & Reversal Markets: Captures both momentum & mean reversion setups
✔️ Easy-to-Use Visualization: Signals & bands make it beginner-friendly
✔️ Customizable: Adjust Bollinger Band length and multipliers to fit different assets & timeframes
⚠️ Risk Management Tip
While this strategy provides high-probability trade signals, it is essential to use stop-loss orders (e.g., ATR-based) and proper position sizing to manage risk effectively.
📈 Try it out and optimize the settings for your favorite markets! 🚀

FVG Breakout Lite by tradingbauhausExplanation of "FVG Breakout Lite by tradingbauhaus"
This script is a trading strategy built for TradingView that helps you spot and trade "Fair Value Gaps" (FVGs)—price areas where the market moved quickly, leaving a gap that might act as support or resistance later. It’s designed to catch breakout opportunities when the price moves strongly in one direction, with extra filters to make trades more reliable. Here’s how it works and how you can use it:
What It Does
1. Finds Fair Value Gaps (FVGs):
A "Bullish FVG" happens when the price jumps up quickly, leaving a gap below where it didn’t trade much (e.g., today’s low is higher than the high from two bars ago).
A "Bearish FVG" is the opposite: the price drops fast, leaving a gap above (e.g., today’s high is lower than the low from two bars ago).
The script draws colored boxes on your chart to show these gaps: green for bullish, red for bearish.
2. Spots Breakouts:
It looks for "strong" FVGs by comparing them to a trend (based on the highest highs and lowest lows over a set period).
If a bullish gap forms above the recent highs, or a bearish gap below the recent lows, it’s marked as a breakout opportunity.
3. Adds a Volume Check:
Trades only happen if the market’s volume is higher than usual (e.g., 1.2x the average volume over the last 20 bars). This helps ensure the breakout has real momentum behind it.
4. Trades Automatically:
Long Trades (Buy): If a bullish breakout FVG forms and volume is high, it buys at the current price.
Short Trades (Sell): If a bearish breakout FVG forms with high volume, it sells short.
Each trade comes with a stop loss (to limit losses) and a take profit (to lock in gains), both adjustable by you.
5. Shows Mitigation Lines (Optional):
If you turn on "Display Mitigation Zones," it draws lines at the edge of each breakout FVG. These lines show where the price might return to "fill" the gap later, helping you see key levels.
6. Includes Webull Costs:
The script factors in real trading fees from Webull, like tiny SEC and FINRA fees for selling, and a daily margin cost if you’re borrowing money to trade. These don’t show up on the chart but affect the strategy’s performance in backtesting.
How to Use It
1. Add to Your Chart:
Copy the script into TradingView’s Pine Editor, click "Add to Chart," and it’ll start drawing FVGs and running the strategy.
2. Customize Settings:
Trend Period (Default: 25): How many bars it looks back to define the trend. Longer periods mean fewer but stronger signals.
Volume Lookback (Default: 20) & Volume Threshold (Default: 1.2): Adjust how it measures "high volume." Increase the threshold for stricter trades.
Stop Loss % (Default: 1.5%) & Take Profit % (Default: 3%): Set how much you’re willing to lose or aim to gain per trade.
Margin Rate % (Default: 8.74%): Webull’s rate for borrowing money—lower it if your account qualifies for a better rate.
Display Mitigation Zones (Default: On): Toggle this to see or hide the gap lines.
Colors: Change the green (bullish) and red (bearish) shades to suit your chart.
3. Backtest It:
Go to the "Strategy Tester" tab in TradingView to see how it performs on past data. It’ll show trades, profits, losses, and Webull fees included.
4. Watch It Work:
Green boxes mean bullish FVGs; red boxes mean bearish FVGs. If volume spikes and the price breaks out, you’ll see trades happen automatically.
What to Expect
Visuals: You’ll see colored boxes for FVGs and optional lines showing where they start. These help you spot key price zones even if you’re not trading.
Trades: It’s selective—only trades when FVGs align with a breakout and volume confirms it. Expect fewer trades but with higher potential.
Risk: The stop loss keeps losses in check, while the take profit aims for a 2:1 reward-to-risk ratio by default (3% gain vs. 1.5% loss).
Costs: Webull’s fees are small but baked into the results, so you’re seeing a realistic picture of profits.
Tips for Users
Test it on a small timeframe (like 5-minute charts) for day trading or a larger one (like daily) for swing trading.
Play with the volume threshold—if you get too few trades, lower it (e.g., 1.1); if too many, raise it (e.g., 1.5).
Watch how price reacts to the mitigation lines—they’re often support or resistance zones traders target.
This strategy is lightweight, focused, and built for traders who like breakouts with a bit of confirmation. It’s not foolproof (no strategy is!), but it gives you a clear way to trade FVGs with some smart filters.

GM+For a Short Trade:
When a bullish candle (close > open) is larger than the previous candle and the MACD histogram for the past three bars is consecutively lower (suggesting weakening upward momentum), the script enters a short position.
For a Long Trade:
When a bearish candle (close < open) is larger (in body size) than the previous candle and the MACD histogram for the past three bars is consecutively higher (suggesting the downward move is losing strength), the script enters a long position.
Position Management:
There are no stop loss or take profit levels. The position is closed only when an opposite signal appears.

[SHORT ONLY] 10 Bar Low Pullback█ STRATEGY DESCRIPTION
The "10 Bar Low Pullback" strategy is a contrarian short trading system designed to capture pullbacks after a new 10‐bar low is made. it identifies a potential short opportunity when the current bar’s low breaks below the lowest low of the previous 10 bars, provided that the bar exhibits strong internal momentum as measured by its IBS value. An optional trend filter further refines entries by requiring that the close is below a 200-period EMA.
█ WHAT IS INTERNAL BAR STRENGTH (IBS)?
Internal Bar Strength (IBS) measures where the closing price falls within the high-low range of a bar. It is calculated as:
ibs = (close - low) / (high - low)
- Low IBS (≤ 0.2): Indicates the close is near the bar's low, suggesting oversold conditions.
- High IBS (≥ 0.8): Indicates the close is near the bar's high, suggesting overbought conditions.
█ SIGNAL GENERATION
1. SHORT ENTRY
A Short Signal is triggered when:
The current bar’s low is below the lowest low of the past X bars (default: 10).
The bar’s IBS is greater than the specified threshold (default: 0.85).
The signal occurs within the defined trading window (between Start Time and End Time).
If the EMA Filter is enabled, the close must be below the 200-period EMA.
2. EXIT CONDITION
An exit Signal is generated when the current close falls below the previous bar’s low (close < low ), indicating a potential bearish reversal and prompting the strategy to close its short position.
█ ADDITIONAL SETTINGS
Lookback Period: Defines the number of bars (default is 10) over which the lowest low is calculated.
IBS Threshold: Sets the minimum required IBS value (default is 0.85) to qualify as a pullback.
Trading Window: Trades are only executed between the user-defined Start Time and End Time.
EMA Filter (Optional): When enabled, short entries are only considered if the current close is below the 200-period EMA, with the EMA period being adjustable (default is 200).
█ PERFORMANCE OVERVIEW
Designed for shorting opportunities, this strategy aims to capture pullbacks following an aggressive 10-bar low break.
It leverages a combination of a lookback low and IBS measurement to identify overextended bullish moves that may revert.
The optional EMA filter helps confirm a bearish market environment by ensuring the price remains under the trend line.
Suitable for use on various assets, including stocks and ETFs, on daily or similar timeframes.
Backtesting and parameter optimization are recommended to tailor the strategy to specific market conditions.

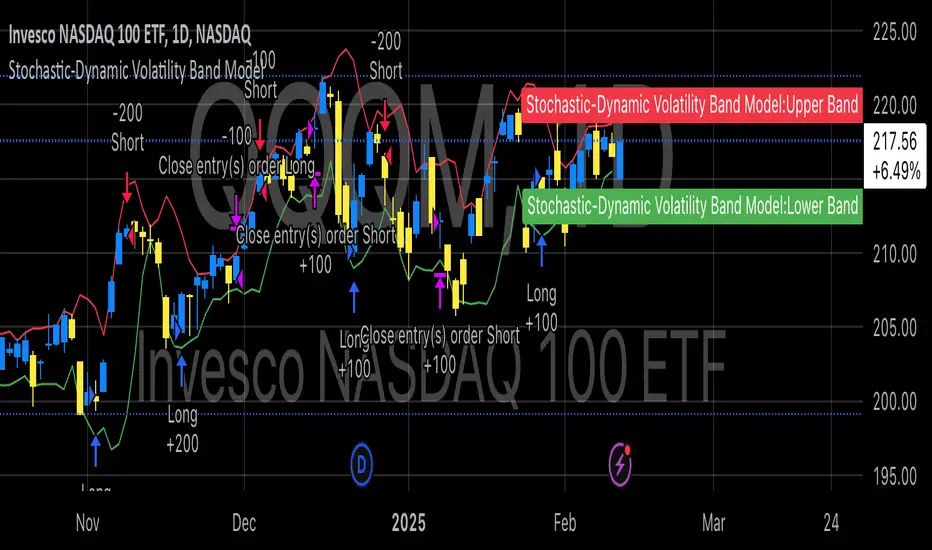
Stochastic-Dynamic Volatility Band ModelThe Stochastic-Dynamic Volatility Band Model is a quantitative trading approach that leverages statistical principles to model market volatility and generate buy and sell signals. The strategy is grounded in the concepts of volatility estimation and dynamic market regimes, where the core idea is to capture price fluctuations through stochastic models and trade around volatility bands.
Volatility Estimation and Band Construction
The volatility bands are constructed using a combination of historical price data and statistical measures, primarily the standard deviation (σ) of price returns, which quantifies the degree of variation in price movements over a specific period. This methodology is based on the classical works of Black-Scholes (1973), which laid the foundation for using volatility as a core component in financial models. Volatility is a crucial determinant of asset pricing and risk, and it plays a pivotal role in this strategy's design.
Entry and Exit Conditions
The entry conditions are based on the price’s relationship with the volatility bands. A long entry is triggered when the price crosses above the lower volatility band, indicating that the market may have been oversold or is experiencing a reversal to the upside. Conversely, a short entry is triggered when the price crosses below the upper volatility band, suggesting overbought conditions or a potential market downturn.
These entry signals are consistent with the mean reversion theory, which asserts that asset prices tend to revert to their long-term average after deviating from it. According to Poterba and Summers (1988), mean reversion occurs due to overreaction to news or temporary disturbances, leading to price corrections.
The exit condition is based on the number of bars that have elapsed since the entry signal. Specifically, positions are closed after a predefined number of bars, typically set to seven bars, reflecting a short-term trading horizon. This exit mechanism is in line with short-term momentum trading strategies discussed in literature, where traders capitalize on price movements within specific timeframes (Jegadeesh & Titman, 1993).
Market Adaptability
One of the key features of this strategy is its dynamic nature, as it adapts to the changing volatility environment. The volatility bands automatically adjust to market conditions, expanding in periods of high volatility and contracting when volatility decreases. This dynamic adjustment helps the strategy remain robust across different market regimes, as it is capable of identifying both trend-following and mean-reverting opportunities.
This dynamic adaptability is supported by the adaptive market hypothesis (Lo, 2004), which posits that market participants evolve their strategies in response to changing market conditions, akin to the adaptive nature of biological systems.
References:
Black, F., & Scholes, M. (1973). The Pricing of Options and Corporate Liabilities. Journal of Political Economy, 81(3), 637-654.
Bollinger, J. (1980). Bollinger on Bollinger Bands. Wiley.
Jegadeesh, N., & Titman, S. (1993). Returns to Buying Winners and Selling Losers: Implications for Stock Market Efficiency. Journal of Finance, 48(1), 65-91.
Lo, A. W. (2004). The Adaptive Markets Hypothesis: Market Efficiency from an Evolutionary Perspective. Journal of Portfolio Management, 30(5), 15-29.
Poterba, J. M., & Summers, L. H. (1988). Mean Reversion in Stock Prices: Evidence and Implications. Journal of Financial Economics, 22(1), 27-59.
Bollinger Bounce Reversal Strategy – Visual EditionOverview:
The Bollinger Bounce Reversal Strategy – Visual Edition is designed to capture potential reversal moves at price extremes—often termed “bounce points”—by using a combination of technical indicators. The strategy integrates Bollinger Bands, MACD, and volume analysis, and it provides rich on‑chart visual cues to help traders understand its signals and conditions. Additionally, the strategy enforces a maximum of 5 trades per day and uses fixed risk management parameters. This publication is intended for educational purposes and offers a systematic, transparent approach that you can further adjust to fit your market or risk profile.
How It Works:
Bollinger Bands:
A 20‑period simple moving average (SMA) and a user‑defined standard deviation multiplier (default 2.0) are used to calculate the Bollinger Bands.
When the price reaches or crosses these bands (i.e. falls below the lower band or rises above the upper band), it suggests that the price is in an extreme, potentially oversold or overbought, state.
MACD Filter:
The MACD (calculated with standard lengths, e.g. 12, 26, 9) provides momentum information.
For a bullish (long) signal, the MACD line should be above its signal line; for a bearish (short) signal, the MACD line should be below.
Volume Confirmation:
The strategy uses a 20‑period volume moving average to determine if current volume is strong enough to validate a signal.
A signal is confirmed only if the current volume is at or above a specified multiple (by default, 1.0×) of this moving average, ensuring that the move is supported by increased market participation.
Visual Cues:
Bollinger Bands and Fill: The basis (SMA), upper, and lower Bollinger Bands are plotted, and the area between the upper and lower bands is filled with a semi‑transparent color.
Signal Markers: When a long or short signal is generated, corresponding markers (labels) appear on the chart.
Background Coloring: The chart’s background changes color (green for long signals and red for short signals) on the bars where signals occur.
Information Table: An on‑chart table displays key indicator values (MACD, signal line, volume, average volume) and the number of trades executed that day.
Entry Conditions:
Long Entry:
A long trade is triggered when the previous bar’s close is below the lower Bollinger Band and the current bar’s close crosses above it, combined with a bullish MACD condition and strong volume.
Short Entry:
A short trade is triggered when the previous bar’s close is above the upper Bollinger Band and the current bar’s close crosses below it, with a bearish MACD condition and high volume.
Risk Management:
Daily Trade Limit: The strategy restricts trading to no more than 5 trades per day.
Stop-Loss and Take-Profit:
For each position, a stop loss is set at a fixed percentage away from the entry price (typically 2%), and a take profit is set to target a 1:2 risk-reward ratio (typically 4% from the entry price).
Backtesting Setup:
Initial Capital: $10,000
Commission: 0.1% per trade
Slippage: 1 tick per bar
These realistic parameters help ensure that backtesting results reflect the conditions of an average trader.
Disclaimer:
Past performance is not indicative of future results. This strategy is experimental and provided solely for educational purposes. It is essential to backtest extensively and paper trade before any live deployment. All risk management practices are advisory, and you should adjust parameters to suit your own trading style and risk tolerance.
Conclusion:
By combining Bollinger Bands, MACD, and volume analysis, the Bollinger Bounce Reversal Strategy – Visual Edition provides a clear, systematic method to identify potential reversal opportunities at price extremes. The added visual cues help traders quickly interpret signals and assess market conditions, while strict risk management and a daily trade cap help keep trading disciplined. Adjust and refine the settings as needed to better suit your specific market and risk profile.

GOLD Volume-Based Entry StrategyShort Description:
This script identifies potential long entries by detecting two consecutive bars with above-average volume and bullish price action. When these conditions are met, a trade is entered, and an optional profit target is set based on user input. This strategy can help highlight momentum-driven breakouts or trend continuations triggered by a surge in buying volume.
How It Works
Volume Moving Average
A simple moving average of volume (vol_ma) is calculated over a user-defined period (default: 20 bars). This helps us distinguish when volume is above or below recent averages.
Consecutive Green Volume Bars
First bar: Must be bullish (close > open) and have volume above the volume MA.
Second bar: Must also be bullish, with volume above the volume MA and higher than the first bar’s volume.
When these two bars appear in sequence, we interpret it as strong buying pressure that could drive price higher.
Entry & Profit Target
Upon detecting these two consecutive bullish bars, the script places a long entry.
A profit target is set at current price plus a user-defined fixed amount (default: 5 USD).
You can adjust this target, or you can add a stop-loss in the script to manage risk further.
Visual Cues
Buy Signal Marker appears on the chart when the second bar confirms the signal.
Green Volume Columns highlight the bars that fulfill the criteria, providing a quick visual confirmation of high-volume bullish bars.
Works fine on 1M-2M-5M-15M-30M. Do not use it on higher TF. Due the lack of historical data on lower TF, the backtest result is limited.

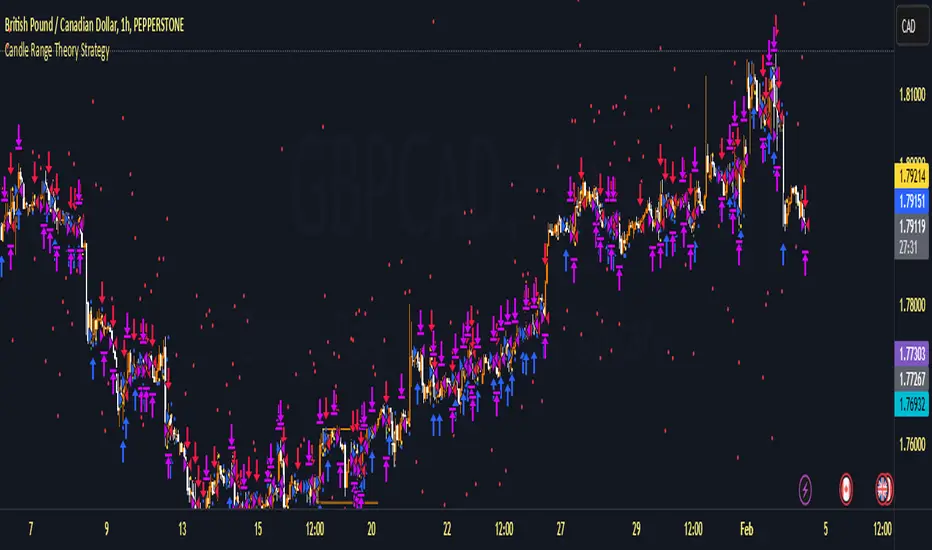
Candle Range Theory StrategyCandle Range Theory StrategyCandle Range Theory Strategy delves into the intricacies of price action analysis, focusing on the behavior of candlestick patterns within specific ranges. Traders employing this strategy aim to identify key support and resistance levels by analyzing the high and low points of significant candlesticks. The core principle lies in understanding that the range of a candle—defined by its opening, closing, high, and low prices—provides valuable insight into market sentiment and potential future movements.
To implement the Candle Range Theory Strategy effectively, one must first recognize the importance of different candle sizes. A long-bodied candle suggests strong momentum, pointing to a bullish or bearish bias, while a small-bodied candle indicates indecision or consolidation, often signaling potential reversals or breakouts. By plotting these candlesticks over a defined time frame, traders can ascertain whether the market is trending or range-bound.
Additionally, traders should consider the context in which these candles form. Analysis of the preceding price action can reveal whether current ranges are extensions of existing trends or indications of market fatigue. In particular, look for patterns such as engulfing candles, pin bars, or inside bars, as they often foreshadow forthcoming price fluctuations.
Moreover, combining the Candle Range Theory with other technical indicators, like moving averages or Fibonacci retracements, can offer a more comprehensive view of potential entry and exit points. By aligning candle patterns with broader market dynamics, traders can optimize their strategies, enhancing their probability of success while minimizing risk.
Lastly, maintaining a disciplined approach is crucial. Setting precise stop-loss and take-profit levels grounded in candle ranges can safeguard one's capital. Adhering to this framework allows traders to navigate the complexities of the market with greater confidence, ultimately leading to more informed and successful trading decisions. Embracing the nuances of Candle Range Theory not only sharpens analytical skills but also enriches one’s trading repertoire, paving the way for sustained profitability in the dynamic world of forex and equities.
Delta SMA 1-Year High/Low Strategy### Summary:
This Pine Script code implements a trading strategy based on the **Delta SMA (Simple Moving Average)** of buy and sell volumes over a 1-year lookback period. The strategy identifies potential buy and sell signals by analyzing the relationship between the Delta SMA and its historical high/low thresholds. Key features include:
1. **Delta Calculation**:
- The Delta is calculated as the difference between buy volume (when close > open) and sell volume (when close < open).
- A 14-period SMA is applied to the Delta to smooth the data.
2. **1-Year High/Low Thresholds**:
- The strategy calculates the 1-year high and low of the Delta SMA.
- Buy and sell conditions are derived from thresholds set at 70% of the 1-year low and 90% and 50% of the 1-year high, respectively.
3. **Buy Condition**:
- A buy signal is triggered when the Delta SMA crosses above 0 after being below 70% of the 1-year low.
4. **Sell Condition**:
- A sell signal is triggered when the Delta SMA drops below 60% of the 1-year high after crossing above 90% of the 1-year high.
5. **Visualization**:
- The Delta SMA and its thresholds are plotted on the chart for easy monitoring.
- Optional buy/sell signals can be plotted as labels on the chart.
This strategy is designed to capture trends in volume-based momentum over a long-term horizon, making it suitable for swing or position trading.

SMA + RSI + Volume + ATR StrategySMA + RSI + Volume + ATR Strategy
1. Indicators Used:
SMA (Simple Moving Average): This is a trend-following indicator that calculates the average price of a security over a specified period (50 periods in this case). It's used to identify the overall trend of the market.
RSI (Relative Strength Index): This measures the speed and change of price movements. It tells us if the market is overbought (too high) or oversold (too low). Overbought is above 70 and oversold is below 30.
Volume: This is the amount of trading activity. A higher volume often indicates strong interest in a particular price move.
ATR (Average True Range): This measures volatility, or how much the price is moving in a given period. It helps us adjust stop losses and take profits based on market volatility.
2. Conditions for Entering Trades:
Buy Signal (Green Up Arrow):
Price is above the 50-period SMA (indicating an uptrend).
RSI is below 30 (indicating the market might be oversold or undervalued, signaling a potential reversal).
Current volume is higher than average volume (indicating strong interest in the move).
ATR is increasing (indicating higher volatility, suggesting that the market might be ready for a move).
Sell Signal (Red Down Arrow):
Price is below the 50-period SMA (indicating a downtrend).
RSI is above 70 (indicating the market might be overbought or overvalued, signaling a potential reversal).
Current volume is higher than average volume (indicating strong interest in the move).
ATR is increasing (indicating higher volatility, suggesting that the market might be ready for a move).
3. Take Profit & Stop Loss:
Take Profit: When a trade is made, the strategy will set a target price at a certain percentage above or below the entry price (1.5% in this case) to automatically exit the trade once that target is hit.
Stop Loss: If the price goes against the position, a stop loss is set at a percentage below or above the entry price (0.5% in this case) to limit losses.
4. Execution of Trades:
When the buy condition is met, the strategy will enter a long position (buying).
When the sell condition is met, the strategy will enter a short position (selling).
5. Visual Representation:
Green Up Arrow: Appears on the chart when the buy condition is met.
Red Down Arrow: Appears on the chart when the sell condition is met.
These arrows help you see at a glance when the strategy suggests you should buy or sell.
In Summary:
This strategy uses a combination of trend-following (SMA), momentum (RSI), volume, and volatility (ATR) to decide when to buy or sell a stock. It looks for opportunities when the market is either oversold (buy signal) or overbought (sell signal) and makes sure there’s enough volume and volatility to back up the move. It also includes take-profit and stop-loss levels to manage risk.

Candle Emotion Index (CEI) StrategyThe Candle Emotion Index (CEI) Strategy is an innovative sentiment-based trading approach designed to help traders identify and capitalize on market psychology. By analyzing candlestick patterns and combining them into a unified metric, the CEI Strategy provides clear entry and exit signals while dynamically managing risk. This strategy is ideal for traders looking to leverage market sentiment to identify high-probability trading opportunities.
How It Works
The CEI Strategy is built around three core oscillators that reflect key emotional states in the market:
Indecision Oscillator . Measures market uncertainty using patterns like Doji and Spinning Tops. High values indicate hesitation, signaling potential turning points.
Fear Oscillator . Tracks bearish sentiment through patterns like Shooting Star, Hanging Man, and Bearish Engulfing. Helps identify moments of intense selling pressure.
Greed Oscillator . Detects bullish sentiment using patterns like Marubozu, Hammer, Bullish Engulfing, and Three White Soldiers. Highlights periods of strong buying interest.
These oscillators are averaged into the Candle Emotion Index (CEI):
CEI = (Indecision + Fear + Greed) / 3
This single value quantifies overall market sentiment and drives the strategy’s trading decisions.
Key Features
Sentiment-Based Trading Signals . Long Entry: Triggered when the CEI crosses above a lower threshold (e.g., 0.1), indicating increasing bullish sentiment. Short Entry: Triggered when the CEI crosses above a higher threshold (e.g., 0.2), signaling rising bearish sentiment.
Volume Confirmation . Trades are validated only if volume exceeds a user-defined multiplier of the average volume over the lookback period. This ensures entries are backed by significant market activity.
Break-Even Recovery Mechanism . If a trade moves into a loss, the strategy attempts to recover to break-even instead of immediately exiting at a loss. This feature provides flexibility, allowing the market to recover while maintaining disciplined risk management.
Dynamic Risk Management . Maximum Holding Period: Trades are closed after a user-defined number of candles to avoid overexposure to prolonged uncertainty. Profit-Taking Conditions: Positions are exited when favorable price moves are confirmed by increased volume, locking in gains. Loss Threshold: Trades are exited early if the price moves unfavorably beyond a set percentage of the entry price, limiting potential losses.
Cooldown Period . After a trade is closed, a cooldown period prevents immediate re-entry, reducing overtrading and improving signal quality.
Why Use This Strategy?
The CEI Strategy combines advanced sentiment analysis with robust trade management, making it a powerful tool for traders seeking to understand market psychology and identify high-probability setups. Its unique features, such as the break-even recovery mechanism and volume confirmation, add an extra layer of discipline and reliability to trading decisions.
Best Practices
Combine with Other Indicators . Use trend-following tools (e.g., moving averages, ADX) and momentum oscillators (e.g., RSI, MACD) to confirm signals.
Align with Key Levels . Incorporate support and resistance levels for refined entries and exits.
Multi-Market Compatibility . Apply this strategy to forex, crypto, stocks, or any asset class with strong volume and price action.

Sunil 2 Bar Breakout StrategyDetailed Explanation of the Sunil 2 Bar Breakout Strategy
Introduction
The Sunil 2 Bar Breakout Strategy is a simple yet effective price-action-based approach designed to identify breakout opportunities in financial markets. This strategy analyzes the movement of the last three candles to detect momentum and initiates trades in the direction of the breakout. It is equipped with a built-in stop-loss mechanism to protect capital, making it suitable for traders looking for a structured and disciplined trading system.
The strategy works well across different timeframes and asset classes, including indices, stocks, forex, and cryptocurrencies. Its versatility makes it ideal for both intraday and swing trading.
Core Concept
The strategy revolves around two primary conditions: breakout identification and risk management.
Breakout Identification:
Long Trade Setup: The strategy identifies bullish breakouts when:
The current candle's closing price is higher than the previous candle's closing price.
The high of the previous candle is greater than the highs of the two candles before it.
Short Trade Setup: The strategy identifies bearish breakouts when:
The current candle's closing price is lower than the previous candle's closing price.
The low of the previous candle is lower than the lows of the two candles before it.
Risk Management:
Stop-Loss: For each trade, a stop-loss is automatically set:
For long trades, the stop-loss is set to the low of the previous candle.
For short trades, the stop-loss is set to the high of the previous candle.
This ensures that losses are minimized if the breakout fails.
Exit Logic:
The trade is closed automatically when the stop-loss is hit.
This approach maintains discipline and prevents emotional trading.
Strategy Workflow
Entry Criteria:
Long Entry: A long trade is triggered when:
The current close is greater than the previous close.
The high of the previous candle exceeds the highs of the two candles before it.
Short Entry: A short trade is triggered when:
The current close is less than the previous close.
The low of the previous candle is below the lows of the two candles before it.
Stop-Loss Placement:
For long trades, the stop-loss is set at the low of the previous candle.
For short trades, the stop-loss is set at the high of the previous candle.
Trade Management:
Trades are exited automatically if the stop-loss level is hit.
The strategy avoids re-entering trades until new breakout conditions are met.
Default Settings
Position Sizing:
The default position size is set to 1% of the account equity. This ensures proper risk management and prevents overexposure to the market.
Stop-Loss:
Stop-loss levels are automatically calculated based on the previous candle’s high or low.
Timeframes:
The strategy is versatile and works across multiple timeframes. However, it is recommended to test it on 15-minute, 1-hour, and daily charts for optimal performance.
Key Features
Automated Trade Execution:
The strategy handles both trade entry and exit automatically based on pre-defined conditions.
Built-In Risk Management:
The automatic stop-loss placement ensures losses are minimized on failed breakouts.
Works Across Markets:
The strategy is compatible with a wide range of instruments, including indices, stocks, forex, and cryptocurrencies.
Clear Signals:
Entry and exit points are straightforward and based on objective conditions, reducing ambiguity.
Versatility:
Can be used for both day trading and swing trading, depending on the chosen timeframe.
Best Practices for Using This Strategy
Backtesting:
Test the strategy on your chosen instrument and timeframe using TradingView's Strategy Tester to evaluate its performance.
Market Conditions:
The strategy performs best in trending markets or during periods of high volatility. Avoid using it in range-bound or choppy markets.
Position Sizing:
Use the default position size (1% of equity) or adjust based on your risk tolerance and account size.
Instrument Selection:
Focus on instruments with good liquidity and volatility, such as indices (e.g., NIFTY, BANKNIFTY), forex pairs, or major cryptocurrencies (e.g., Bitcoin, Ethereum).
Potential Enhancements
To make the strategy even more robust, consider adding the following optional features:
Stop-Loss Multiplier:
Allow users to customize the stop-loss distance as a multiple of the default level (e.g., 1.5x the low or high of the previous candle).
Take-Profit Levels:
Add user-defined take-profit levels, such as a fixed risk-reward ratio (e.g., 1:2).
Time Filter:
Include an option to restrict trading to specific market hours (e.g., avoid low-liquidity times).
Conclusion
The Sunil 2 Bar Breakout Strategy is an excellent tool for traders looking to capitalize on breakout opportunities while maintaining disciplined risk management. Its simplicity, combined with its effectiveness, makes it suitable for traders of all experience levels. By adhering to the clearly defined rules, traders can achieve consistent results while avoiding emotional trading decisions.
This strategy is a reliable addition to any trader’s toolbox and is designed to work seamlessly across different market conditions and instruments.

Multi-Band Comparison Strategy (CRYPTO)Multi-Band Comparison Strategy (CRYPTO)
Optimized for Cryptocurrency Trading
This Pine Script strategy is built from the ground up for traders who want to take advantage of cryptocurrency volatility using a confluence of advanced statistical bands. The strategy layers Bollinger Bands, Quantile Bands, and a unique Power-Law Band to map out crucial support/resistance zones. It then focuses on a Trigger Line—the lower standard deviation band of the upper quantile—to pinpoint precise entry and exit signals.
Key Features
Bollinger Band Overlay
The upper Bollinger Band visually shifts to yellow when price exceeds it, turning black otherwise. This offers a straightforward way to gauge heightened momentum or potential market slowdowns.
Quantile & Power-Law Integration
The script calculates upper and lower quantile bands to assess probabilistic price extremes.
A Power-Law Band is also available to measure historically significant return levels, providing further insight into overbought or oversold conditions in fast-moving crypto markets.
Standard Deviation Trigger
The lower standard deviation band of the upper quantile acts as the strategy’s trigger. If price consistently holds above this line, the strategy interprets it as a strong bullish signal (“green” zone). Conversely, dipping below indicates a “red” zone, signaling potential reversals or exits.
Consecutive Bar Confirmation
To reduce choppy signals, you can fine-tune the number of consecutive bars required to confirm an entry or exit. This helps filter out noise and false breaks—critical in the often-volatile crypto realm.
Adaptive for Multiple Timeframes
Whether you’re scalping on a 5-minute chart or swing trading on daily candles, the strategy’s flexible confirmation and overlay options cater to different market conditions and trading styles.
Complete Plot Customization
Easily toggle visibility of each band or line—Bollinger, Quantile, Power-Law, and more.
Built-in Simple and Exponential Moving Averages can be enabled to further contextualize market trends.
Why It Excels at Crypto
Cryptocurrencies are known for rapid price swings, and this strategy addresses exactly that by combining multiple statistical methods. The quantile-based confirmation reduces noise, while Bollinger and Power-Law bands help highlight breakout regions in trending markets. Traders have reported that it works seamlessly across various coins and tokens, adapting its triggers to each asset’s unique volatility profile.
Give it a try on your favorite cryptocurrency pairs. With advanced data handling, crisp visual cues, and adjustable confirmation logic, the Multi-Band Comparison Strategy provides a robust framework to capture profitable moves and mitigate risk in the ever-evolving crypto space.
Sunil High-Frequency Strategy with Simple MACD & RSISunil High-Frequency Strategy with Simple MACD & RSI
This high-frequency trading strategy uses a combination of MACD and RSI to identify quick market opportunities. By leveraging these indicators, combined with dynamic risk management using ATR, it aims to capture small but frequent price movements while ensuring tight control over risk.
Key Features:
Indicators Used:
MACD (Moving Average Convergence Divergence): The strategy uses a shorter MACD configuration (Fast Length of 6 and Slow Length of 12) to capture quick price momentum shifts. A MACD crossover above the signal line triggers a buy signal, while a crossover below the signal line triggers a sell signal.
RSI (Relative Strength Index): A shorter RSI length of 7 is used to gauge overbought and oversold market conditions. The strategy looks for RSI confirmation, with a long trade initiated when RSI is below the overbought level (70) and a short trade initiated when RSI is above the oversold level (30).
Risk Management:
Dynamic Stop Loss and Take Profit: The strategy uses ATR (Average True Range) to calculate dynamic stop loss and take profit levels based on market volatility.
Stop Loss is set at 0.5x ATR to limit risk.
Take Profit is set at 1.5x ATR to capture reasonable price moves.
Trailing Stop: As the market moves in the strategy’s favor, the position is protected by a trailing stop set at 0.5x ATR, allowing the strategy to lock in profits as the price moves further.
Entry & Exit Signals:
Long Entry: Triggered when the MACD crosses above the signal line (bullish crossover) and RSI is below the overbought level (70).
Short Entry: Triggered when the MACD crosses below the signal line (bearish crossover) and RSI is above the oversold level (30).
Exit Conditions: The strategy exits long or short positions based on the stop loss, take profit, or trailing stop activation.
Frequent Trades:
This strategy is designed for high-frequency trading, with trade signals occurring frequently as the MACD and RSI indicators react quickly to price movements. It works best on lower timeframes such as 1-minute, 5-minute, or 15-minute charts, but can be adjusted for different timeframes based on the asset’s volatility.
Customizable Parameters:
MACD Settings: Adjust the Fast Length, Slow Length, and Signal Length to tune the MACD’s sensitivity.
RSI Settings: Customize the RSI Length, Overbought, and Oversold levels to better match your trading style.
ATR Settings: Modify the ATR Length and multipliers for Stop Loss, Take Profit, and Trailing Stop to optimize risk management according to market volatility.
Important Notes:
Market Conditions: This strategy is designed to capture smaller, quicker moves in trending markets. It may not perform well during choppy or sideways markets.
Optimizing for Asset Volatility: Adjust the ATR multipliers based on the asset’s volatility to suit the risk-reward profile that fits your trading goals.
Backtesting: It's recommended to backtest the strategy on different assets and timeframes to ensure optimal performance.
Summary:
The Sunil High-Frequency Strategy leverages a simple combination of MACD and RSI with dynamic risk management (using ATR) to trade small but frequent price movements. The strategy ensures tight stop losses and reasonable take profits, with trailing stops to lock in profits as the price moves in favor of the trade. It is ideal for scalping or intraday trading on lower timeframes, aiming for quick entries and exits with controlled risk.

Gold Trade Setup Strategy
Title: Profitable Gold Setup Strategy with Adaptive Moving Average & Supertrend
Introduction:
This trading strategy for Gold (XAU/USD) combines the Adaptive Moving Average (AMA) and Supertrend, tailored for high-probability setups during specific trading hours. The AMA identifies the trend, while the Supertrend confirms entry and exit points. The strategy is optimized for swing and intraday traders looking to capitalize on Gold’s price movements with precise trade timing.
Strategy Components:
1. Adaptive Moving Average (AMA):
• Reacts dynamically to market conditions, filtering noise in choppy markets.
• Serves as the primary trend indicator.
2. Supertrend:
• Confirms entry signals with clear buy and sell levels.
• Acts as a trailing stop-loss to protect profits.
Trading Rules:
Trading Hours:
• Only take trades between 8:30 AM and 10:30 PM IST.
• Avoid trading outside these hours to reduce noise and low-volume setups.
Buy Setup:
1. Trend Confirmation: The Adaptive Moving Average (AMA) must be green.
2. Signal Confirmation: The Supertrend should turn green after the AMA is green.
3. Trigger: Take the trade when the high of the trigger candle (the candle that turned Supertrend green) is broken.
Sell Setup (Optional if included):
• Reverse the rules for a short trade: AMA and Supertrend should both indicate bearish conditions (red), and take the trade when the low of the trigger candle is broken.
Stop-Loss and Targets:
• Place the stop-loss at the low of the trigger candle for long trades.
• Set a 1:2 risk-reward ratio or use the Supertrend line as a trailing stop-loss.
Timeframes:
• Recommended timeframes: 1H, 4H, or Daily for swing trading.
• For intraday trading, use 15-minute or 30-minute charts.
Why This Strategy Works:
• Combines trend-following (AMA) with momentum-based entries (Supertrend).
• Focused trading hours filter out low-probability setups.
• Provides precise entry, stop-loss, and target levels for disciplined trading.
Conclusion:
This Gold Setup Strategy is designed for traders seeking a structured approach to trading Gold. Follow the rules strictly, backtest the strategy extensively, and share your results. Let’s master the Gold market together!
Tags: #Gold #XAUUSD #SwingTrading #Intraday #Supertrend #AMA #TechnicalAnalysis #GoldStrategy
