Institution Accumulation/DistributionLeveraging the Williams%R oscillator, the script has been optimized to pick out key turning point in the market specifically at Resistance (Overbought) or Support (Oversold)
The algo has been programmed to print both buy and sell alerts at extremes/when conditions flip eg a long position will be closed simultaneously opening a short position above resistance.
Best used as a scalping tool targeting 30m and below works well with currency pairs
In den Scripts nach "momentum" suchen

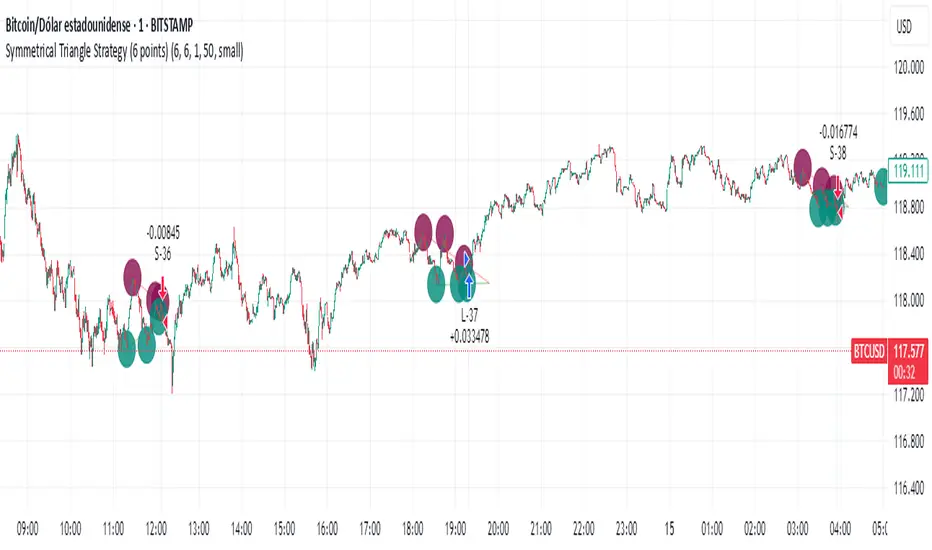
Simple Symmetrical Triangle Strategy (6 points)Overview
This strategy identifies triangle patterns formed by a series of key high and low price points. A trade is triggered when the price breaks out from the pattern's final confirmation points: a buy signal occurs on a close above the last high point, and a sell signal on a close below the last low point. To ensure relevance, any pattern that doesn't break out within 10 bars is automatically discarded.
This helps filter out patterns that lose momentum and focuses only on the most imminent breakouts.
How It Works
1. Pattern Detection: The script continuously scans for a sequence of three declining highs (points H1, H2, H3) and three rising lows (points L1, L2, L3) to form a triangle.
2. Entry Logic: The logic is straightforward and based on breaking the last confirmed pivot:
* Long Entry: A buy order is executed if the price closes above the level of the last high (H3).
* Short Entry: A sell order is executed if the price closes below the level of the last low (L3).
3. Pattern Expiration: A triangle only remains "active" for 10 bars after its formation. If a breakout doesn't occur within this window, the pattern is removed from analysis, avoiding trades on prolonged, unresolved consolidations.
Key Features
* Automatic Detection: Identifies and draws triangles for you.
* Simple Breakout Logic: Easy to understand, trades by following the price action.
* Time Filter: Its main advantage is discarding patterns that do not resolve quickly.
* Customizable: You can adjust the sensitivity of the pivot detection in the settings.
Important Disclaimer
This strategy is designed as an entry system and DOES NOT INCLUDE A STOP LOSS OR TAKE PROFIT.
Automation Ready
Want to automate this or ANY strategy on your broker or MetaTrader (MT4/MT5) without keeping your computer on or needing a VPS? You can use WebhookTrade.
Open Range Breakout Strategy With Multi TakeProfitHello everyone,
For a while, I’ve been wanting to develop new scripts, but I couldn’t decide what to create. Eventually, I came up with the idea of coding traditional and well-known trading strategies—while adding modern features such as multi–take profit options. For the first strategy in this series, I chose the Open Range Strategy .
For those unfamiliar with it, the Open Range Strategy is a trading approach where you define a specific time period at the beginning of a trading session—such as the first 15 minutes, 30 minutes, or 1 hour—and mark the highest and lowest prices within that range. These levels then act as reference points for potential breakouts: if the price breaks above the range, it may signal a long entry; if it breaks below, it may indicate a short entry. This method is popular among day traders for capturing early momentum in the market.
Since this strategy is generally used as an intraday strategy , I added a Trade Session feature. This allows you to define the exact time window during which trades can be opened. Once the session ends, all positions are automatically closed, ensuring trades remain within your chosen intraday period.
Even though it’s a relatively simple concept, I’ve come across many different variations of it. That’s why I created a highly customizable project. Under the Session Settings, you can select the time window you want to define as your range. Whether it’s the first 15-minute candle or the entire first hour, the choice is entirely yours.
For stop-loss placement, there are two different options:
Middle of the Range – The stop loss is placed at the midpoint between the high and low of the defined range, offering a balanced buffer for both bullish and bearish setups.
Top/Bottom of the Range – The stop loss is placed just beyond the range’s high for short trades or just below the range’s low for long trades, providing a more conservative risk approach.
I’ve always been a big fan of the multi take-profit feature, so I added two different take-profit targets to this project. Take profits are calculated based on a Risk-to-Reward Ratio, which you can adjust in the settings. You can also set different position sizes for each target, allowing you to scale out of trades in a way that suits your strategy.
The result is a flexible, user-friendly strategy script that brings together a classic approach with modern risk management tools—ready to be tailored to your trading style

Market Open Impulse [LuciTech]Market Open Impulse Strategy
The Market Open Impulse Strategy is designed to capture significant price movements that occur at market open (2:30 PM UK time). This strategy identifies impulsive candles with high volatility and enters trades based on the direction and strength of the initial market reaction.
How It Works:
The strategy activates exclusively at 2:30 PM UK time during market open sessions. It uses ATR-based volatility filtering to identify impulsive candles that exceed a configurable multiplier (default 1.5x ATR). Long entries are triggered when an impulsive candle closes above its midpoint and above the opening price, while short entries occur when an impulsive candle closes below its midpoint and below the opening price.
Risk management is handled through precise stop loss placement at the opposite extreme of the impulse candle (high for short positions, low for long positions). Take profit levels are calculated using a configurable risk-reward ratio with a default setting of 3:1. Position sizing is automatically calculated based on the percentage risk per trade, and an optional breakeven feature can move the stop loss to the entry price at specified profit levels.
The strategy incorporates time-based filtering to ensure trades only occur during the specified market open window. Visual indicators highlight qualifying impulsive candles and plot all entry and exit levels for clear trade management. The system offers flexible risk management with customizable risk percentage, risk-reward ratios, and breakeven settings, along with multiple stop loss calculation methods including both ATR-based and candle-based options.
Key Parameters:
Market open timing is fully configurable through hour and minute settings for strategy activation. The impulse ATR multiple sets the minimum volatility threshold required for trade qualification, with visual highlighting available for qualifying setups. Risk management parameters include the percentage of account equity to risk per trade, target profit multiples relative to initial risk, and the profit level threshold for breakeven stop loss adjustment. Users can choose between ATR-based or candle-based stop loss calculation methods and adjust technical parameters for volatility calculation including ATR length and smoothing methods.
Applications:
This strategy is particularly effective for trading market open volatility and momentum, capturing institutional order flow during key timing windows, executing short-term swing trades on significant price impulses, and trading markets with predictable opening patterns and consistent volatility characteristics.

Engulfing & Pin Bar Breakout StrategyOverview
This strategy automates a classic, powerful trading methodology based on identifying key candlestick reversal patterns and trading the subsequent price breakout. It is designed to be a complete, "set-and-go" system with built-in risk and position size management.
The core logic operates on the 1-Hour timeframe, scanning for four distinct high-probability reversal signals: two bullish and two bearish. An entry is only triggered when the market confirms the signal by breaking a key price level, aiming to capture momentum following a potential shift in market sentiment.
The Strategy Logic
The system is composed of two distinct modules: Bullish (Long) and Bearish (Short).
🐂 Bullish (Long) Setup
The script initiates a long trade based on the following strict criteria:
Signal: Identifies either a Hammer or a Bullish Engulfing pattern. These patterns often indicate that sellers are losing control and buyers are stepping in.
Confirmation: Waits for the very next candle after the signal.
Entry Trigger: A long position is automatically opened as soon as the price breaks above the high of the signal candle.
Stop Loss: Immediately set just below the low of the signal candle.
Take Profit: A fixed target is placed at a 1:5 Risk/Reward Ratio.
🐻 Bearish (Short) Setup
The script initiates a short trade based on the following strict criteria:
Signal: Identifies either a Shooting Star or a Bearish Engulfing pattern. These patterns suggest buying pressure is fading and sellers are taking over.
Confirmation: Waits for the very next candle after the signal.
Entry Trigger: A short position is automatically opened as soon as the price breaks below the low of the signal candle.
Stop Loss: Immediately set just above the high of the signal candle.
Take Profit: A fixed target is placed at a 1:4 Risk/Reward Ratio.
Key Feature: Automated Risk Management
This strategy is designed for disciplined trading. You do not need to calculate position sizes manually.
Fixed Risk: The script automatically calculates the correct position size to risk exactly 2% of your total account equity on every single trade.
Dynamic Sizing: The position size will adjust based on the distance between your entry price and your stop loss for each specific setup, ensuring a consistent risk profile.
How To Use
Apply the script to your chosen chart (e.g., BTC/USD).
Crucially, set your chart's timeframe to 1-Hour (H1). The strategy is specifically calibrated for this interval.
Navigate to the "Strategy Tester" tab below your chart to view backtest results, including net profit, win rate, and individual trades.
Disclaimer: This script is provided for educational and informational purposes only. It is not financial advice. All trading involves substantial risk, and past performance is not indicative of future results. Please use this tool responsibly and at your own risk.

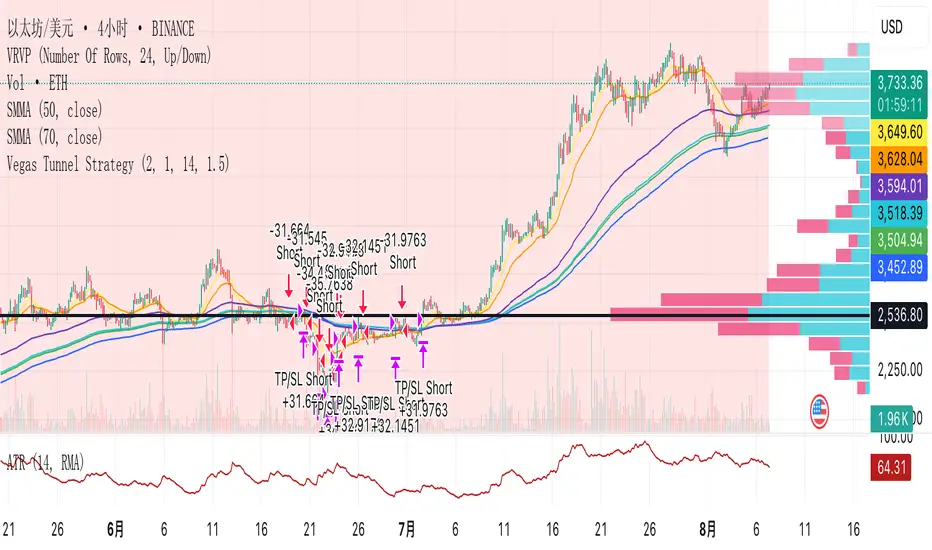
Vegas Tunnel StrategyVegas Tunnel Strategy is a trend-following breakout system based on exponential moving averages (EMAs). It uses a "tunnel" formed by the 144 EMA and 169 EMA to identify the market's long-term trend direction. Entry signals are generated when a shorter-term EMA (12 EMA) breaks above or below this tunnel, confirming momentum alignment.
Long Setup: Price and EMA12 are above the tunnel (EMA144 < EMA169); entry on pullback near the tunnel.
Short Setup: Price and EMA12 are below the tunnel (EMA144 > EMA169); entry on rebound near the tunnel.
Exit Rules: Fixed stop loss below/above the tunnel or based on ATR; take profit at 1.5–2× the risk.
This strategy works best on 4H or daily charts and is suitable for trending assets like FX pairs, gold, oil, or indices.
[Stratégia] VWAP Mean Magnet v9 (Simple Alert)This strategy is specifically designed for a ranging (sideways-moving) Bitcoin market.
A trade is only opened and signaled on the chart if all three of the following conditions are met simultaneously at the close of a candle:
Zone Entry
The price must cross into the signal zone: the red band for a Short (sell) position, or the green band for a Long (buy) position.
RSI Confirmation
The RSI indicator must also confirm the signal. For a Short, it must go above 65 (overbought condition). For a Long, it must fall below 25 (oversold condition).
Volume Filter
The volume on the entry candle cannot be excessively high. This safety filter is designed to prevent trades during risky, high-momentum breakouts.

VWAP-RSI Scalper FINAL v1Description
This script implements a robust, battle-tested intraday scalping strategy designed for prop firm challenges, funded trader programs, and serious futures scalpers.
It combines VWAP, RSI, EMA trend, and ATR-based risk management to capture high-probability mean reversion and momentum moves during the most liquid hours of the trading day.
Core Logic
RSI (Relative Strength Index):
Trades are triggered when the RSI is either oversold or overbought using a short lookback (default: 3). This ensures only the strongest intraday reversals or exhaustion moves are considered.
VWAP Filter:
Longs are only taken above VWAP, shorts only below VWAP, aligning trades with the session’s dominant bias.
EMA Filter:
Additional trend quality filter—longs require price above EMA, shorts below EMA.
Session Control:
Only trades between user-defined session hours (default: US cash session), eliminating overnight/illiquid action.
ATR-based Dynamic Stops & Targets:
Every trade uses a stop loss at 1x ATR and a take profit at 2x ATR for a positive risk/reward ratio.
Max Trades Per Day:
Prevents overtrading and controls risk exposure (default: 3).
Performance (Sample Backtest)
Profit Factor: 1.37+ (prop-firm quality)
Drawdown: <1% (very conservative risk)
Win Rate: 37–48% (RR > 1, so high edge)
Consistency: Smooth, steady equity curve over hundreds of trades.
Best For:
ES/NQ/CL/GC intraday traders
Prop firm evaluation challenges (Tradeify, Topstep, Apex, etc.)
Anyone needing robust, no-nonsense systematic edge for futures or indices.
How to Use & Tune
Apply to 3min, 5min, or 15min charts of liquid futures or indices.
Change parameters in the settings panel to suit your asset, volatility, or session hours.
Use “Strategy Tester” to validate P&L, win rate, and drawdown.
How to Optimize
Raise/lower RSI length or bands to make signals more/less frequent.
Adjust stop/target multiples for your preferred risk/reward profile.
Change session hours to match your broker or market.
Disclaimer
This is not financial advice. Use on a demo or sim account first. Results will vary by market, slippage, and execution speed. Past performance does not guarantee future results.
If you find this useful, please give it a like, follow for more strategies, and comment your results or questions!
Good luck and safe trading!

AUD/USD 1-Min Scalping Strategy with LabelsHere’s a complete TradingView Pine Script v5 for the 1-minute AUD/USD scalping strategy we just discussed. This strategy uses:
EMA 13 and EMA 26 for trend filtering
Bollinger Bands for volatility extremes
RSI (4) for momentum confirmation

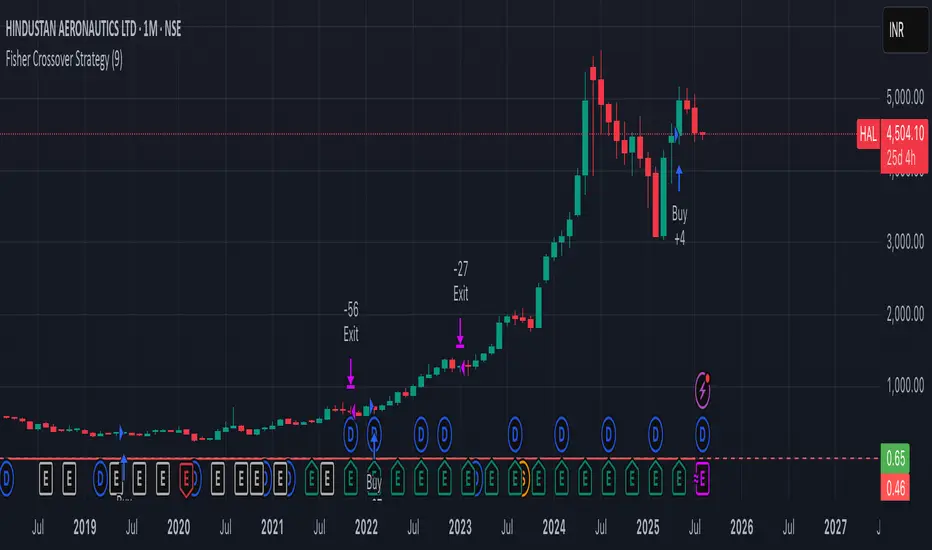
Fisher Crossover StrategyThe Fisher Crossover Strategy is a popular technical trading method that uses the Fisher Transform indicator developed by John Ehlers. This indicator mathematically converts price data into a normal Gaussian distribution, making market turning points sharper and easier to identify. The strategy is based on two lines: the Fisher line, which is the main transformed price value, and the Trigger line, which is a one-period lag of the Fisher line. Traders use the crossover of these lines to determine buy and sell opportunities.
A buy signal is generated when the Fisher line crosses above the Trigger line, indicating that bullish momentum may be starting, while a sell signal occurs when the Fisher line crosses below the Trigger line, suggesting a possible bearish reversal. Signals that occur relative to the zero line are often considered stronger; for example, a buy signal below the zero line may indicate a deeper market reversal. The strategy is simple to follow and can be applied to various markets including stocks, forex, commodities, and cryptocurrencies.
However, like all crossover strategies, it can produce false signals during sideways or ranging markets. To reduce whipsaws, traders often combine the Fisher Crossover Strategy with other tools such as support and resistance levels, volume analysis, or moving averages. Proper risk management with stop-loss and take-profit levels is also essential. Overall, the Fisher Crossover Strategy is valued for its clear entry and exit rules and its ability to highlight potential market reversals earlier than many other indicators.
Modular Range-Trading Strategy (V9.2)# 模块化震荡行情策略 (V9.2)
# Modular Range-Trading Strategy (V9.2)
## 策略简介 | Strategy Overview
该策略基于布林带 (Bollinger Bands)、RSI、MACD、ADX 等经典指标的组合,通过多逻辑模块化结构识别震荡区间的价格反转机会,支持多空双向操作,并在相同逻辑下允许智能加仓,适用于震荡市场的回测和研究。
This strategy combines classic indicators such as Bollinger Bands, RSI, MACD, and ADX to identify price reversal opportunities within ranging markets. It features a modular multi-logic structure, allowing both long and short trades with intelligent pyramiding under the same logic. It is designed for backtesting and research in range-bound conditions.
---
## 功能特点 | Key Features
- **多逻辑结构**:支持多套震荡逻辑(动能确认均值回归、布林带极限反转等)。
- **加仓与仓位互斥**:同逻辑下可智能加仓,不同逻辑间自动互斥,避免冲突。
- **回测可调时间范围**:可自定义回测起止时间,精准评估策略表现。
- **指标可视化**:布林带、RSI、MACD 及动态 ATR 止损线实时绘图。
- **K线收盘确认信号**:通过 `barstate.isconfirmed` 控制信号,避免未收盘的虚假信号。
- **Multi-logic structure**: Supports multiple range-trading logics (e.g., momentum-based mean reversion, Bollinger Band reversals).
- **Pyramiding with mutual exclusion**: Allows intelligent pyramiding within the same logic while preventing conflicts between different logics.
- **Adjustable backtesting range**: Customizable start and end dates for accurate performance evaluation.
- **Visual indicators**: Real-time plotting of Bollinger Bands, RSI, MACD, and dynamic ATR stop lines.
- **Close-bar confirmation**: Uses `barstate.isconfirmed` to avoid false signals before bar close.
---
## 使用说明 | Usage
1. 将该脚本添加到 TradingView 图表。
2. 在参数中设置回测时间段和指标参数。
3. 仅用于学习与策略研究,请勿直接用于实盘交易。
1. Add this script to your TradingView chart.
2. Configure backtesting dates and indicator parameters as needed.
3. For educational and research purposes only. **Not for live trading.**
---
## ⚠️ 免责声明 | Disclaimer
本策略仅供学习和研究使用,不构成任何形式的投资建议。
作者不参与任何实盘交易、资金管理或收益分成,也不保证策略盈利能力。
严禁将本脚本用于任何非法集资、私募募资或与虚拟货币相关的金融违法活动。
使用本策略即表示您自行承担所有风险与法律责任。
This strategy is for educational and research purposes only and does not constitute investment advice.
The author does not participate in live trading, asset management, or profit sharing, nor guarantee profitability.
The use of this script in illegal fundraising, private placements, or cryptocurrency-related financial activities is strictly prohibited.
By using this strategy, you accept all risks and legal responsibilities.
---

Combo 2/20 EMA & Bandpass Filter by TamarokDescription:
This strategy combines a 2/20 exponential moving average (EMA) crossover with a custom bandpass filter to generate buy and sell signals.
Use the Fast EMA and Slow EMA inputs to adjust trend sensitivity, and the Bandpass Filter Length, Delta, and Zones to fine-tune momentum turns.
Signals occur when both EMA and BPF agree in direction, with optional reversal and time filters.
How to use:
1. Add the script to your chart in TradingView.
2. Adjust the EMA and BP Filter parameters to match your asset’s volatility.
3. Enable ‘Reverse Signals’ to trade counter-trend, or use the time filter to limit sessions.
4. Set alerts on Long Alert and Short Alert for automated notifications.
Inspiration:
Based on HPotter’s original combo strategy (Stocks & Commodities Mar 2010).
Updated to Pine Script v6 with streamlined code and alerts.
WARNING:
For purpose educate only

Supertrend Long-Only Strategy for QQQThis strategy is meant to use Micro Momentum to give good Buy and Sell signals in trending markets

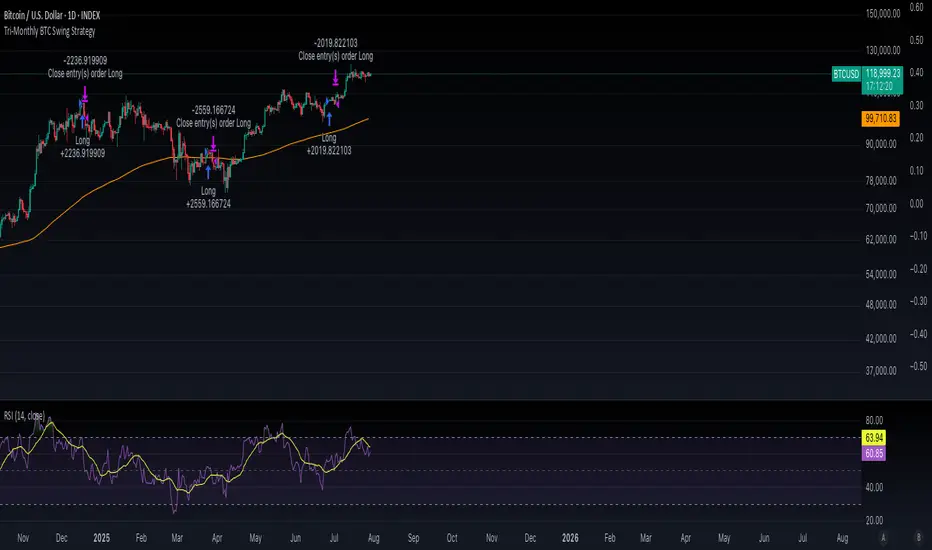
Tri-Monthly BTC Swing StrategyWhat This Does:
Component Function
EMA200 Filters long-term bullish conditions
MACD crossover Confirms swing entry
RSI > 50 Confirms momentum is strong
90-day cooldown Ensures you're not overtrading
Exit on MACD/RSI weakness Protects from reversals
EMA Grid + Martingale Strategy (Long-Only) with CooldownTitle:
EMA Grid + Martingale Strategy (Long-Only) with Cooldown
Short Summary:
A long-only strategy combining EMA trend filters, grid-based entries, optional martingale sizing, and a cooldown feature to manage position timing and exits.
Full Description:
This strategy uses a 4-EMA trend confirmation system to detect bullish momentum, then deploys a grid-style entry method with optional martingale position sizing. It includes a cooldown mechanism to prevent reentry too soon after a completed trade cycle.
How It Works
1. Trend Confirmation: Two EMA groups (fast/slow) determine whether market conditions are bullish.
2. Initial Entry: A new position is entered when both EMA groups confirm an uptrend and no position is currently active.
3. Grid Entries: Additional long entries are placed when price drops by a defined pip distance from the last entry, respecting the maximum number of entries.
4. Martingale Sizing (Optional): Grid orders can increase in size with each level using a customizable multiplier.
5. Weighted-Average Exit: All positions close once price reaches or exceeds the average entry price plus a buffer.
6. Cooldown Timer: After closing a position set, the strategy waits a defined number of bars before opening a new grid.
Key Features
• 4 customizable EMAs for trend confirmation.
• Dynamic grid-style long entries based on pip intervals.
• Optional martingale-style position sizing.
• Weighted-average price exit logic with buffer control.
• Cooldown bar period to limit overtrading.
• Suitable for optimization and backtesting with full control over inputs.
Use Cases
• Designed for trending markets where pullbacks present entry opportunities.
• Helps manage staged entries while avoiding premature reentry.
• Ideal for testing martingale and grid-based strategies with exit precision.
Note: This strategy is for testing and educational purposes only. It does not guarantee profits and is not financial advice.

Setup: Smooth Gaussian + Adaptive Supertrend (Manual Vol)Overview
This strategy combines two powerful trend-based tools originally developed by Algo Alpha: the Smooth Gaussian Trend (simulated) and the Adaptive Supertrend. The objective is to capture sustained bullish movements in periods of controlled volatility by filtering for high-probability entries.
Entry Logic
Long Entry Conditions:
The closing price is above the Smooth Gaussian Trend line (with length = 75), and
The volatility setting from the Adaptive Supertrend is manually defined as either 2 or 3
Exit Condition:
The closing price falls below the Smooth Gaussian Trend line
This script uses a simulated version of the Gaussian Trend line via double-smoothed SMA, as the original Algo Alpha indicator is protected and cannot be accessed directly in code.
Features
Plots entry and exit signals directly on the chart
Manual toggle to enable or disable the volatility filter
Lightweight design to allow flexible backtesting even without access to proprietary indicators
Important Note
This strategy does not connect to the actual Adaptive Supertrend from Algo Alpha. Users must manually input the volatility level based on what they observe on the chart when the original indicator is also applied. The Smooth Gaussian Trend is approximated and may differ slightly from the original.
Suggested Use
Recommended timeframes: 1H, 4H, or Daily
Best used alongside the original indicators displayed on the chart
Consider incorporating additional structure, momentum, or volume filters to enhance performance
If you have suggestions or would like to contribute improvements, feel free to reach out or fork the script.

MVO - MA Signal StrategyStrategy Description: MA Signal Strategy with Heikin Ashi, Break-even and Trailing Stop
⸻
🔍 Core Concept
This strategy enters long or short trades based on Heikin Ashi candles crossing above or below a moving average (MA), with optional confirmation from the Money Flow Index (MFI). It includes:
• Dynamic stop loss and take profit levels based on ATR
• Optional break-even stop adjustment
• Optional trailing stop activation after breakeven
• Full visual feedback for trades and zones
⸻
⚙️ Indicators Used
• Heikin Ashi Candles: Smooth price action to reduce noise.
• Simple Moving Average (MA): Determines trend direction.
• Average True Range (ATR): Sets volatility-based SL/TP.
• Money Flow Index (MFI): Optional momentum filter for entries.
⸻
📈 Trade Entry Logic
✅ Long Entry:
Triggered if:
• Heikin Ashi close crosses above the MA
or
• MFI is below 20 and Heikin Ashi close is above the MA
❌ Short Entry:
Triggered if:
• Heikin Ashi close crosses below the MA
or
• MFI is above 90 and Heikin Ashi close is below the MA
⸻
🛑 Stop Loss & Take Profit
• SL is set using riskMult * ATR
• TP is set using rewardMult * ATR
Example:
• If ATR = 10, riskMult = 1, rewardMult = 5
→ SL = 10 points, TP = 50 points from entry
⸻
⚖️ Break-even Logic (Optional)
• If price moves in your favor by breakevenTicks * ATR, SL is moved to entry price.
• Enabled via checkbox Enable Break Even.
⸻
📉 Trailing Stop Logic (Optional)
• Once break-even is hit, a trailing stop starts moving behind price by trailATRmult * ATR.
• Trailing stop only activates after break-even is reached.
• Enabled via checkbox Enable Trailing Stop.
📊 Visual Elements
• Heikin Ashi candles are drawn on the main chart.
• Trade zones are shaded between SL and TP during open trades.
• Lines mark Entry, SL, TP, Break-even trigger.
• Markers show entries and exits:
• Green/red triangles = long/short entries
• ✅ = Take profit hit
• ❌ = Stop loss hit
✅ Best Use Case
• Trending markets with strong pullbacks
• Works on multiple timeframes
• Better suited for assets with consistent volatility (ATR behavior)

Intraday Momentum StrategyExplanation of the StrategyIndicators:Fast and Slow EMA: A crossover of the 9-period EMA over the 21-period EMA signals a bullish trend (long entry), while a crossunder signals a bearish trend (short entry).
RSI: Ensures entries are not in overbought (RSI > 70) or oversold (RSI < 30) conditions to avoid reversals.
VWAP: Acts as a dynamic support/resistance. Long entries require the price to be above VWAP, and short entries require it to be below.
Trading Session:The strategy only trades during a user-defined session (e.g., 9:30 AM to 3:45 PM, typical for US markets).
All positions are closed at the session end to avoid overnight risk.
Risk Management:Stop Loss: 1% below/above the entry price for long/short positions.
Take Profit: 2% above/below the entry price for long/short positions.
These can be adjusted via inputs for optimization.
Position Sizing:Fixed lot size of 1 for simplicity. Adjust based on your account size during backtesting.

HSI1! First 30m Candle Strategy (15m Chart)## HSI1! First 30-Minute Candle Breakout Strategy (15m Chart) — Description
### Overview
This strategy is designed for trading **Hang Seng Index (HSI) Futures** on a 15-minute chart. It uses the price range established during the first 30 minutes of the Hong Kong main session (09:15–09:44:59) to define key breakout levels for a systematic trade entry each day.
### How the Strategy Works
#### 1. Reference Candle Period
- **Aggregation Window:** The strategy monitors the first two 15-minute bars of the session (09:15:00–09:44:59 HKT).
- **Range Capture:** It records the highest and lowest prices (the "reference high/low") during this window.
#### 2. Trade Setup
- After the 09:45 bar completes, the reference range is locked in.
- Throughout the rest of the trading day (within session hours), the strategy looks for breakouts beyond the reference range.
#### 3. Entry Rules
- **Long Entry (Buy):**
- Triggered if price rises to or above the reference high.
- Only entered if the user's settings permit "Buy Only" or "Both".
- **Short Entry (Sell):**
- Triggered if price falls to or below the reference low.
- Only entered if the user's settings permit "Sell Only" or "Both".
- **Single trade per day:**
- Once any trade executes, no additional trades are opened until the next session.
#### 4. Exit Rules
- **Take Profit (TP):**
- Target profit is set to a distance equal to the initial range added above the long entry (or subtracted below the short entry).
- Example: For a 100-point range, a long trade targets entry + 100 points.
- **Stop Loss (SL):**
- Longs are stopped out if price falls back to the session's reference low; shorts are stopped out if price rallies to the reference high.
#### 5. Session Control
- Active only within the regular day session (09:15–12:00 and 13:00–16:00 HKT).
- Trade tracking resets each new trading day.
#### 6. Trade Direction Manual Setting
- A user input allows restriction to "Buy Only", "Sell Only" or "Both" directions, providing discretion over daily bias.
### Example Workflow
| Step | Action |
|---------------------------|-------------------------------------------------------------------------|
| 09:15–09:44 | Aggregate first two 15m candles; record daily high/low |
| After 09:45 | Wait for a breakout (price crossing either the high or the low) |
| Long trade triggered | Enter at the reference high, target is "high + range", SL is at the low |
| Short trade triggered | Enter at the reference low, target is "low - range", SL at the high |
| Trade management | No more trades for the day, regardless of further breakouts |
| End of session (if open) | Trades may be closed per further logic or left to strategy to handle |
### Key Features and Benefits
- **Discipline:** Only one trade per day, minimizing overtrading.
- **Clarity:** Transparent entry/exit rules; no discretionary execution.
- **Flexibility:** User can bias system to buy-only, sell-only, or allow both, depending on trend or personal view.
- **Simple Risk Control:** Pre-defined stop loss and profit target for every trade.
- **Works best in:** Trending, breakout-prone markets with a history of impulsive moves early in the session.
This strategy is ideal for systematic traders looking to capture the Hang Seng's early session momentum, with robust rule-based management and minimal intervention.

Buy Dip Multiple Positions🎯 Objective
This strategy aims to capture aggressive dip-buying opportunities during volume-confirmed price reversals in short term downtrending markets. It is optimized for multi-entry precision, adaptive stop management, and real-time trade monitoring.
It allows traders to execute multiple long entries and dynamically trail stops to maximize gains while capping risk. Designed with modular inputs, this strategy is ideal for intraday momentum scalping and swing trading alike.
🔧 How It Operates
The strategy triggers buy entries when three conditions align:
Reversal Candle: Current close < prior low × 0.998
Volume Confirmation: Current volume exceeds average of prior 2 bars × 1.2
Price Surge Threshold: Current close below user-defined % of close from N bars ago
Once a reversal candle is confirmed, the strategy:
Calculates position size based on user-defined risk parameters
Allows up to a max number of simultaneous trades
Trailing Stop kicks in 2 bars after entry, climbing by a user-defined % each bar
Exit occurs when price hits either the trailing stop or target price
🛠️ Inputs
Users can customize all major aspects of the strategy:
Max Simultaneous Trades: Default 20
Trailing Stop Increase per Bar (%): Default 1%
Initial Stop (% of Reversal Low): Default 85%
Target Price (% Above Reversal Low): Default 60%
Price Surge Threshold (% of Past Close): Default 89%
Surge Lookback Bars: Default 14
Show Active Trade Dot: Toggle to display green trade status dot
📊 Visual Overlays
The chart displays the following:
Marker Description
🟢 Green Dot Active trade (toggleable)
🔴 Red Dot Max trades reached
📈 Trailing Stop Applied internally but not plotted (can be added)
📊 Metrics Plots of win rate, winning/losing trade counts
📎 Notes
Strategy uses strategy.cash allocation logic
Entry size adapts to account equity and risk per trade
All parameters are accessible via the settings panel
Built entirely in Pine Script v5
This strategy balances flexibility and precision, giving traders control over entry timing, capital allocation, and stop behavior. Ideal for those looking to automate dip-buy setups with tactical overlays and visual alerts.

Enhanced Ichimoku Cloud Strategy V1 [Quant Trading]Overview
This strategy combines the powerful Ichimoku Kinko Hyo system with a 171-period Exponential Moving Average (EMA) filter to create a robust trend-following approach. The strategy is designed for traders seeking to capitalize on strong momentum moves while using the Ichimoku cloud structure to identify optimal entry and exit points.
This is a patient, low-frequency trading system that prioritizes quality over quantity. In backtesting on Solana, the strategy achieved impressive results with approximately 3600% profit over just 29 trades, demonstrating its effectiveness at capturing major trend movements rather than attempting to profit from every market fluctuation. The extended parameters and strict entry criteria are specifically optimized for Solana's price action characteristics, making it well-suited for traders who prefer fewer, higher-conviction positions over high-frequency trading approaches.
What Makes This Strategy Original
This implementation enhances the traditional Ichimoku system by:
Custom Ichimoku Parameters: Uses non-standard periods (Conversion: 7, Base: 211, Lagging Span 2: 120, Displacement: 41) optimized for different market conditions
EMA Confirmation Filter: Incorporates a 171-period EMA as an additional trend confirmation layer
State Memory System: Implements a sophisticated memory system to track buy/sell states and prevent false signals
Dual Trade Modes: Offers both traditional Ichimoku signals ("Ichi") and cloud-based signals ("Cloud")
Breakout Confirmation: Requires price to break above the 25-period high for long entries
How It Works
Core Components
Ichimoku Elements:
-Conversion Line (Tenkan-sen): 7-period Donchian midpoint
-Base Line (Kijun-sen): 211-period Donchian midpoint
-Span A (Senkou Span A): Average of Conversion and Base lines, plotted 41 periods ahead
-Span B (Senkou Span B): 120-period Donchian midpoint, plotted 41 periods ahead
-Lagging Span (Chikou Span): Current close plotted 41 periods back
EMA Filter: 171-period EMA acts as a long-term trend filter
Entry Logic (Ichi Mode - Default)
A long position is triggered when ALL conditions are met:
Cloud Bullish: Span A > Span B (41 periods ago)
Breakout Confirmation: Current close > 25-period high
Ichimoku Bullish: Conversion Line > Base Line
Trend Alignment: Current close > 171-period EMA
State Memory: No previous buy signal is still active
Exit Logic
Positions are closed when:
Ichimoku Bearish: Conversion Line < Base Line
Alternative Cloud Mode
When "Cloud" mode is selected, the strategy uses:
Entry: Span A crosses above Span B with additional cloud and EMA confirmations
Exit: Span A crosses below Span B with cloud and EMA confirmations
Default Settings Explained
Strategy Properties
Initial Capital: $1,000 (realistic for average traders)
Position Size: 100% of equity (appropriate for backtesting single-asset strategies)
Commission: 0.1% (realistic for most brokers)
Slippage: 3 ticks (accounts for realistic execution costs)
Date Range: January 1, 2018 to December 31, 2069
Key Parameters
Conversion Periods: 7 (faster than traditional 9, more responsive to price changes)
Base Periods: 211 (much longer than traditional 26, provides stronger trend confirmation)
Lagging Span 2 Periods: 120 (custom period for stronger support/resistance levels)
Displacement: 41 (projects cloud further into future than standard 26)
EMA Period: 171 (long-term trend filter, approximately 8.5 months of daily data)
How to Use This Strategy
Best Market Conditions
Trending Markets: Works best in clearly trending markets where the cloud provides strong directional bias
Medium to Long-term Timeframes: Optimized for daily charts and higher timeframes
Volatile Assets: The breakout confirmation helps filter out weak signals in choppy markets
Risk Management
The strategy uses 100% equity allocation, suitable for backtesting single strategies
Consider reducing position size when implementing with real capital
Monitor the 25-period high breakout requirement as it may delay entries in fast-moving markets
Visual Elements
Green/Red Cloud: Shows bullish/bearish cloud conditions
Yellow Line: Conversion Line (Tenkan-sen)
Blue Line: Base Line (Kijun-sen)
Orange Line: 171-period EMA trend filter
Gray Line: Lagging Span (Chikou Span)
Important Considerations
Limitations
Lagging Nature: Like all Ichimoku strategies, signals may lag significant price moves
Whipsaw Risk: Extended periods of consolidation may generate false signals
Parameter Sensitivity: Custom parameters may not work equally well across all market conditions
Backtesting Notes
Results are based on historical data and past performance does not guarantee future results
The strategy includes realistic slippage and commission costs
Default settings are optimized for backtesting and may need adjustment for live trading
Risk Disclaimer
This strategy is for educational purposes only and should not be considered financial advice. Always conduct your own analysis and risk management before implementing any trading strategy. The unique parameter combinations used may not be suitable for all market conditions or trading styles.
Customization Options
Trade Mode: Switch between "Ichi" and "Cloud" signal generation
Short Trading: Option to enable short positions (disabled by default)
Date Range: Customize backtesting period
All Ichimoku Parameters: Fully customizable for different market conditions
This enhanced Ichimoku implementation provides a structured approach to trend following while maintaining the flexibility to adapt to different trading styles and market conditions.

Multi-Confluence Swing Hunter V1# Multi-Confluence Swing Hunter V1 - Complete Description
Overview
The Multi-Confluence Swing Hunter V1 is a sophisticated low timeframe scalping strategy specifically optimized for MSTR (MicroStrategy) trading. This strategy employs a comprehensive point-based scoring system that combines optimized technical indicators, price action analysis, and reversal pattern recognition to generate precise trading signals on lower timeframes.
Performance Highlight:
In backtesting on MSTR 5-minute charts, this strategy has demonstrated over 200% profit performance, showcasing its effectiveness in capturing rapid price movements and volatility patterns unique to MicroStrategy's trading behavior.
The strategy's parameters have been fine-tuned for MSTR's unique volatility characteristics, though they can be optimized for other high-volatility instruments as well.
## Key Innovation & Originality
This strategy introduces a unique **dual scoring system** approach:
- **Entry Scoring**: Identifies swing bottoms using 13+ different technical criteria
- **Exit Scoring**: Identifies swing tops using inverse criteria for optimal exit timing
Unlike traditional strategies that rely on simple indicator crossovers, this system quantifies market conditions through a weighted scoring mechanism, providing objective, data-driven entry and exit decisions.
## Technical Foundation
### Optimized Indicator Parameters
The strategy utilizes extensively backtested parameters specifically optimized for MSTR's volatility patterns:
**MACD Configuration (3,10,3)**:
- Fast EMA: 3 periods (vs standard 12)
- Slow EMA: 10 periods (vs standard 26)
- Signal Line: 3 periods (vs standard 9)
- **Rationale**: These faster parameters provide earlier signal detection while maintaining reliability, particularly effective for MSTR's rapid price movements and high-frequency volatility
**RSI Configuration (21-period)**:
- Length: 21 periods (vs standard 14)
- Oversold: 30 level
- Extreme Oversold: 25 level
- **Rationale**: The 21-period RSI reduces false signals while still capturing oversold conditions effectively in MSTR's volatile environment
**Parameter Adaptability**: While optimized for MSTR, these parameters can be adjusted for other high-volatility instruments. Faster-moving stocks may benefit from even shorter MACD periods, while less volatile assets might require longer periods for optimal performance.
### Scoring System Methodology
**Entry Score Components (Minimum 13 points required)**:
1. **RSI Signals** (max 5 points):
- RSI < 30: +2 points
- RSI < 25: +2 points
- RSI turning up: +1 point
2. **MACD Signals** (max 8 points):
- MACD below zero: +1 point
- MACD turning up: +2 points
- MACD histogram improving: +2 points
- MACD bullish divergence: +3 points
3. **Price Action** (max 4 points):
- Long lower wick (>50%): +2 points
- Small body (<30%): +1 point
- Bullish close: +1 point
4. **Pattern Recognition** (max 8 points):
- RSI bullish divergence: +4 points
- Quick recovery pattern: +2 points
- Reversal confirmation: +4 points
**Exit Score Components (Minimum 13 points required)**:
Uses inverse criteria to identify swing tops with similar weighting system.
## Risk Management Features
### Position Sizing & Risk Control
- **Single Position Strategy**: 100% equity allocation per trade
- **No Overlapping Positions**: Ensures focused risk management
- **Configurable Risk/Reward**: Default 5:1 ratio optimized for volatile assets
### Stop Loss & Take Profit Logic
- **Dynamic Stop Loss**: Based on recent swing lows with configurable buffer
- **Risk-Based Take Profit**: Calculated using risk/reward ratio
- **Clean Exit Logic**: Prevents conflicting signals
## Default Settings Optimization
### Key Parameters (Optimized for MSTR/Bitcoin-style volatility):
- **Minimum Entry Score**: 13 (ensures high-conviction entries)
- **Minimum Exit Score**: 13 (prevents premature exits)
- **Risk/Reward Ratio**: 5.0 (accounts for volatility)
- **Lower Wick Threshold**: 50% (identifies true hammer patterns)
- **Divergence Lookback**: 8 bars (optimal for swing timeframes)
### Why These Defaults Work for MSTR:
1. **Higher Score Thresholds**: MSTR's volatility requires more confirmation
2. **5:1 Risk/Reward**: Compensates for wider stops needed in volatile markets
3. **Faster MACD**: Captures momentum shifts quickly in fast-moving stocks
4. **21-period RSI**: Reduces noise while maintaining sensitivity
## Visual Features
### Score Display System
- **Green Labels**: Entry scores ≥10 points (below bars)
- **Red Labels**: Exit scores ≥10 points (above bars)
- **Large Triangles**: Actual trade entries/exits
- **Small Triangles**: Reversal pattern confirmations
### Chart Cleanliness
- Indicators plotted in separate panes (MACD, RSI)
- TP/SL levels shown only during active positions
- Clear trade markers distinguish signals from actual trades
## Backtesting Specifications
### Realistic Trading Conditions
- **Commission**: 0.1% per trade
- **Slippage**: 3 points
- **Initial Capital**: $1,000
- **Account Type**: Cash (no margin)
### Sample Size Considerations
- Strategy designed for 100+ trade sample sizes
- Recommended timeframes: 4H, 1D for swing trading
- Optimal for trending/volatile markets
## Strategy Limitations & Considerations
### Market Conditions
- **Best Performance**: Trending markets with clear swings
- **Reduced Effectiveness**: Highly choppy, sideways markets
- **Volatility Dependency**: Optimized for moderate to high volatility assets
### Risk Warnings
- **High Allocation**: 100% position sizing increases risk
- **No Diversification**: Single position strategy
- **Backtesting Limitation**: Past performance doesn't guarantee future results
## Usage Guidelines
### Recommended Assets & Timeframes
- **Primary Target**: MSTR (MicroStrategy) - 5min to 15min timeframes
- **Secondary Targets**: High-volatility stocks (TSLA, NVDA, COIN, etc.)
- **Crypto Markets**: Bitcoin, Ethereum (with parameter adjustments)
- **Timeframe Optimization**: 1min-15min for scalping, 30min-1H for swing scalping
### Timeframe Recommendations
- **Primary Scalping**: 5-minute and 15-minute charts
- **Active Monitoring**: 1-minute for precise entries
- **Swing Scalping**: 30-minute to 1-hour timeframes
- **Avoid**: Sub-1-minute (excessive noise) and above 4-hour (reduces scalping opportunities)
## Technical Requirements
- **Pine Script Version**: v6
- **Overlay**: Yes (plots on price chart)
- **Additional Panes**: MACD and RSI indicators
- **Real-time Compatibility**: Confirmed bar signals only
## Customization Options
All parameters are fully customizable through inputs:
- Indicator lengths and levels
- Scoring thresholds
- Risk management settings
- Visual display preferences
- Date range filtering
## Conclusion
This scalping strategy represents a comprehensive approach to low timeframe trading that combines multiple technical analysis methods into a cohesive, quantified system specifically optimized for MSTR's unique volatility characteristics. The optimized parameters and scoring methodology provide a systematic way to identify high-probability scalping setups while managing risk effectively in fast-moving markets.
The strategy's strength lies in its objective, multi-criteria approach that removes emotional decision-making from scalping while maintaining the flexibility to adapt to different instruments through parameter optimization. While designed for MSTR, the underlying methodology can be fine-tuned for other high-volatility assets across various markets.
**Important Disclaimer**: This strategy is designed for experienced scalpers and is optimized for MSTR trading. The high-frequency nature of scalping involves significant risk. Past performance does not guarantee future results. Always conduct your own analysis, consider your risk tolerance, and be aware of commission/slippage costs that can significantly impact scalping profitability.

LANZ Strategy 1.0 [Backtest]🔷 LANZ Strategy 1.0 — Time-Based Session Trading with Smart Reversal Logic and Risk-Controlled Limit Orders
This backtest version of LANZ Strategy 1.0 brings precision to session-based trading by using directional confirmation, pre-defined risk parameters, and limit orders that execute overnight. Designed for the 1-hour timeframe, it allows traders to evaluate the system with configurable SL, TP, and risk settings in a fully automated environment.
🧠 Core Strategy Logic:
1. Directional Confirmation at 18:00 NY:
At 18:00 NY, the system compares the 08:00 open vs the 18:00 close:
If the direction matches the previous day, the signal is reversed.
If the direction differs, the current day's trend is kept.
This logic is designed to avoid momentum exhaustion and capture corrective reversals.
2. Entry Level Definition:
Based on the confirmed direction:
For BUY, the Low of the day is used as Entry Point (EP).
For SELL, the High of the day becomes EP.
The system plots a Stop Loss and Take Profit based on user-defined pip inputs (default: SL = 18 pips, TP = 54 pips → RR 1:3).
3. Time-Limited Entry Execution (LIMIT Orders):
Orders are sent after 18:00 NY and can be triggered anytime between 18:00 and 08:00 NY.
If EP is not touched before 08:00, the order is automatically cancelled.
4. Manual Close Feature:
If the trade is still open at the configured hour (default 09:00 NY), the system closes all positions, simulating realistic intraday exit scenarios.
5. Lot Size Calculation Based on Risk:
Lot size is dynamically calculated using the account size, risk percentage, and SL distance.
This ensures consistent risk exposure regardless of market volatility.
⚙️ Step-by-Step Flow:
08:00 NY → Captures the open of the day.
18:00 NY → Confirms direction and defines EP, SL, and TP.
After 18:00 NY → If conditions are met, a LIMIT order is placed at EP.
Between 18:00–08:00 NY → If price touches EP, the trade is executed.
At 08:00 NY → If EP wasn’t touched, the order is cancelled.
At Configured Manual Close Time (default 09:00 NY) → All open positions are force-closed if still active.
🧪 Backtest Settings:
Timeframe: 1-hour only
Order Type: strategy.entry() with limit=
SL/TP Configurable: Yes, in pips
Risk Input: % of capital per trade
Manual Close Time: Fully adjustable (default 09:00 NY)
👨💻 Credits:
Developed by LANZ
Strategy logic and trading concept built with clarity and precision.
Code structure and documentation by Kairos, your AI trading assistant.
Designed for high-confidence execution and clean backtesting performance.
