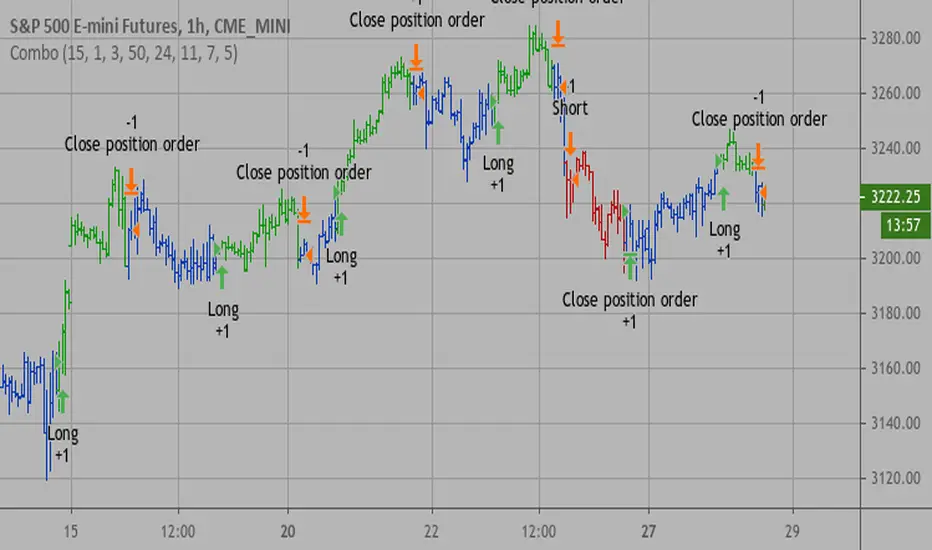
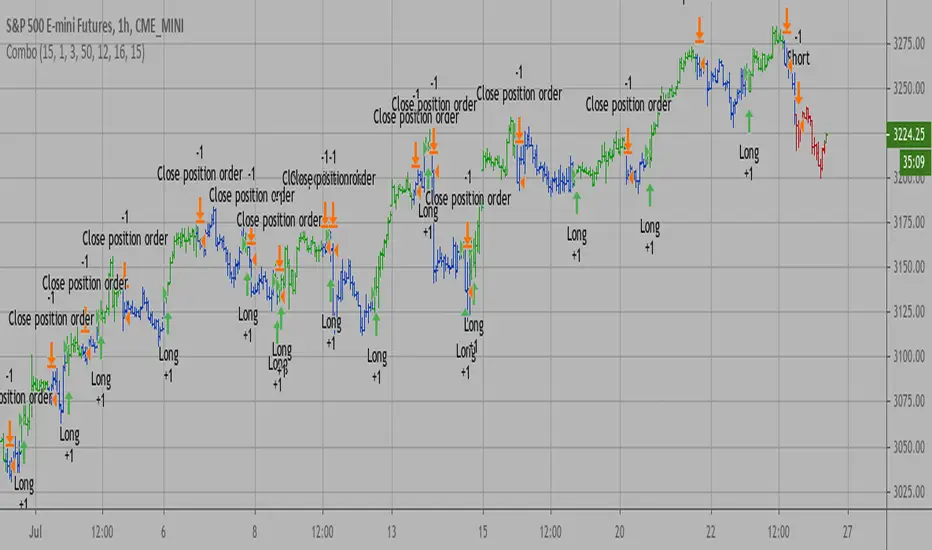
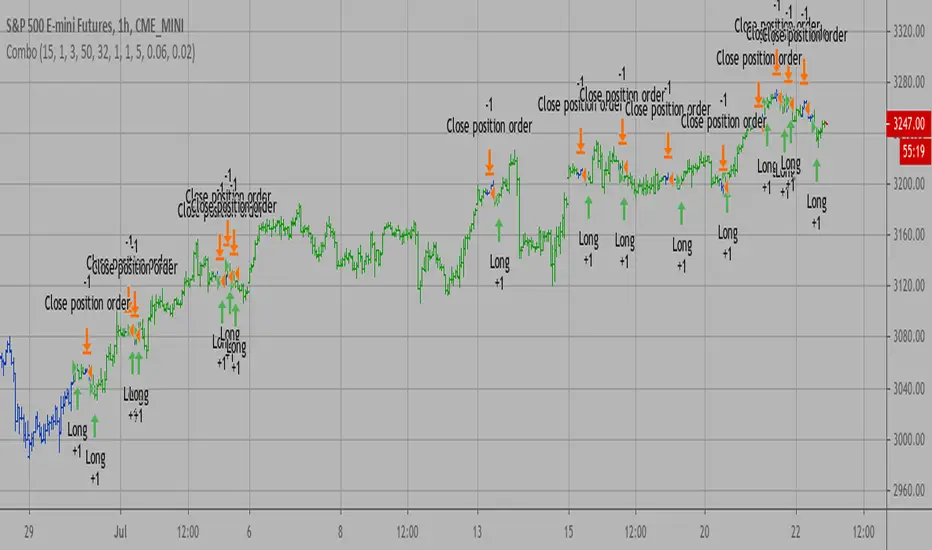
Ichimoku Cloud with MACD (By Coinrule)The Ichimoku Cloud is a collection of technical indicators that show support and resistance levels, as well as momentum and trend direction. It does this by taking multiple averages and plotting them on a chart. It also uses these figures to compute a “cloud” that attempts to forecast where the price may find support or resistance in the future.
The Ichimoku Cloud was developed by Goichi Hosoda, a Japanese journalist, and published in the late 1960s. It provides more data points than the standard candlestick chart. While it seems complicated at first glance, those familiar with how to read the charts often find it easy to understand with well-defined trading signals.
The Ichimoku Cloud is composed of five lines or calculations, two of which comprise a cloud where the difference between the two lines is shaded in.
The lines include a nine-period average, a 26-period average, an average of those two averages, a 52-period average, and a lagging closing price line.
The cloud is a key part of the indicator. When the price is below the cloud, the trend is down. When the price is above the cloud, the trend is up.
The above trend signals are strengthened if the cloud is moving in the same direction as the price. For example, during an uptrend, the top of the cloud is moving up, or during a downtrend, the bottom of the cloud is moving down.
The MACD is a trend following momentum indicator and provides identification of short-term trend direction. In this variation it utilises the 12-period as the fast and 26-period as the slow length EMAs, with signal smoothing set at 9.
This strategy combines the Ichimoku Cloud with the MACD indicator to better enter trades.
Long/Short orders are placed when three basic signals are triggered.
Long Position:
Tenkan-Sen is above the Kijun-Sen
Chikou-Span is above the close of 26 bars ago
Close is above the Kumo Cloud
MACD line crosses over the signal line
Short Position:
Tenkan-Sen is below the Kijun-Sen
Chikou-Span is below the close of 26 bars ago
Close is below the Kumo Cloud
MACD line crosses under the signal line
The script is backtested from 1 June 2022 and provides good returns.
The strategy assumes each order is using 30% of the available coins to make the results more realistic and to simulate you only ran this strategy on 30% of your holdings. A trading fee of 0.1% is also taken into account and is aligned to the base fee applied on Binance.
This script also works well on MATIC (1h timeframe), AVA (45m timeframe), and BTC (30m timeframe).
In den Scripts nach "momentum" suchen

Close v Open Moving Averages Strategy (Variable) [divonn1994]This is a simple moving average based strategy that works well with a few different coin pairings. It takes the moving average 'opening' price and plots it, then takes the moving average 'closing' price and plots it, and then decides to enter a 'long' position or exit it based on whether the two lines have crossed each other. The reasoning is that it 'enters' a position when the average closing price is increasing. This could indicate upwards momentum in prices in the future. It then exits the position when the average closing price is decreasing. This could indicate downwards momentum in prices in the future. This is only speculative, though, but sometimes it can be a very good indicator/strategy to predict future action.
What I've found is that there are a lot of coins that respond very well when the appropriate combination of: 1) type of moving average is chosen (EMA, SMA, RMA, WMA or VWMA) & 2) number of previous bars averaged (typically 10 - 250 bars) are chosen.
Depending on the coin.. each combination of MA and Number of Bars averaged can have completely different levels of success.
Example of Usage:
An example would be that the VWMA works well for BTCUSD (BitStamp), but it has different successfulness based on the time frame. For the 12 hour bar timeframe, with the 66 bar average with the VWMA I found the most success. The next best successful combo I've found is for the 1 Day bar timeframe with the 35 bar average with the VWMA.. They both have a moving average that records about a month, but each have a different successfulness. Below are a few pair combos I think are noticeable because of the net profit, but there are also have a lot of potential coins with different combos:
It's interesting to see the strategy tester change as you change the settings. The below pairs are just some of the most interesting examples I've found, but there might be other combos I haven't even tried on different coin pairs..
Some strategy settings:
BTCUSD (BitStamp) 12 Hr Timeframe : 66 bars, VWMA=> 10,387x net profit
BTCUSD (BitStamp) 1 Day Timeframe : 35 bars, VWMA=> 7,805x net profit
BNBUSD (Binance) 12 Hr Timeframe : 27 bars, VWMA => 15,484x net profit
ETHUSD (BitStamp) 16 Hr Timeframe : 60 bars, SMA => 5,498x net profit
XRPUSD (BitStamp) 16 Hr Timeframe : 33 bars, SMA => 10,178x net profit
I only chose these coin/combos because of their insane net profit factors. There are far more coins with lower net profits but more reliable trade histories.
Also, usually when I want to see which of these strategies might work for a coin pairing I will check between the different Moving Average types, for example the EMA or the SMA, then I also check between the moving average lengths (the number of bars calculated) to see which is most profitable over time.
Features:
-You can choose your preferred moving average: SMA, EMA, WMA, RMA & VWMA.
-You can also adjust the previous number of calculated bars for each moving average.
-I made the background color Green when you're currently in a long position and Red when not. I made it so you can see when you'd be actively in a trade or not. The Red and Green background colors can be toggled on/off in order to see other indicators more clearly overlayed in the chart, or if you prefer a cleaner look on your charts.
-I also have a plot of the Open moving average and Close moving average together. The Opening moving average is Purple, the Closing moving average is White. White on top is a sign of a potential upswing and purple on top is a sign of a potential downswing. I've made this also able to be toggled on/off.
Please, comment interesting pairs below that you've found for everyone :) thank you!
I will post more pairs with my favorite settings as well. I'll also be considering the quality of the trades.. for example: net profit, total trades, percent profitable, profit factor, trade window and max drawdown.
*if anyone can figure out how to change the date range, I woul really appreciate the help. It confuses me -_- *

Bollinger Bands and RSI Short Selling (by Coinrule)The Bollinger Bands are among the most famous and widely used indicators. A Bollinger Band is a technical analysis tool defined by a set of trendlines plotted two standard deviations (positively and negatively) away from a simple moving average ( SMA ) of a security's price, but which can be adjusted to user preferences. They can suggest when an asset is oversold or overbought in the short term, thus provide the best time for buying and selling it.
The relative strength index ( RSI ) is a momentum indicator used in technical analysis . RSI measures the speed and magnitude of a security's recent price changes to evaluate overvalued or undervalued conditions in the price of that security. The RSI can do more than point to overbought and oversold securities. It can also indicate securities that may be primed for a trend reversal or corrective pullback in price. It can signal when to buy and sell. Traditionally, an RSI reading of 70 or above indicates an overbought situation. A reading of 30 or below indicates an oversold condition.
The short order is placed on assets that present strong momentum when it's more likely that it is about to decrease further. The rule strategy places and closes the order when the following conditions are met:
ENTRY
The closing price is greater than the upper standard deviation of the Bollinger Bands
The RSI is less than 70
EXIT
The trade is closed in profit when the RSI is less than 70
Upper standard deviation of the Bollinger Band is greater than the the closing price.
This strategy comes with a stop loss and a take profit, and as you can see by the results, it is well suited for a bear market.
This trade works very well with ETH (1h timeframe), AVA (4h timeframe), and SOL (3h timeframe) and is backtested from the 1 December 2021 to capture how this strategy would perform in a bear market.
To make the results more realistic, the strategy assumes each order to trade 30% of the available capital. A trading fee of 0.1% is taken into account. The fee is aligned to the base fee applied on Binance, which is the largest cryptocurrency exchange.

Inverse MACD + DMI Scalping with Volatility Stop (By Coinrule)This script is focused on shorting during downtrends and utilises two strength based indicators to provide confluence that the start of a short-term downtrend has occurred - catching the opportunity as soon as possible.
This script can work well on coins you are planning to hodl for long-term and works especially well whilst using an automated bot that can execute your trades for you. It allows you to hedge your investment by allocating a % of your coins to trade with, whilst not risking your entire holding. This mitigates unrealised losses from hodling as it provides additional cash from the profits made. You can then choose to hodl this cash, or use it to reinvest when the market reaches attractive buying levels.
Alternatively, you can use this when trading contracts on futures markets where there is no need to already own the underlying asset prior to shorting it.
ENTRY
The trading system uses the Momentum Average Convergence Divergence (MACD) indicator and the Directional Movement Index (DMI) indicator to confirm when the best time is for selling. Combining these two indicators prevents trading during uptrends and reduces the likelihood of getting stuck in a market with low volatility.
The MACD is a trend following momentum indicator and provides identification of short-term trend direction. In this variation it utilises the 12-period as the fast and 26-period as the slow length EMAs, with signal smoothing set at 9.
The DMI indicates what way price is trending and compares prior lows and highs with two lines drawn between each - the positive directional movement line (+DI) and the negative directional movement line (-DI). The trend can be interpreted by comparing the two lines and what line is greater. When the negative DMI is greater than the positive DMI, there are more chances that the asset is trading in a sustained downtrend, and vice versa.
The system will enter trades when two conditions are met:
1) The MACD histogram turns bearish.
2) When the negative DMI is greater than the positive DMI.
EXIT
The strategy comes with a fixed take profit combined with a volatility stop, which acts as a trailing stop to adapt to the trend's strength. Depending on your long-term confidence in the asset, you can edit the fixed take profit to be more conservative or aggressive.
The position is closed when:
Take-Profit Exit: +8% price decrease from entry price.
OR
Stop-Loss Exit: Price crosses above the volatility stop.
In general, this approach suits medium to long term strategies. The backtesting for this strategy begins on 1 April 2022 to 18 July 2022 in order to demonstrate its results in a bear market. Back testing it further from the beginning of 2022 onwards further also produces good returns.
Pairs that produce very strong results include SOLUSDT on the 45m timeframe, MATICUSDT on the 2h timeframe, and AVAUSDT on the 1h timeframe. Generally, the back testing suggests that it works best on the 45m/1h timeframe across most pairs.
A trading fee of 0.1% is also taken into account and is aligned to the base fee applied on Binance.

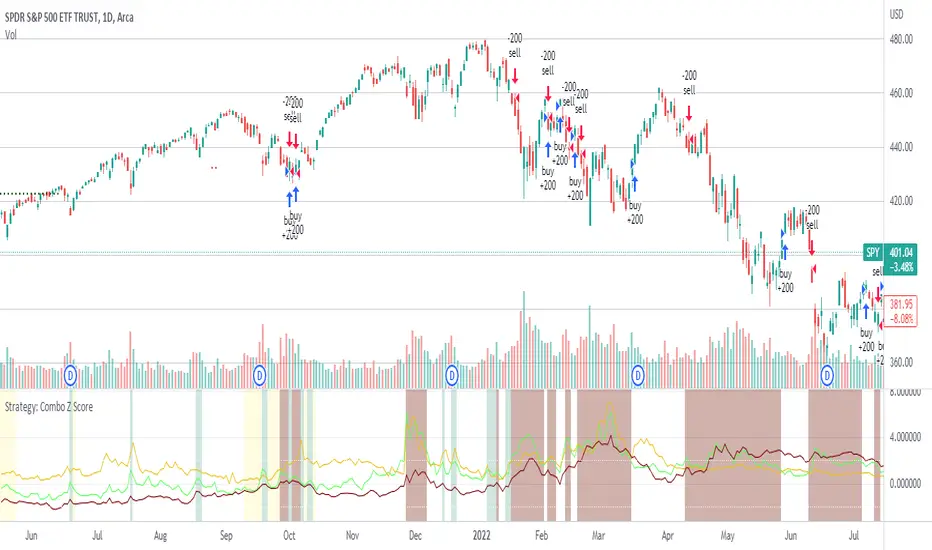
Strategy: Combo Z ScoreStrategy version of Combo Z Score
Objective:
Can we use both VIX and MOVE relationships to indicate movement in the SPY? VIX (forward contract on SPY options) correlations are quite common as forward indicators however MOVE (forward contract on bonds) also provides a slightly different level of insight
Using the Z-Score of VIX vs VVIX and MOVE vs inverted VIX (there is no M of Move so we use inverted Vix as a proxy) we get some helpful indications of potential future moves. Added %B to give us some exposure to momentum. Toggle VIX or MOVE.
If anyone has a better idea of inverted Vix to proxy forward interest in MOVE let me know.
Noticeable delta is that Vix only approach over the back test period is slightly better. Questions would be, what is the structure and nature of the market over the test period and in a bear market would MOVE or combined perform better.
Trend Follower Strategy v2 [divonn1994]The Trend Follower Strategy that I made classifies red and green candles into tiny, small, and big sizes and will send buy or sell signals depending on if the candle is classified as "big" so you get into and out of a position when there is a big candle. Out during a big green candle to take profit. Out during a big red candle in case the market is turning down. It also won't enter a position unless there is positive EMA momentum.
For the chart there is a Buy and a Sell signal. Buy = 1, Sell = 0, and when the value crosses above or below 0.5 it will trigger a long position or close the long position. The graph isn't necessary to the strategy, but can help with visualizing the trade patterns in the past if you like.
This strategy works best so far with these coins at time of posting (March 4th, 2022):
KCSUSDT (621x profit), HTUSDT (45x profit), LUNAUSDT (45x profit), BNBBTC (1553x profit), ETHBTC (219x profit), KCSBTC (1222x profit), LUNABTC (83x profit), FTMBTC (52x profit).
It can work with other pairings, but I personally like these pairings best. I didn't test it with coins outside of the top 100 coins by market cap. Use it however you want.
Works best on 1 Day charts.
The strategy would rather be in the market than out. It gets out when it see's a red flag, but can immediately go back in in the next bar if the red flags are all gone. So it makes a lot of trades.
------------------------------------------------------------------------------------------------------------------------------------------------------------------------------------------------------------------------
Update: This is the same strategy I uploaded before but I made the code Open for anyone to check it out and so it has a similar description as the previous version. Let me know what you think. I'd remove the old version if I could, but I guess it's site policy to not be able to remove scripts that have been uploaded.

Combo 2/20 EMA & Absolute Price Oscillator (APO) This is combo strategies for get a cumulative signal.
First strategy
This indicator plots 2/20 exponential moving average. For the Mov
Avg X 2/20 Indicator, the EMA bar will be painted when the Alert criteria is met.
Second strategy
The Absolute Price Oscillator displays the difference between two exponential
moving averages of a security's price and is expressed as an absolute value.
How this indicator works
APO crossing above zero is considered bullish, while crossing below zero is bearish.
A positive indicator value indicates an upward movement, while negative readings
signal a downward trend.
Divergences form when a new high or low in price is not confirmed by the Absolute Price
Oscillator (APO). A bullish divergence forms when price make a lower low, but the APO
forms a higher low. This indicates less downward momentum that could foreshadow a bullish
reversal. A bearish divergence forms when price makes a higher high, but the APO forms a
lower high. This shows less upward momentum that could foreshadow a bearish reversal.
WARNING:
- For purpose educate only
- This script to change bars colors.
SPXL Futures Strategy- Buy/sell signals for SPXL using futures momentum.
- For real-time signals at close, use ES1! on 2 minute chart and sign up for real-time cboe mini futures data feed in tradingview.
- All buys and sells are at near close of US RTH market at 4pm.
- Best to use the script with other breadth signals to decide on trading strategy.
- Script is compatible with SPY, SPXL, RSP, QQQ, TQQQ and many other SPX correlated tickers, however it’s primarily developed for SPX.

Bollinger band & Volume based strategy V2this script is upgraded version of previous one the major change is deleted script which find a highest price after entry the last of strategy is same.
If current volume is above daily average volume, and three bollinger band`s Standard Deviation, 1 and 1.5 and 2 if the current lowest price is bigger then 1 stdev and current closed is bigger then 1.5 stdev and the last,highest price is above 2.0 stdev, it defined current market is bullish and had momentum.
and the Short will entered when ma60 and ma120 is undercrossed it work as prevent current price is way lower then entry price.
**this script is working in 15min Only in BTC market or USDT**
** basic equity setting is 500$, set your own**
**if you will use this in real-trade,plz comment the result to me**
Ps: i wanna know why my script is only working well in 15 min tick, anyone who has similar phenomenon or if you had a answer about it, please comment me.

[VJ]Phoenix Force of PSAR +MACD +RSIThis is a simple intraday strategy for working on Stocks or commodities based out on PSAR, MACD , RSI and chop index . You can modify the start time and end time based on your timezones. Session value should be from market start to the time you want to square-off
Important: The end time should be at least 2 minutes before the intraday square-off time set by your broker
Comment below if you get good returns
Strategy: Entry Exits using PSAR and momentum and trend using MACD and RSI. A chop index is used as filtering
Indicators used :
Parabolic SAR is a technical indicator that is used to determine the price direction of stocks and it also draws attention to the traders when the price is changing
PSAR helps you:
Identify when a certain price trend is going to change direction
Indicate the most effective level at which to enter into the trade
Indicate the most effective exit point for the trade
Moving average convergence divergence (MACD) is a trend-following momentum indicator that shows the relationship between two moving averages of a security's price. ... Traders may buy the security when the MACD crosses above its signal line and sell—or short—the security when the MACD crosses below the signal line
RSI is intended to chart the current and historical strength or weakness of a stock or market based on the closing prices of a recent trading period.
Buying/Selling
When trading with the parabolic SAR, you would buy a market when the dots move below the current asset price and are green in colour. Alternatively, you would sell a market when the dots move above the current asset price and are red in colour. We use MACD , RSI to ensure that a right trade is picked when PSAR gives an indication. CI is used to stay away from the range bound market as much as possible.
Usage & Best setting :
Choose a good volatile stock and a time frame - 5m.
MA length : 200
RSI threshold : 50
MACD: 12,26,9
There is stop loss and take profit that can be used to optimise your trade
The template also includes daily square off based on your time.

Kwan NRP Backtest To calculate the coordinates in which the kink of the line will cross,
the standard Forex instruments are used - Relative Strenght Index, Stochastic and Momentum.
It is very easy to optimize them for the existing trading strategy: they all have very
flexible and easily customizable parameters. Signals to enter the market can be 2 situations:
Change of color of the indicator line from red to blue. At the same time, it is worth entering into the purchase;
Change of color of the indicator line from blue to red. In this case, it is worth entering for sale.
The signals are extremely clear and can be used in practice even by beginners. The indicator
itself shows when to make deals: the user only has to accompany them and set the values
of Take Profit and Stop Loss. As a rule, the signal to complete trading is the approach of
the indicator level to the levels of the maximum or minimum of the previous time period.

5MA_X_LThis is a 5 day moving average crossing long strategy in 10 min. chart, used in short term momentum trading strategy.
Momentum trading Strategy: When S&P 500 index is at up trend (or above 60 sma ), buy 10+ stocks in top 20% stock RS ranking at equal weight using this MA5X_L strategy. Change stocks when any stock exited by algorithm.
Back test start since 2020/7/1, each long entry for condition 1 is $30000, condition 2 is $20000, with max of 2 long positions.
Setup: 10 minutes chart
Buy condition 1) 3 wma cross up 195 wma (5day) 2) 3wma > 78wma > 195wma UP Trend Arrangement (UTA)
Exit condition 1) 3 wma cross under 195 wma 2) position profit > 20% and 3 wma cross under 6 ATRs line (green)

Maximized Scalping On Trend (by Coinrule)" The trend is your friend. " This is one of the most famous and valuable teachings that experienced traders can give to newbies. There is a reason for that.
No matter your views about where the price moves, what matters is where the price heads to . The market is always right, and ultimately it decides who gets the profit and who has to take a loss.
The purpose of this strategy is to spot when it's the most suitable time to buy an asset profiting from a potential short-term price increase. The strategy tends to open trades frequently, closing them on average in one and a half days.
ENTRY
The buy order is placed on assets that present strong momentum when it's more likely that it is about to increase further in the short term.
To capture momentum on the asset, the rule strategy requires:
the MA50 greater than the MA100
the RSI greater than 50
The rule, then, places the order when
The price crosses above the MA9.
EXIT
This strategy comes with a stop loss and a take profit which adapt dynamically to market conditions.
The trade is closed in profit when the RSI is greater than 70 , as the trend could experience a pull-back.
Alternatively, the trade is closed when the RSI is lower than 30 , being this a sign of weakening of the trend.
Pro tip : The 1-hour time frame has proven to return the best results on average. The strategy can also work well in the 15-min time frame if you want to increase the trades' frequency.
The strategy assumes each order to trade 30% of the available capital and opens a trade at a time. A trading fee of 0.1% is taken into account.

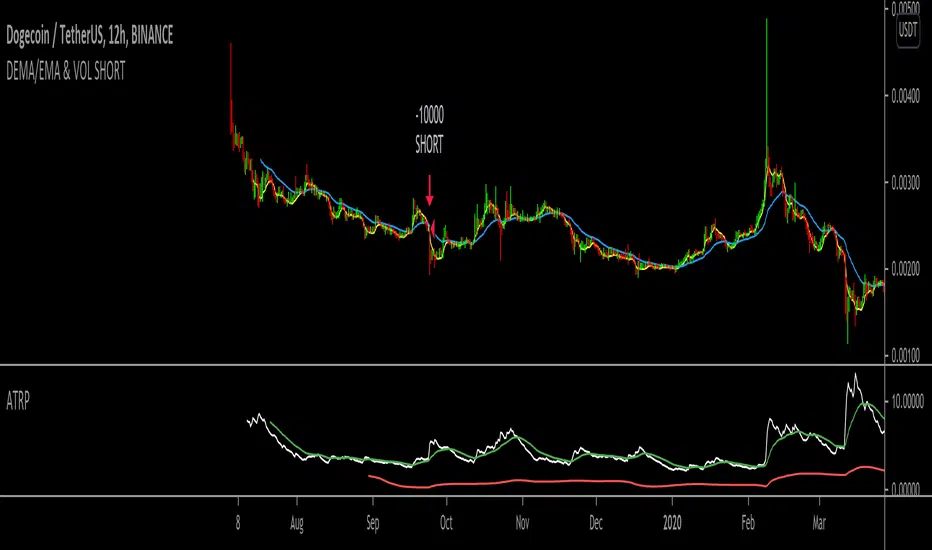
DEMA/EMA & VOL (Short strategy)Hello,
I am trying to build a short momentum strategy that is based off of the DEMA crossing under the EMA, but because many momentum strategies send too many signals, I have also implemented a volatility condition based on the average true range percentage (ATRP). Essentially, as momentum moves downwards + volatility (ATRP) moves upwards, it shorts the security. However, I am having an issue with exiting trades. I think this would be a great strategy if I could simply get the strategy to exit the trades. Does anyone mind looking through the source code and tell me what I might be doing wrong? In return, I would hope that this strategy could be useful to you in same way! Thank you for looking!
Sentiment OscillatorPrice moves when there are more market takers than there are market makers at a certain price (i.e. price moves up when there are more market buys than limit sells and vice versa). The idea of this indicator is to show the ratio between market takers and market makers in a way that is intuitive to technical analysis methods, and hopefully revealing the overall sentiment of the market in doing so. You can use it in the same way you would other oscillators (histogram crossing zero, divergences, etc). The main difference between this and most volume-weighted indicators is that the price is divided by volume instead of multiplied by it, thus giving you a rough idea of how much "effort" it took to move the price. My hypothesis is that when more volume is needed to move the price, that means bulls and bears are not in agreement of what the "fair price" should be for an asset (e.g. if the candle closes only a bit higher than its open but there's a huge spike in volume, that tells you that a majority of the market are starting to think the price is too high and they've started selling).
Methods of Calculation
1. Price Change Per Volume
The main method this indicator uses to reveal market sentiment is by comparing price change to the volume of trades in a bar.
You will see this calculation plotted in its most basic form by ticking the "Show Bar per Bar Change/Volume" box in the inputs dialog. I personally found that the plots were too noisy and cannot be used in real time reliably due to the fact that there is not much volume at the open of a new bar. I decided to leave in the option to use this method, in case you'd like to experiment with it or get a better grasp of how the indicator works.
2. Exponential Moving Averages
In my quest to smooth out the plotted data, I experimented with exponential moving averages. Applying an EMA on the change per volume data did smooth it out a bit, but still left in a lot of noise. So I worked around it by applying the EMA to the price change first, and then dividing it by the EMA of the volume. The term I use for the result of this calculation is "Market Sentiment" (do let me know if you have a better-fitting term for it ;-)), and I have kept it as an option that you can use in the way you would use other oscillators like CMF, OBV, etc. This option is unticked by default.
3. MACD
I left "Market Sentiment" unchecked as the default option because I thought an easier way to use this indicator would be as a momentum indicator like the MACD . So that's what I turned it into! I applied another EMA on the Market Sentiment, added a slower EMA to subtract from the first, and now we have a MACD line. I added a signal line to subtract from the MACD , and the result is plotted as a histogram... ish . I used area instead of columns for plot style so you don't get confused when comparing with a regular MACD indicator, but you can always change it if an actual histogram is more your taste.
The "histogram" is the main gauge of sentiment change momentum and it is easiest to use, that is why it is the only calculation plotted by default.
Methods of Use
As I have mentioned before, you can use this as you would other oscillators.
-The easiest way to use this indicator is with the Momentum histogram, where crosses over 0 indicate increasing bullish sentiment, and crosses below 0 indicate increasing bearish sentiment. You may also spot occasional divergences with the histogram.
-For the Market Sentiment option, the easiest way to use it is to look for divergences.
-And if you use the "Price Change per Volume of Each Bar", well... I honestly don't know. I guess divergences would be apparent towards the close of a bar, but in realtime, I don't recommend you use this. Maybe if you'd like to study the market movement, looking at historical data and comparing price, volume , and Change per Volume of each bar would come in handy in a pseudo-tape-reading kind of way.
Anyway, that's my explanation of this indicator. The default values were tested on BTC/USDT (Binance) 4h with decent results. You'll have to adjust the parameters for different markets and timeframes.
I have published this as a strategy so you can test out how the indicator performs as you're tweaking the parameters.
I'm aware that the code might not be the cleanest as I have only started learning pine (and code in general) for about a month, so any suggestions to improve the script would be appreciated!
Good luck and happy trading :-)

[laoowai]BNB_USDT_3m_3Commas_Bollinger_MACD_RSI_StrategyBNB_USDT _3m
Release Notes:
Time: 3min
Pair: BNB_USDT
Use: {{strategy.order.alert_message}}
What's the difference with 3Commas Bollinger Strategy by tedwardd:
1. Initial capital: 1210 USDT (10$ Base order / 400$*3 Safety order), if you will change, please change JUST safety order volume or number of safety orders 2-3
2. Using just 2(3) safety order (original script 4)
3. More high-performance strategy for BNB_USDT
4. Using MACD to sell order (original script take profit by scale), thanks Drun30 .
5. Using RSI to analyze the market conditions.
Need to change:
bot_id = input(title="3Commas Bot ID", defval=" YOUR DATA ")
email_token = input(title="Bot Email Token", defval=" YOUR DATA ")
---------------------------------------------------------------------------------------------------------------------------------------------------------------------------------------------------
FAQ copy from tedwardd
---------------------------------------------------------------------------------------------------------------------------------------------------------------------------------------------------
This strategy is intended for use as a way of backtesting various parameters available on 3commas.
The primary inputs for the strategy are:
---------------------------------------------------------------------------------------------------------------------------------------------------------------------------------------------------
// USER INPUTS
Short MA Window - The length of the Short moving average
Long MA Window - The length of the Long moving average
Upper Band Offset - The offset to use for the upper bollinger offset
Lower Band Offset - The offset to use for the lower bollinger offset
Long Stop Loss % - The stop loss percentage to test
Long Take Profit % - The Take profit percentage to test
Initial SO Deviation % - The price deviation percentage required to place to first safety order
Safety Order Vol Step % - The volume scale to test
3Commas Bot ID - (self-explanatory)
Bot Email Token - Found in the deal start message for your bot (see link in the previous section for details)
3Commas Bot Trading Pair - The pair to include for composite bot start deals (should match the format of 3commas, not TradingView IE. USDT_BTC not BTCUSDT )
---------------------------------------------------------------------------------------------------------------------------------------------------------------------------------------------------
Start Date, Month, Year and End Date, Month, and Year all apply to the backtesting window. By default, it will use as much data as it can give the current period select (there is less historical data available for periods below 1H) back as far as 2016 (there appears to be no historical data on Trading view much before this). If you would like to test a different period of time, just change these values accordingly.
---------------------------------------------------------------------------------------------------------------------------------------------------------------------------------------------------
Composite bot using a Bollinger band type trading strategy. While its primary intention is to provide users a way of backtesting bot parameters, it can also be used to trigger a deal start by either using the {{strategy.order.alert_message}} field in your alert and providing the bot details in the configuration screen for the strategy or by including the usual deal start message provided by 3commas.
---------------------------------------------------------------------------------------------------------------------------------------------------------------------------------------------------
Original script:
1. 3Commas Bollinger Strategy by tedwardd
2. Momentum Strategy ( BTC /USDT; 1h) - MACD (with source code) by Drun30

RMI + Triple HMRSI + Double EVWRSI + TERSI + CMO StrategyThis is a strange experimental strategy WIP that I decided to upload an early version to share some of what I am working on. Just one script of a few.
It combines Chande Momentum with RMI and some weird ones I am experimenting with - Triple Hull MA RSI, Double Exponential + Volume Weighted RSI, Triple Exponential RSI. And to top it off, a final oscillator that combines the THMRSI with the RMI.
The main intention here, currently, is to test the usefulness of each on different timeframes and values. Currently it is considered to buy when all are below their threshold and sell when all are above, with the chande momentum crossing its line as the final confirmation.
For now there is no individual for each of the unique elements included. I am going to likely use this is a working house project to test other experimental indicators in the future.
It may be some of these are better suited for long term but I do think they have valid uses in checking short and long term momentum at the very least.
I copied the RMI from Everget.

[CM]EMA Trend Cross STRATVISUALLY REPRESENTS THE CROSSING OF 8,13,21,55 EMA'S FROM KROWNS TA PROGRAM
Hello everybody! I was curious and wanted to see how the Strat described in one of the modules would look coded. So here we are, a clear cut visual representation of the methods talked about in the course from the EMA Module. Enjoy!
(Instructions)
Whenever the 8,13,21 all cross above the 55ema that constitutes a long signal.
On the flip side, whenever the 8,13,21 all cross below the 55ema that constitutes a short signal.
(Description)
This indicator shows the cross described in the TA program using the EMAS 8,13,21,55.
The Ema's are editable.(Color)
It plots the entry and exit parameters.
This allows for a more visual representation of the ideology described in the course.
This indicator also doesn't leave room for ambiguity in terms of where a cross happens.
The EMA's can be toggled to show certain ones at certain times.
The indicator can be used as a trend analysis tool.
***In terms of an exit, I find it to be better to use your own judgement, taking account the greater trend.
For example, in a bull market I would advise looking for long signals, rather than try to hop on a counter trend play. Vice Versa in a bear market. It's better for jumping in to the greater momentum.
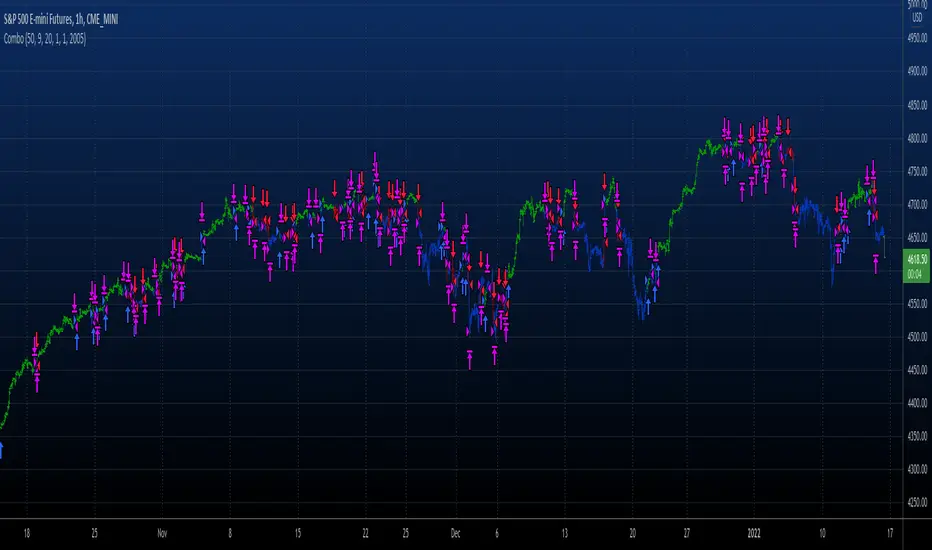
Combo Backtest 123 Reversal & Ergodic MDI This is combo strategies for get a cumulative signal.
First strategy
This System was created from the Book "How I Tripled My Money In The
Futures Market" by Ulf Jensen, Page 183. This is reverse type of strategies.
The strategy buys at market, if close price is higher than the previous close
during 2 days and the meaning of 9-days Stochastic Slow Oscillator is lower than 50.
The strategy sells at market, if close price is lower than the previous close price
during 2 days and the meaning of 9-days Stochastic Fast Oscillator is higher than 50.
Second strategy
This is one of the techniques described by William Blau in his book "Momentum,
Direction and Divergence" (1995). If you like to learn more, we advise you to
read this book. His book focuses on three key aspects of trading: momentum,
direction and divergence. Blau, who was an electrical engineer before becoming
a trader, thoroughly examines the relationship between price and momentum in
step-by-step examples. From this grounding, he then looks at the deficiencies
in other oscillators and introduces some innovative techniques, including a
fresh twist on Stochastics. On directional issues, he analyzes the intricacies
of ADX and offers a unique approach to help define trending and non-trending periods.
WARNING:
- For purpose educate only
- This script to change bars colors.
Combo Backtest 123 Reversal & Ergodic MACD This is combo strategies for get a cumulative signal.
First strategy
This System was created from the Book "How I Tripled My Money In The
Futures Market" by Ulf Jensen, Page 183. This is reverse type of strategies.
The strategy buys at market, if close price is higher than the previous close
during 2 days and the meaning of 9-days Stochastic Slow Oscillator is lower than 50.
The strategy sells at market, if close price is lower than the previous close price
during 2 days and the meaning of 9-days Stochastic Fast Oscillator is higher than 50.
Second strategy
This is one of the techniques described by William Blau in his book
"Momentum, Direction and Divergence" (1995). If you like to learn more,
we advise you to read this book. His book focuses on three key aspects
of trading: momentum, direction and divergence. Blau, who was an electrical
engineer before becoming a trader, thoroughly examines the relationship
between price and momentum in step-by-step examples. From this grounding,
he then looks at the deficiencies in other oscillators and introduces some
innovative techniques, including a fresh twist on Stochastics. On directional
issues, he analyzes the intricacies of ADX and offers a unique approach to help
define trending and non-trending periods.
Blau`s indicator is like usual MACD, but it plots opposite of meaningof
stndard MACD indicator.
WARNING:
- For purpose educate only
- This script to change bars colors.
Combo Backtest 123 Reversal & Ergodic CSI This is combo strategies for get a cumulative signal.
First strategy
This System was created from the Book "How I Tripled My Money In The
Futures Market" by Ulf Jensen, Page 183. This is reverse type of strategies.
The strategy buys at market, if close price is higher than the previous close
during 2 days and the meaning of 9-days Stochastic Slow Oscillator is lower than 50.
The strategy sells at market, if close price is lower than the previous close price
during 2 days and the meaning of 9-days Stochastic Fast Oscillator is higher than 50.
Second strategy
This is one of the techniques described by William Blau in his book
"Momentum, Direction and Divergence" (1995). If you like to learn more,
we advise you to read this book. His book focuses on three key aspects
of trading: momentum, direction and divergence. Blau, who was an electrical
engineer before becoming a trader, thoroughly examines the relationship between
price and momentum in step-by-step examples. From this grounding, he then looks
at the deficiencies in other oscillators and introduces some innovative techniques,
including a fresh twist on Stochastics. On directional issues, he analyzes the
intricacies of ADX and offers a unique approach to help define trending and
non-trending periods.
This indicator plots Ergotic CSI and smoothed Ergotic CSI to filter out noise.
WARNING:
- For purpose educate only
- This script to change bars colors.
Combo Backtest 123 Reversal & ECO Strategy This is combo strategies for get a cumulative signal.
First strategy
This System was created from the Book "How I Tripled My Money In The
Futures Market" by Ulf Jensen, Page 183. This is reverse type of strategies.
The strategy buys at market, if close price is higher than the previous close
during 2 days and the meaning of 9-days Stochastic Slow Oscillator is lower than 50.
The strategy sells at market, if close price is lower than the previous close price
during 2 days and the meaning of 9-days Stochastic Fast Oscillator is higher than 50.
Second strategy
We call this one the ECO for short, but it will be listed on the indicator list
at W. Blau’s Ergodic Candlestick Oscillator. The ECO is a momentum indicator.
It is based on candlestick bars, and takes into account the size and direction
of the candlestick "body". We have found it to be a very good momentum indicator,
and especially smooth, because it is unaffected by gaps in price, unlike many other
momentum indicators.
We like to use this indicator as an additional trend confirmation tool, or as an
alternate trend definition tool, in place of a weekly indicator. The simplest way
of using the indicator is simply to define the trend based on which side of the "0"
line the indicator is located on. If the indicator is above "0", then the trend is up.
If the indicator is below "0" then the trend is down. You can add an additional
qualifier by noting the "slope" of the indicator, and the crossing points of the slow
and fast lines. Some like to use the slope alone to define trend direction. If the
lines are sloping upward, the trend is up. Alternately, if the lines are sloping
downward, the trend is down. In this view, the point where the lines "cross" is the
point where the trend changes.
When the ECO is below the "0" line, the trend is down, and we are qualified only to
sell on new short signals from the Hi-Lo Activator. In other words, when the ECO is
above 0, we are not allowed to take short signals, and when the ECO is below 0, we
are not allowed to take long signals.
WARNING:
- For purpose educate only
- This script to change bars colors.

Combo Backtest 123 Reversal & Directional Trend Index (DTI) This is combo strategies for get a cumulative signal.
First strategy
This System was created from the Book "How I Tripled My Money In The
Futures Market" by Ulf Jensen, Page 183. This is reverse type of strategies.
The strategy buys at market, if close price is higher than the previous close
during 2 days and the meaning of 9-days Stochastic Slow Oscillator is lower than 50.
The strategy sells at market, if close price is lower than the previous close price
during 2 days and the meaning of 9-days Stochastic Fast Oscillator is higher than 50.
Second strategy
This technique was described by William Blau in his book "Momentum,
Direction and Divergence" (1995). His book focuses on three key aspects
of trading: momentum, direction and divergence. Blau, who was an electrical
engineer before becoming a trader, thoroughly examines the relationship between
price and momentum in step-by-step examples. From this grounding, he then looks
at the deficiencies in other oscillators and introduces some innovative techniques,
including a fresh twist on Stochastics. On directional issues, he analyzes the
intricacies of ADX and offers a unique approach to help define trending and
non-trending periods.
Directional Trend Index is an indicator similar to DM+ developed by Welles Wilder.
The DM+ (a part of Directional Movement System which includes both DM+ and
DM- indicators) indicator helps determine if a security is "trending." William
Blau added to it a zeroline, relative to which the indicator is deemed positive or
negative. A stable uptrend is a period when the DTI value is positive and rising, a
downtrend when it is negative and falling.
WARNING:
- For purpose educate only
- This script to change bars colors.
