Custom V2 KillZone US / FVG / EMAThis indicator is designed for traders looking to analyze liquidity levels, opportunity zones, and the underlying trend across different trading sessions. Inspired by the ICT methodology, this tool combines analysis of Exponential Moving Averages (EMA), session management, and Fair Value Gap (FVG) detection to provide a structured and disciplined approach to trading effectively.
Indicator Features
Identifying the Underlying Trend with Two EMAs
The indicator uses two EMAs on different, customizable timeframes to define the underlying trend:
EMA1 (default set to a daily timeframe): Represents the primary underlying trend.
EMA2 (default set to a 4-hour timeframe): Helps identify secondary corrections or impulses within the main trend.
These two EMAs allow traders to stay aligned with the market trend by prioritizing trades in the direction of the moving averages. For example, if prices are above both EMAs, the trend is bullish, and long trades are favored.
Analysis of Market Sessions
The indicator divides the day into key trading sessions:
Asian Session
London Session
US Pre-Open Session
Liquidity Kill Session
US Kill Zone Session
Each session is represented by high and low zones as well as mid-lines, allowing traders to visualize liquidity levels reached during these periods. Tracking the price levels in different sessions helps determine whether liquidity levels have been "swept" (taken) or not, which is essential for ICT methodology.
Liquidity Signal ("OK" or "STOP")
A specific signal appears at the end of the "Liquidity Kill" session (just before the "US Kill Zone" session):
"OK" Signal: Indicates that liquidity conditions are favorable for trading the "US Kill Zone" session. This means that liquidity levels have been swept in previous sessions (Asian, London, US Pre-Open), and the market is ready for an opportunity.
"STOP" Signal: Indicates that it is not favorable to trade the "US Kill Zone" session, as certain liquidity conditions have not been met.
The "OK" or "STOP" signal is based on an analysis of the high and low levels from previous sessions, allowing traders to ensure that significant liquidity zones have been reached before considering positions in the "Kill Zone".
Detection of Fair Value Gaps (FVG) in the US Kill Zone Session
When an "OK" signal is displayed, the indicator identifies Fair Value Gaps (FVG) during the "US Kill Zone" session. These FVGs are areas where price may return to fill an "imbalance" in the market, making them potential entry points.
Bullish FVG: Detected when there is a bullish imbalance, providing a buying opportunity if conditions align with the underlying trend.
Bearish FVG: Detected when there is a bearish imbalance, providing a selling opportunity in the trend direction.
FVG detection aligns with the ICT Silver Bullet methodology, where these imbalance zones serve as probable entry points during the "US Kill Zone".
How to Use This Indicator
Check the Underlying Trend
Before trading, observe the two EMAs (daily and 4-hour) to understand the general market trend. Trades will be prioritized in the direction indicated by these EMAs.
Monitor Liquidity Signals After the Asian, London, and US Pre-Open Sessions
The high and low levels of each session help determine if liquidity has already been swept in these areas. At the end of the "Liquidity Kill" session, an "OK" or "STOP" label will appear:
"OK" means you can look for trading opportunities in the "US Kill Zone" session.
"STOP" means it is preferable not to take trades in the "US Kill Zone" session.
Look for Opportunities in the US Kill Zone if the Signal is "OK"
When the "OK" label is present, focus on the "US Kill Zone" session. Use the Fair Value Gaps (FVG) as potential entry points for trades based on the ICT methodology. The identified FVGs will appear as colored boxes (bullish or bearish) during this session.
Use ICT Methodology to Manage Your Trades
Follow the FVGs as potential reversal zones in the direction of the trend, and manage your positions according to your personal strategy and the rules of the ICT Silver Bullet method.
Customizable Settings
The indicator includes several customization options to suit the trader's preferences:
EMA: Length, source (close, open, etc.), and timeframe.
Market Sessions: Ability to enable or disable each session, with color and line width settings.
Liquidity Signals: Customization of colors for the "OK" and "STOP" labels.
FVG: Option to display FVGs or not, with customizable colors for bullish and bearish FVGs, and the number of bars for FVG extension.
-------------------------------------------------------------------------------------------------------------
Cet indicateur est conçu pour les traders souhaitant analyser les niveaux de liquidité, les zones d’opportunité, et la tendance de fond à travers différentes sessions de trading. Inspiré de la méthodologie ICT, cet outil combine l'analyse des moyennes mobiles exponentielles (EMA), la gestion des sessions de marché, et la détection des Fair Value Gaps (FVG), afin de fournir une approche structurée et disciplinée pour trader efficacement.
In den Scripts nach "gaps" suchen

Ultimate SMC [smart-money-indicators] This indicator is a tool to support the "SMC" strategy.
This indicator does not provide entry or exit signals.
This indicator is a tool to mark key price areas.
This indicator is a tool to mark key time areas.
This indicator is particularly distinguished by its high customizability of tools,
setting it apart from the indicators currently available on the TradingView platform.
Moreover, unlike other "SMC indicators," this one does NOT use pivot points to identify Change of Character (ChoCh) or Break of Structure (BoS).
The following key areas are marked with lines or boxes:
Structure Breaks:
- Bearish Change of Character
- Bearish Break of Structure
- Bullish Change of Character
- Bullish Break of Structure
Premium/Discount Zone:
- Premium/Discount area of the current range, since the last ChoCh or BoS
Potential Buy/Sell Zones (including historical or mitigated):
- Bullish orderblocks
- Bearish orderblocks
Momentum Indicators:
- Bullish Fair Value Gaps
- Bearish Fair Value Gaps
How can I use or interpret these areas?
Structure Breaks:
- If the indicator shows bullish structure breaks in the form of ChoCh or BoS, it indicates a bullish trend.
- If the indicator shows bearish structure breaks in the form of ChoCh or BoS, it indicates a bearish trend.
Premium/Discount Zone:
- If the price is in the premium zone, it indicates that the current price is "expensive," and you should look for sell signals.
- If the price is in the discount zone, it indicates that the current price is "cheap," and you should look for buy signals.
Order Blocks:
- Bearish order blocks indicate strong selling pressure in that area, and you can look for sell signals.
- Bullish order blocks indicate strong buying pressure in that area, and you can look for buy signals.
Momentum Indicators:
- Bullish Fair Value Gaps that form after the creation of an order block may indicate strong buying pressure and confirm a bullish trend.
- Bearish Fair Value Gaps that form after the creation of an order block may indicate strong selling pressure and confirm a bearish trend.

FVG Price & Volume Graph [LuxAlgo]The FVG Price & Volume Graph tool plot recently detected fair value gaps relative to the volume traded within their area during their formation. This allows us to effectively visualize significant fair value gaps caused by high liquidity.
The indicator also returns levels from the fair value gaps areas average with the highest associated volume.
Do note that the indicator can consider the chart's visible range when being computed, which will recalculate the indicator when the chart's visible range changes.
🔶 USAGE
Fair Value Gaps (FVG) are core price action concepts occurring when the disparity between supply and demand is significant. Price has a tendency to come back to those areas and mitigating them, that is filling them.
The provided tools allow for effective visualization of both FVG's area's height as well as the volume originating from their creation, which is defined by the total traded volume located within the FVG during its creation. FVG's with more associated volume are displayed to the rightmost of the chart.
Users can determine the amount of most recent FVG's to display from the "Display Amount" setting. Disabling the "Consider Mitigation" setting will return mitigated FVGs in the plot, which can be useful to know where most FVGs were located.
We can use the area average of the FVGs with the most associated volume as potential support/resistance levels. Users can extend more FVG's averages by increasing the "Highest Volume Averages" setting.
🔹 Visualizing Volume/Price Relationships of FVG's
A linear regression is fit between FVG's areas average and their associated volume, with this linear regression helping us see where FVG's with specific volume might be located in the future based on existing FVG's.
Note that FVG's do not tend to exhibit linear relationships with their associated volume, the provided linear regression can give a general sense of tendency, but nothing necessarily accurate.
🔶 DETAILS
🔹 Intrabar Data TF
Given a formation of three candles causing an FVG, the volume traded within that FVG area is obtained by looking at the lower timeframe intrabar candles located within the intermediary candle of the formation. The volume of the intrabar candles located within the FVG areas is added up to obtain the associated volume of the FVG.
Using a lower "Intrabar Data TF" allows obtaining more precise volume results, at the cost of computation time and data availability (if there is a high difference between the "Intrabar Data TF" and the chart TF then less FVG can have their associated volume calculated due to Tradingview limitations).
🔹 Display
Users have access to multiple graphical settings affecting how the indicator is displayed.
The "Graph Resolution" setting determines the length of the X axis, with higher values returning more precise results on the location of FVGs over the X axis. Users can also control the number of labels displayed on the X-axis using the numerical input to the right of "Show X-Axis Labels".
Additionally, users can color FVG areas using a gradient relative to the size of the area, or the volume associated with the FVG.
🔶 SETTINGS
Display Amount: Amount of most recent FVGs to display.
Highest Volume Averages: Amount of FVG averages levels with the highest volume to display and extend.
Consider Mitigation: Only display unmitigated FVGs.
Filter FVGs Outside Visible Range: Only display FVGs areas that are located within the user chart visible range.
Intrabar Data TF: Timeframe used to obtain intrabar data. Should be lower than the user chart timeframe.

FVG Instantaneous Mitigation Signals [LuxAlgo]The FVG Instantaneous Mitigation Signals indicator detects and highlights "instantaneously" mitigated fair value gaps (FVG), that is FVGs that get mitigated one bar after their creation, returning signals upon mitigation.
Take profit/stop loss areas, as well as a trailing stop loss are also included to complement the signals.
🔶 USAGE
Instantaneous Fair Value Gap mitigation is a new concept introduced in this script and refers to the event of price mitigating a fair value gap one bar after its creation.
The resulting signal sentiment is opposite to the bias of the mitigated fair value gap. As such an instantaneously mitigated bearish FGV results in a bullish signal, while an instantaneously mitigated bullish FGV results in a bearish signal.
Fair value gap areas subject to instantaneous mitigation are highlighted alongside their average level, this level is extended until reached in a direction opposite to the FVG bias and can be used as a potential support/resistance level.
Users can filter out less volatile fair value gaps using the "FVG Width Filter" setting, with higher values highlighting more volatile fair value gaps subject to instantaneous mitigation.
🔹 TP/SL Areas
Users can enable take-profit/stop-loss areas. These are displayed upon a new signal formation, with an area starting from the mitigated FVG area average to this average plus/minus N ATRs, where N is determined by their respective multiplier settings.
Using a higher multiplier will return more distant areas from the price, requiring longer-term variations to be reached.
🔹 Trailing Stop Loss
A trailing-stop loss is included, increasing when the price makes a new higher high or lower low since the trailing has been set. Using a higher trailing stop multiplier will allow its initial position to be further away from the price, reducing its chances of being hit.
The trailing stop can be reset on "Every Signal", whether they are bullish or bearish, or only on an "Inverse Signal", which will reset the trailing when a signal of opposite bias is detected, this will preserve an existing trailing stop when a new signal of the same bias to the present one is detected.
🔶 DETAILS
Fair Value Gaps are ubiquitous to price action traders. These patterns arise when there exists a disparity between supply and demand. The action of price coming back and filling these imbalance areas is referred to as "mitigation" or "rebalancing".
"Instantaneous mitigation" refers to the event of price quickly mitigating a prior fair value gap, which in the case of this script is one bar after their creation. These events are indicative of a market more attentive to imbalances, and more willing to correct disparities in supply and demand.
If the market is particularly sensitive to imbalances correction then these can be excessively corrected, leading to further imbalances, highlighting a potential feedback process.
🔶 SETTINGS
FVG Width Filter: Filter out FVGs with thinner areas from returning a potential signal.
🔹 TP/SL
TP Area: Enable take-profit areas for new signals.
Multiplier: Control the distance from the take profit and the price, with higher values returning more distant TP's.
SL Area: Enable stop-loss areas for new signals.
Multiplier: Control the distance from the stop loss and the price, with higher values returning more distant SL's.
🔹 Trailing Stop
Reset Trailing Stop: Determines when the trailing stop is reset.
Multiplier: Controls the initial position of the trailing stop, with higher values returning more distant trailing stops.

Pvsra Candles Boxes and VolumeIntroduction:
The PVSRA Candles and Liquidity Zones Indicator is a indicator created to support your trading analysis on TradingView. This indicator integrates PVSRA candle analysis, liquidity zone identification, gap detection, and volume visualization, providing a detailed view of market dynamics.
Key Features:
PVSRA Candles: The indicator detects PVSRA candle patterns, which are based on price, volume, and support/resistance analysis. These candles illustrate the interaction between price movements and volume activity, offering insights into market behavior.
Liquidity Zones: The indicator marks liquidity zones, representing areas of unrecovered liquidity on both PVSRA candles and regular candles. These zones can help you identify key price levels and areas of interest for price action.
Gap Detection: The indicator automatically identifies and highlights price gaps on the chart. These gaps can indicate strong market sentiment and potential areas for price retracement or continuation.
Custom PVSRA Zones: You can plot custom PVSRA zones from higher timeframes onto the current chart, enabling the analysis of key levels and trends from multiple timeframes for a broader market perspective.
Midpoints with Price Labels: Each zone, whether it's a PVSRA zone or a custom zone, includes midpoints and price labels, aiding in the quick identification of important levels within each zone.
Volume Visualization: The indicator offers an option to display the volume of PVSRA candles directly on the PVSRA candle zones, providing additional context to understand volume activity within each zone.
Customization Options: Extensive customization options allow you to tailor the indicator to your preferences, including color schemes, wick inclusion, volume visualization, and other parameters.
Usage Instructions:
Apply the indicator to your TradingView chart.
Customize the indicator's settings based on your preferences, such as color schemes, wick inclusion, volume visualization, gap detection, and other parameters.
Observe the PVSRA candles, liquidity zones, gaps, and custom zones plotted on the chart.
Analyze the interactions between price, volume, gaps, and liquidity zones to identify potential trade setups.
Combine the insights from PVSRA candles, liquidity zones, gap detection, and volume visualization with your existing trading strategy and risk management techniques for informed decision-making.
Conclusion:
The PVSRA Candles and Liquidity Zones Indicator provides traders with a comprehensive toolset for analyzing PVSRA candle patterns, liquidity zones, gap detection, and volume visualization. By utilizing this indicator's features and customization options, you can enrich your trading analysis.
Please ensure to thoroughly test the indicator and its functionality within your trading strategy before applying it to live trading scenarios. Happy trading!

Precise Gap FinderPrecise Gap Finder
This indicator identifies Fair Value Gaps (FVGs) in price action and it is perfect for traders looking to exploit price imbalances and capitalize on trading opportunities.
How It Works:
The Precise Gap Finder detects Fair Value Gaps by analyzing three consecutive candles. A gap is identified when the middle candle’s price range (open to close) is not overlapped by the high and low prices of the surrounding candles. This indicates a price imbalance, which can be a strong signal for potential market moves.
How to Use for Trading:
Identify Entry Points: Use the highlighted Fair Value Gaps to spot potential entry points. An upward FVG can indicate a potential buying opportunity, while a downward FVG can signal a potential selling opportunity.
Confirm Trends: Combine the FVG signals with other technical indicators to confirm trends and enhance the accuracy of your trades.
Risk Management: Use FVGs to identify potential stop-loss and take-profit levels. Gaps can serve as natural support and resistance levels.
Backtesting: Analyze historical data to understand how FVGs have impacted price movements in the past, helping you refine your trading strategy

Smart Money Concepts [UAlgo]🔶 Description:
Smart Money Concepts (SMC) refer to a trading strategy that revolves around understanding and following the actions of institutional investors, such as banks and hedge funds, who are considered the “smart money” in the market. The concept is based on the idea that these institutions have more information and resources, and thus their market activities can indicate future market movements.
This script designed to be a tool that will automatically provide many features related to SMC concept for investors, offering a market structure analysis that includes the identification of order blocks, breaker blocks, and liquidity points. It also delineates premium and discount zones, highlights Fair Value Gaps (FVG), Volume Imbalance (VI) and Order Gap (OG) areas, providing users with a multifaceted view of market dynamics.
🔶 Key Features:
Market Structure Analysis : Simplifies the overview of market behavior, identifies market breakouts or trend continuation.
It detects the market structure as shown in the image below :
Order Blocks : Detects Order Blocks based on market structure analysis and volume characteristics. It draws these blocks and provides information such as volume.
Order Block Identification:
Breaker Blocks : Detects Breaker Blocks based on market structure analysis.
Breaker Block Identification:
When Order Block above is broken,
As you can see, it has now turned into a Bearish Breaker Block,
And it seems that the price is getting a reaction from this breaker block above.
Liquidity Sweeps : Tracks liquidity sweeps on both the buy and sell sides, offering traders a perspective on market momentum and potential shifts.
Multi-Timeframe Fair Value Gap (FVG), Volume Imbalance (VI), Order Gaps (OG) Detection : Detects Fair Value Gap (FVG), Volume Imbalance (VI) and Order Gaps (OG) based on different criteria such as price movements and volume characteristics. It marks these gaps/voids and provides visual cues for analysis.
Examle for FVG:
Premium & Discount Zone Analysis : Analyzes premium and discount zones, showing prices within these zones and highlighting equilibrium (0.5) levels.
Customizable Options : Provides various input parameters for customization, such as market structure length, sensitivity settings, display preferences, and mitigation methods.
Previous Key Levels : Identifies previous key levels include previous highs, lows, equilibrium points, and open prices across different timeframes such as daily, weekly, and monthly.
🔶 Disclaimer:
Use with Caution: This indicator is provided for educational and informational purposes only and should not be considered as financial advice. Users should exercise caution and perform their own analysis before making trading decisions based on the indicator's signals.
Not Financial Advice: The information provided by this indicator does not constitute financial advice, and the creator (UAlgo) shall not be held responsible for any trading losses incurred as a result of using this indicator.
Backtesting Recommended: Traders are encouraged to backtest the indicator thoroughly on historical data before using it in live trading to assess its performance and suitability for their trading strategies.
Risk Management: Trading involves inherent risks, and users should implement proper risk management strategies, including but not limited to stop-loss orders and position sizing, to mitigate potential losses.
No Guarantees: The accuracy and reliability of the indicator's signals cannot be guaranteed, as they are based on historical price data and past performance may not be indicative of future results.
Morning & Evening Star [TradingFinder] Stock Indices Gap Candle🔵 Introduction
In "technical analysis", there are certain reversal patterns that alert us to a potential reversal of a stock's previous trajectory.
Two significant patterns in this regard are the "Morning Star" pattern and the "Evening Star" pattern, which are formed by a combination of three different candlesticks and are considered as reversal patterns.
Here, we will examine how to identify these patterns and how to respond to them.
🟣 Morning Star Pattern
This pattern forms at the end of a downtrend and indicates the beginning of an uptrend.
The pattern consists of three candlesticks in the following order :
1.A large bearish candlestick
2.A candlestick with a short body
3.A bullish candlestick
With the formation of the morning star pattern, it is expected that the stock price will change direction and continue to rise. Therefore, in such situations, it is advisable to enter a long position and follow the uptrend.
Signs of the morning star pattern :
•The first sign of this pattern is the presence of a small-bodied candlestick at the end of the trend, accompanied by a gap from the previous candlestick (a bearish candlestick with a large body). Therefore, the bodies of the first and second candlesticks do not overlap.
•The second candlestick indicates market confusion and uncertainty. The color of the middle candlestick is not significant.
•The third candlestick must be positive and have a higher price than the previous candlestick (i.e., the small-bodied candlestick).
•The closing price of the third candlestick must be higher than half of the first candlestick.
🟣 Evening Star Pattern
This pattern forms at the end of an uptrend and indicates the beginning of a downtrend.
The pattern consists of three candlesticks in the following order :
1.A large bullish candlestick
2.A candlestick with a short body
3.A bearish candlestick
With the formation of the evening star pattern, it is expected that the stock price will change direction and continue to fall. Therefore, in such situations where this pattern is identified, it is advisable to refrain from entering a long position.
If the stock is traded in a two-way market, it is possible to profit by taking a short position after the formation of the evening star pattern.
Signs of the evening star pattern :
•The first sign of this pattern is the presence of a small-bodied candlestick at the end of the trend, accompanied by a gap from the previous candlestick (a bullish candlestick with a large body). Therefore, the bodies of the first and second candlesticks do not overlap.
•The second candlestick indicates market confusion and uncertainty. The color of the middle candlestick is not significant.
•The third candlestick must be negative and have a lower price than the previous candlestick (i.e., the small-bodied candlestick).
•The closing price of the third candlestick must be lower than half of the first candlestick.
🔵 How to Use
The "Filter" and "Market" features are available in the settings section, allowing you to customize the output of the indicator according to your needs.
With the "Filter" feature, you can filter the "Morning Star" and "Evening Star" patterns as "strong" or "weak." The difference between strong and weak patterns lies in their "Candle Body."
In strong patterns, the candle bodies account for more than 80% of the total candle range, while in weak patterns, the bodies comprise between 60% to 80% of the candle range.
If the "Filter" feature is set to "On," only strong patterns will be displayed. If it's set to "Off," all patterns will be displayed. By default, it's set to "Off."
The "Market" feature allows you to include "gaps" in your pattern identification calculations. You can choose between "Forex" and "Stock" modes. In the Forex pattern, calculations are performed without considering gaps since there are fewer gaps in the Forex market.
If gap calculations were to be part of the pattern identification conditions, only a very small number of patterns would be identified. However, in the "Stock" mode, gaps are considered as part of the identification conditions.

Liquidity composition / quantifytools- Overview
Liquidity composition divides each candle into sections that are used to display transaction activity at price. In simple terms, an X-ray through candle is formed, revealing the orderflow that built the candle in greater detail. Liquidity composition consists of two main components, lots and columns. Lots and columns can be used to visualize user specified volume types, currently supporting net volume and volume delta. Lots and columns can be used to visualize same or different volume types, allowing a combination of volume footprint, volume delta footprint and volume profile in one single view. Liquidity composition principally works on any chart, whether that is equities, currencies, cryptocurrencies or commodities, even charts with no volume data (in which case volatility is used to approximate transaction activity). The script also works on any timeframe, from minute charts to monthly charts. Orderflow can be observed in real-time as it develops and none of the indications are repainted.
Example: Displaying same volume types on lots and columns
Example: Displaying different volume types on lots and columns
Liquidity composition supports user specified derivative data, such as point of control(s) and net activity coloring. Derivative data can be calculated based on either net volume or volume delta, resulting in different highlights.
With net volume, volume delta and derivative data in one view, key orderflow events such as delta imbalances, high volume nodes, low volume nodes and point of controls can be used to quickly identify accumulation/distribution, imbalances, unfinished/finished auctions and trapped traders.
Accessing script 🔑
See "Author's instructions" section, found at bottom of the script page.
Key takeaways
- Liquidity composition breaks down transaction activity at price, measured in net volume or volume delta
- Developing activity can be observed real-time, none of the indications are repainted
- Transaction activity is calculated using volumes accrued in lower timeframe price movements
- Lots and columns can be used to display same or different volume types (e.g. volume delta lots and net volume columns) in single view
- Users can specify derivative data such as volume delta POCs, net volume POC and net activity coloring
- For practical guide with practical examples, see last section
Disclaimer
Orderflow data is estimated using lower timeframe price movement. While accurate and useful, it's important to note the calculations are estimations and are not based on orderbook data. Estimates are calculated by allotting volume developing on lower timeframe chart to its respective section based on closing price. Volume delta (difference between buyers/sellers) is calculated by subtracting down move volumes (sell volume) from up move volumes (buy volume). Accuracy of the orderflow estimations largely depends on quality of lower timeframe chart used for calculations, which is why this tool cannot be expected to work accurately on illiquid charts with broken data.
Liquidity composition does not provide a standalone trading strategy or financial advice. It also does not substitute knowing how to trade. Example charts and ideas shown for use cases are textbook examples under ideal conditions, not guaranteed to repeat as they are presented. Liquidity composition should be viewed as one tool providing one kind of evidence, to be used in conjunction with other means of analysis.
- Example charts
Chart #1: BTCUSDT
Chart #2: EURUSD
Chart #3: ES futures
- Calculations
By default, size of sections and lower timeframe accuracy are automatically determined for all charts and timeframes. Number of lower timeframe price moves used for calculating orderflow is kept at fixed value, by default set to 350. Accuracy value dictates how many lower timeframe candles are included in the calculation of volume at price. At 350, the script will always use 350 lower timeframe price movements in calculations (when possible). When calculated dynamic timeframe is less than 1 minute, the script switches to available seconds based timeframes. Minimum dynamic timeframe can be capped to 1 minute (as seconds based timeframes are not available for all plans) or dynamic timeframe can be overridden using an user specified timeframe.
Example: Calculating dynamic lower timeframe
Main chart: 4H / 240 minutes
Accuracy value: 100
Formula: 240 minutes / 100 = 2.4 minutes
Timeframe used for calculations = 2 minutes
Section size is automatically determined based on typical historical candle range, the bigger it is, the bigger the section size as well. Like dynamic timeframe, automatic section size can be manually overridden by user specified size expressed in ticks (minimum price unit). Users can also adjust sensitivity of automatic sizing by setting it higher (smaller sections, more detail and more noise) or lower (less sections, less detail and less noise). Section size and dynamic timeframe can be monitored via metric table.
Volume at price is calculated by allotting volume associated with a lower timeframe price movement to its respective section based on closing price (volume is stored to the section that covers closing price). When used on a chart with no volume data, volatility is used instead to determine likely magnitude of participation. Volume delta (difference between buyers/sellers) is calculated by subtracting down move volumes (sell volume) from up move volumes (buy volume). Volumes accrued in sections are monitored over a longer period of time to determine a "normal" amount of activity, which is then used to normalize accrued volumes by benchmarking them against historical values.
Volume values displayed on the left side represent how close or far volume traded at given section is to an extreme, represented by value of 10 . The more value exceeds 10, the more extreme transaction activity is historically. The lesser the value, the less extreme (and therefore more typical) transaction activity is. Users can adjust sensitivity of volume extreme threshold, either by increasing it (more transaction activity is needed to constitute an extreme) or decreasing it (less transaction activity is needed to constitute an extreme).
Example: Interpreting volume scale
0 = Very little to no transaction activity compared to historical values
5 = Transaction activity equal to average historical values
10 = Transaction activity equal to an extreme in historical values
10+ = The more transaction activity exceeds value of 10, the more extreme it is historically
Accuracy of orderflow data largely depends on quality of lower timeframe data used in calculations. Sometimes quality of underlying lower timeframe data is insufficient due to suboptimal accuracy or broken lower timeframe data, usually caused by illiquid charts with gaps and inconsistent values. Therefore, one should always ensure the usage of most liquid chart available with no gaps in lower timeframe data. To combat poor orderflow data, a simple data quality check is conducted by calculating percentage of sections with volume data out of all available sections. Idea behind the test is to capture instances where unusual amount of sections are completely empty, most likely due to data gaps in LTF chart. E.g. 90% of sections hold some volume data, 10% are completely empty = 90% data quality score.
Data quality score should be viewed as a metric alerting when detail of underlying data is insufficient to consider accurate. When data quality score is slightly below threshold, lower timeframe chart used for calculations is likely fine, but accuracy value is too low. In this case, one should increase accuracy value or manually override used timeframe with a smaller one. When data quality score is well below threshold, lower timeframe chart used for calculations is likely broken and cannot be fixed. In this case, one should look for alternative charts with more reliable data (e.g. ES1! -> SPY, BITSTAMP:BTCUSD -> BINANCE:BTCUSDT).
Example : When insufficient data quality scores can/cannot be fixed
- Derivative data
Point of control
Point of control, referring to point in price where transaction activity is highest, can be calculated based on the volume type of lots or columns (based on net volume or volume delta). Depending on the calculation basis, displayed point of controls will vary. POC calculated based on net volume is no different from traditional POC, it is simply the section with highest amount of transaction activity, marked with an X. When calculating POC based on volume delta, the script will highlight two point of controls, named leading and losing point of control . Leading POC refers to lot with highest amount of volume delta, marked with an X. If leading POC was net buy volume, losing POC is marked on section with highest net sell volume, marked with S respectfully. Same logic applies in vice versa, if leading POC is net sell volume, losing POC is marked on highest buy volume section, using the letter B.
Net activity
Similarly to point of control calculation, net activity can be calculated based on either volume types, lots or columns. When calculating net activity based on net volume, candles will be colorized according to magnitude of total volume traded. When calculating net activity based on volume delta, candles will be colorized according to side with most volume traded (buyers or sellers). Net activity color can be applied on borders or body of a candle.
- Visuals
Lots, columns, candles and POCs can be colorized using a fixed color or a volume based dynamic color, with separate color options for buy side volume, sell side volume and net volume.
Metric table can be offsetted horizontally or vertically from any four corners of the chart, allowing space for tables from other scripts.
Table sizes, label sizes and offsets for visuals are fully customizable using settings menu.
- Practical guide
OHLC data (candles) is a simple condensed visualization of an auction market process. Candles show where price was in the beginning of an auction period (timeframe), the highest/lowest point and where price was at the end of an auction. The core utility of Liquidity composition is being able to view the same auction market process in much greater detail, revealing likely intention, effort and magnitude driving the process. All basic orderflow concepts, such as ones presented by auction market theory can be applied to Liquidity composition as well.
The most obvious and easy to spot use case for orderflow tools is identifying trapped traders/absorption, seen in high transaction activity at the very highs/lows of a candle or even better, at wicks. High participation at wicks can be used to identify forced orders absorbed into limit orders, idea behind being that when high transaction activity is placed at a wick, price went one direction with a lot of participation (high effort) and came right back up (low impact) within the same time period.
Absorption can show itself in many ways:
- Extreme buy volume sections at wick highs or buy side POC at wick highs
- Multiple, clustered high buy volume sections (but not extreme) at wick highs
- Positive net volume delta into a reversal down
- Extreme sell volume sections at wick lows or sell side POC at wick lows
- Multiple, clustered high sell volume sections (but not extreme) at wick lows
- Negative net volume delta into a reversal up
- Extreme net volume sections at or net volume POC at wick highs/lows
- Extreme net volume into a reversal up/down
For accurate analysis, orderflow based events should be viewed in the context of price action. To identify absorption, it's best to look for opportunities where an opposing trend is clearly in place, e.g. absorption into highs on an uptrend, absorption into lows on a downtrend. When price is ranging without a clear trend or there's no opposing trend, extreme activity at an extreme end of a candle might be aggressive participants attempting to initiate a new trend, rather than getting absorbed in the same sense. With enough effort put into pushing price to the opposite direction at overextended price, a shift in trend direction might be near.
Price action based levels are a great way to get context around orderflow events. Simple range highs/lows as a single data point serve as a high probability regimes for reversals, making them a great point of confluence for identifying trapped traders.
Low to zero volume sections can be used to identify points in price with little to no trading, leaving a volume null/void behind. Typically sections like these represent gaps on a lower timeframe chart, which can be used as reference levels for targets and support/resistance.
Net volume can be used for same purposes as above, but for determining general intention of market participants it's a much more suitable tool than volume delta. According to auction market theory, low/no participation is considered to reject prices and high participation is considered to accept prices. With this concept in mind, unfinished auctions occur when participation is high at highs or high at lows, idea behind being that participants are showing willingness and interest to trade at higher or lower prices. Auction is considered finished when the opposite is true, i.e. when participants are not showing willingness to trade at higher/lower prices. In general, direction of unfinished auctions can be expected to continue shortly and direction of unfinished auctions can be expected to hold.
While shape of volume delta and net volume are usually similar, they're not the same thing and do not represent the same event under the hood. Volume delta at 0 does not necessarily mean participation is 0, but can also mean high participation with equal amount of buying and selling. With this distinction in mind, using volume delta and net volume in tandem has the benefit of being able to identify points in price with a lot of up and down price movement packed into a small area, i.e. consolidation. Points in price where price hangs around for an extended period of time can be used to identify levels of interest for re-tests and breakout opportunities.

Advanced Liquidations Heatmap v4 [HG]Description:
This indicator examines price movements, volume, support, and resistance levels to pinpoint potential trading opportunities. It identifies large, volatile moves with substantial activity in specific zones on the chart, which the market tends to revisit due to the high transaction volume in these areas. The primary purpose of this indicator is to highlight these high-probability areas where the market is likely to return.
Leverage Liquidations Feature:
This indicator incorporates a feature that displays arbitrary liquidation levels, corresponding to various leverage settings common among market participants. Users need to analyze the market and select appropriate leverage settings based on their insights.
Transparency Feature:
The indicator also includes a feature that modulates the transparency of the displayed areas according to their significance, enhancing the visual representation of market activity.
Color Modulation Feature:
This feature modifies the color of the displayed areas depending on their importance.
Using the indicator:
We recommend using this indicator to trade towards and away from significant areas, and to look for reversals when these zones are revisited. Although trading offers no certainties, only probabilities, the significant candles on the chart denote high-probability areas the market frequently revisits. Additionally, zones recovered between 50% - 100% indicate high-probability points where the market might reverse its direction. The probability of a market direction change escalates as more significant areas are recovered sequentially. While there's no strict rule for when these areas are recovered, observing candle colors (green, blue, red, purple) can assist in assessing the velocity of a move to or from a zone. For more effective use of this indicator, determine a trend using other preferred indicators or even a basic EMA. Dedicate time to understanding how these zones are revisited for each specific asset.
Strong Move Up:
Strong Move Down:
Area Recovered Partially:
Significant Areas Are Recovered Sequentially:
Here's how to use the "Leverage Liquidations Feature":
Analyze market leverage tendencies: It's essential for users to undertake their own research into the common leverage settings utilized by market participants for a specific asset. By doing this, they can input these settings into the indicator to gain a better comprehension of potential price movements. Some sensible defaults are included in the default settings.
Visualize the liquidation levels on the chart: After the user has identified the prevalent leverage settings, the indicator will project the corresponding liquidation levels on the chart. These levels signify the points at which numerous leveraged positions would face liquidation, considering the current market price. This data can be instrumental in setting stop losses, establishing profit targets, and predicting potential market movements due to mass liquidations.
Liquidations Levels On BTC 25x + 50x + 100x + 125x:
Here's how to use the Modulation Features:
Areas more likely to be revisited are rendered more opaque, thereby increasing their visibility on the chart. In contrast, areas less likely to be revisited are shown more transparently. This delivers a straightforward visualization of where the bulk of trading activity is occurring. There's also a Dynamic Theme mode that utilizes color, not just transparency, to emphasize important areas.
Main Features:
Significant candles are identified and marked with colors, indicating high-probability areas the market may revisit.
The indicator facilitates the display of arbitrary liquidation levels based on user-defined leverage settings.
Features modulation options that adjust the transparency and color of the areas shown, based on their importance, offering an intuitive grasp of the market. The Dynamic Theme mode greatly enhances market readability.
The indicator can exhibit what we term ghosts, or dead/recovered areas, enabling users to visually identify which areas were recovered.
Fair Value Gaps can be presented alongside significant candles as both denote imbalances in the chart. Nonetheless, we recommend deactivating the Fair Value Gaps feature when showing numerous liquidation levels, allowing for the representation of data across a broader price range. Moreover, it's crucial to recognize that enabling Fair Value Gaps can influence calculations.
Documentation:
The indicator is accompanied by comprehensive documentation detailing all its options for user reference. Additionally, we provide a comprehensive instructional video.
Limitations:
A. The indicator can only showcase a limited amount of areas, so if many liquidation levels are displayed, the price range that can be shown becomes more narrow.
B. Analogous to point (A), activating the Fair Value Gaps Feature also constricts the price range of identified areas.
Recommendation:
If you wish to display more data, employ the indicator multiple times with varying settings. Also, use the 'Hide Normal Vectors' option on all but one indicator so the 'Normal' areas don't overlap.
If you experience frequent timeouts, reduce the 'Maximum Vector Zones' setting (We've found that 350 works adequately).

CNTLibraryLibrary "CNTLibrary"
Custom Functions To Help Code In Pinescript V5
Coded By Christian Nataliano
First Coded In 10/06/2023
Last Edited In 22/06/2023
Huge Shout Out To © ZenAndTheArtOfTrading and his ZenLibrary V5, Some Of The Custom Functions Were Heavily Inspired By Matt's Work & His Pine Script Mastery Course
Another Shout Out To The TradingView's Team Library ta V5
//====================================================================================================================================================
// Custom Indicator Functions
//====================================================================================================================================================
GetKAMA(KAMA_lenght, Fast_KAMA, Slow_KAMA)
Calculates An Adaptive Moving Average Based On Perry J Kaufman's Calculations
Parameters:
KAMA_lenght (int) : Is The KAMA Lenght
Fast_KAMA (int) : Is The KAMA's Fastes Moving Average
Slow_KAMA (int) : Is The KAMA's Slowest Moving Average
Returns: Float Of The KAMA's Current Calculations
GetMovingAverage(Source, Lenght, Type)
Get Custom Moving Averages Values
Parameters:
Source (float) : Of The Moving Average, Defval = close
Lenght (simple int) : Of The Moving Average, Defval = 50
Type (string) : Of The Moving Average, Defval = Exponential Moving Average
Returns: The Moving Average Calculation Based On Its Given Source, Lenght & Calculation Type (Please Call Function On Global Scope)
GetDecimals()
Calculates how many decimals are on the quote price of the current market © ZenAndTheArtOfTrading
Returns: The current decimal places on the market quote price
Truncate(number, decimalPlaces)
Truncates (cuts) excess decimal places © ZenAndTheArtOfTrading
Parameters:
number (float)
decimalPlaces (simple float)
Returns: The given number truncated to the given decimalPlaces
ToWhole(number)
Converts pips into whole numbers © ZenAndTheArtOfTrading
Parameters:
number (float)
Returns: The converted number
ToPips(number)
Converts whole numbers back into pips © ZenAndTheArtOfTrading
Parameters:
number (float)
Returns: The converted number
GetPctChange(value1, value2, lookback)
Gets the percentage change between 2 float values over a given lookback period © ZenAndTheArtOfTrading
Parameters:
value1 (float)
value2 (float)
lookback (int)
BarsAboveMA(lookback, ma)
Counts how many candles are above the MA © ZenAndTheArtOfTrading
Parameters:
lookback (int)
ma (float)
Returns: The bar count of how many recent bars are above the MA
BarsBelowMA(lookback, ma)
Counts how many candles are below the MA © ZenAndTheArtOfTrading
Parameters:
lookback (int)
ma (float)
Returns: The bar count of how many recent bars are below the EMA
BarsCrossedMA(lookback, ma)
Counts how many times the EMA was crossed recently © ZenAndTheArtOfTrading
Parameters:
lookback (int)
ma (float)
Returns: The bar count of how many times price recently crossed the EMA
GetPullbackBarCount(lookback, direction)
Counts how many green & red bars have printed recently (ie. pullback count) © ZenAndTheArtOfTrading
Parameters:
lookback (int)
direction (int)
Returns: The bar count of how many candles have retraced over the given lookback & direction
GetSwingHigh(Lookback, SwingType)
Check If Price Has Made A Recent Swing High
Parameters:
Lookback (int) : Is For The Swing High Lookback Period, Defval = 7
SwingType (int) : Is For The Swing High Type Of Identification, Defval = 1
Returns: A Bool - True If Price Has Made A Recent Swing High
GetSwingLow(Lookback, SwingType)
Check If Price Has Made A Recent Swing Low
Parameters:
Lookback (int) : Is For The Swing Low Lookback Period, Defval = 7
SwingType (int) : Is For The Swing Low Type Of Identification, Defval = 1
Returns: A Bool - True If Price Has Made A Recent Swing Low
//====================================================================================================================================================
// Custom Risk Management Functions
//====================================================================================================================================================
CalculateStopLossLevel(OrderType, Entry, StopLoss)
Calculate StopLoss Level
Parameters:
OrderType (int) : Is To Determine A Long / Short Position, Defval = 1
Entry (float) : Is The Entry Level Of The Order, Defval = na
StopLoss (float) : Is The Custom StopLoss Distance, Defval = 2x ATR Below Close
Returns: Float - The StopLoss Level In Actual Price As A
CalculateStopLossDistance(OrderType, Entry, StopLoss)
Calculate StopLoss Distance In Pips
Parameters:
OrderType (int) : Is To Determine A Long / Short Position, Defval = 1
Entry (float) : Is The Entry Level Of The Order, NEED TO INPUT PARAM
StopLoss (float) : Level Based On Previous Calculation, NEED TO INPUT PARAM
Returns: Float - The StopLoss Value In Pips
CalculateTakeProfitLevel(OrderType, Entry, StopLossDistance, RiskReward)
Calculate TakeProfit Level
Parameters:
OrderType (int) : Is To Determine A Long / Short Position, Defval = 1
Entry (float) : Is The Entry Level Of The Order, Defval = na
StopLossDistance (float)
RiskReward (float)
Returns: Float - The TakeProfit Level In Actual Price
CalculateTakeProfitDistance(OrderType, Entry, TakeProfit)
Get TakeProfit Distance In Pips
Parameters:
OrderType (int) : Is To Determine A Long / Short Position, Defval = 1
Entry (float) : Is The Entry Level Of The Order, NEED TO INPUT PARAM
TakeProfit (float) : Level Based On Previous Calculation, NEED TO INPUT PARAM
Returns: Float - The TakeProfit Value In Pips
CalculateConversionCurrency(AccountCurrency, SymbolCurrency, BaseCurrency)
Get The Conversion Currecny Between Current Account Currency & Current Pair's Quoted Currency (FOR FOREX ONLY)
Parameters:
AccountCurrency (simple string) : Is For The Account Currency Used
SymbolCurrency (simple string) : Is For The Current Symbol Currency (Front Symbol)
BaseCurrency (simple string) : Is For The Current Symbol Base Currency (Back Symbol)
Returns: Tuple Of A Bollean (Convert The Currency ?) And A String (Converted Currency)
CalculateConversionRate(ConvertCurrency, ConversionRate)
Get The Conversion Rate Between Current Account Currency & Current Pair's Quoted Currency (FOR FOREX ONLY)
Parameters:
ConvertCurrency (bool) : Is To Check If The Current Symbol Needs To Be Converted Or Not
ConversionRate (float) : Is The Quoted Price Of The Conversion Currency (Input The request.security Function Here)
Returns: Float Price Of Conversion Rate (If In The Same Currency Than Return Value Will Be 1.0)
LotSize(LotSizeSimple, Balance, Risk, SLDistance, ConversionRate)
Get Current Lot Size
Parameters:
LotSizeSimple (bool) : Is To Toggle Lot Sizing Calculation (Simple Is Good Enough For Stocks & Crypto, Whilst Complex Is For Forex)
Balance (float) : Is For The Current Account Balance To Calculate The Lot Sizing Based Off
Risk (float) : Is For The Current Risk Per Trade To Calculate The Lot Sizing Based Off
SLDistance (float) : Is The Current Position StopLoss Distance From Its Entry Price
ConversionRate (float) : Is The Currency Conversion Rate (Used For Complex Lot Sizing Only)
Returns: Float - Position Size In Units
ToLots(Units)
Converts Units To Lots
Parameters:
Units (float) : Is For How Many Units Need To Be Converted Into Lots (Minimun 1000 Units)
Returns: Float - Position Size In Lots
ToUnits(Lots)
Converts Lots To Units
Parameters:
Lots (float) : Is For How Many Lots Need To Be Converted Into Units (Minimun 0.01 Units)
Returns: Int - Position Size In Units
ToLotsInUnits(Units)
Converts Units To Lots Than Back To Units
Parameters:
Units (float) : Is For How Many Units Need To Be Converted Into Lots (Minimun 1000 Units)
Returns: Float - Position Size In Lots That Were Rounded To Units
ATRTrail(OrderType, SourceType, ATRPeriod, ATRMultiplyer, SwingLookback)
Calculate ATR Trailing Stop
Parameters:
OrderType (int) : Is To Determine A Long / Short Position, Defval = 1
SourceType (int) : Is To Determine Where To Calculate The ATR Trailing From, Defval = close
ATRPeriod (simple int) : Is To Change Its ATR Period, Defval = 20
ATRMultiplyer (float) : Is To Change Its ATR Trailing Distance, Defval = 1
SwingLookback (int) : Is To Change Its Swing HiLo Lookback (Only From Source Type 5), Defval = 7
Returns: Float - Number Of The Current ATR Trailing
DangerZone(WinRate, AvgRRR, Filter)
Calculate Danger Zone Of A Given Strategy
Parameters:
WinRate (float) : Is The Strategy WinRate
AvgRRR (float) : Is The Strategy Avg RRR
Filter (float) : Is The Minimum Profit It Needs To Be Out Of BE Zone, Defval = 3
Returns: Int - Value, 1 If Out Of Danger Zone, 0 If BE, -1 If In Danger Zone
IsQuestionableTrades(TradeTP, TradeSL)
Checks For Questionable Trades (Which Are Trades That Its TP & SL Level Got Hit At The Same Candle)
Parameters:
TradeTP (float) : Is The Trade In Question Take Profit Level
TradeSL (float) : Is The Trade In Question Stop Loss Level
Returns: Bool - True If The Last Trade Was A "Questionable Trade"
//====================================================================================================================================================
// Custom Strategy Functions
//====================================================================================================================================================
OpenLong(EntryID, LotSize, LimitPrice, StopPrice, Comment, CommentValue)
Open A Long Order Based On The Given Params
Parameters:
EntryID (string) : Is The Trade Entry ID, Defval = "Long"
LotSize (float) : Is The Lot Size Of The Trade, Defval = 1
LimitPrice (float) : Is The Limit Order Price To Set The Order At, Defval = Na / Market Order Execution
StopPrice (float) : Is The Stop Order Price To Set The Order At, Defval = Na / Market Order Execution
Comment (string) : Is The Order Comment, Defval = Long Entry Order
CommentValue (string) : Is For Custom Values In The Order Comment, Defval = Na
Returns: Void
OpenShort(EntryID, LotSize, LimitPrice, StopPrice, Comment, CommentValue)
Open A Short Order Based On The Given Params
Parameters:
EntryID (string) : Is The Trade Entry ID, Defval = "Short"
LotSize (float) : Is The Lot Size Of The Trade, Defval = 1
LimitPrice (float) : Is The Limit Order Price To Set The Order At, Defval = Na / Market Order Execution
StopPrice (float) : Is The Stop Order Price To Set The Order At, Defval = Na / Market Order Execution
Comment (string) : Is The Order Comment, Defval = Short Entry Order
CommentValue (string) : Is For Custom Values In The Order Comment, Defval = Na
Returns: Void
TP_SLExit(FromID, TPLevel, SLLevel, PercentageClose, Comment, CommentValue)
Exits Based On Predetermined TP & SL Levels
Parameters:
FromID (string) : Is The Trade ID That The TP & SL Levels Be Palced
TPLevel (float) : Is The Take Profit Level
SLLevel (float) : Is The StopLoss Level
PercentageClose (float) : Is The Amount To Close The Order At (In Percentage) Defval = 100
Comment (string) : Is The Order Comment, Defval = Exit Order
CommentValue (string) : Is For Custom Values In The Order Comment, Defval = Na
Returns: Void
CloseLong(ExitID, PercentageClose, Comment, CommentValue, Instant)
Exits A Long Order Based On A Specified Condition
Parameters:
ExitID (string) : Is The Trade ID That Will Be Closed, Defval = "Long"
PercentageClose (float) : Is The Amount To Close The Order At (In Percentage) Defval = 100
Comment (string) : Is The Order Comment, Defval = Exit Order
CommentValue (string) : Is For Custom Values In The Order Comment, Defval = Na
Instant (bool) : Is For Exit Execution Type, Defval = false
Returns: Void
CloseShort(ExitID, PercentageClose, Comment, CommentValue, Instant)
Exits A Short Order Based On A Specified Condition
Parameters:
ExitID (string) : Is The Trade ID That Will Be Closed, Defval = "Short"
PercentageClose (float) : Is The Amount To Close The Order At (In Percentage) Defval = 100
Comment (string) : Is The Order Comment, Defval = Exit Order
CommentValue (string) : Is For Custom Values In The Order Comment, Defval = Na
Instant (bool) : Is For Exit Execution Type, Defval = false
Returns: Void
BrokerCheck(Broker)
Checks Traded Broker With Current Loaded Chart Broker
Parameters:
Broker (string) : Is The Current Broker That Is Traded
Returns: Bool - True If Current Traded Broker Is Same As Loaded Chart Broker
OpenPC(LicenseID, OrderType, UseLimit, LimitPrice, SymbolPrefix, Symbol, SymbolSuffix, Risk, SL, TP, OrderComment, Spread)
Compiles Given Parameters Into An Alert String Format To Open Trades Using Pine Connector
Parameters:
LicenseID (string) : Is The Users PineConnector LicenseID
OrderType (int) : Is The Desired OrderType To Open
UseLimit (bool) : Is If We Want To Enter The Position At Exactly The Previous Closing Price
LimitPrice (float) : Is The Limit Price Of The Trade (Only For Pending Orders)
SymbolPrefix (string) : Is The Current Symbol Prefix (If Any)
Symbol (string) : Is The Traded Symbol
SymbolSuffix (string) : Is The Current Symbol Suffix (If Any)
Risk (float) : Is The Trade Risk Per Trade / Fixed Lot Sizing
SL (float) : Is The Trade SL In Price / In Pips
TP (float) : Is The Trade TP In Price / In Pips
OrderComment (string) : Is The Executed Trade Comment
Spread (float) : is The Maximum Spread For Execution
Returns: String - Pine Connector Order Syntax Alert Message
ClosePC(LicenseID, OrderType, SymbolPrefix, Symbol, SymbolSuffix)
Compiles Given Parameters Into An Alert String Format To Close Trades Using Pine Connector
Parameters:
LicenseID (string) : Is The Users PineConnector LicenseID
OrderType (int) : Is The Desired OrderType To Close
SymbolPrefix (string) : Is The Current Symbol Prefix (If Any)
Symbol (string) : Is The Traded Symbol
SymbolSuffix (string) : Is The Current Symbol Suffix (If Any)
Returns: String - Pine Connector Order Syntax Alert Message
//====================================================================================================================================================
// Custom Backtesting Calculation Functions
//====================================================================================================================================================
CalculatePNL(EntryPrice, ExitPrice, LotSize, ConversionRate)
Calculates Trade PNL Based On Entry, Eixt & Lot Size
Parameters:
EntryPrice (float) : Is The Trade Entry
ExitPrice (float) : Is The Trade Exit
LotSize (float) : Is The Trade Sizing
ConversionRate (float) : Is The Currency Conversion Rate (Used For Complex Lot Sizing Only)
Returns: Float - The Current Trade PNL
UpdateBalance(PrevBalance, PNL)
Updates The Previous Ginve Balance To The Next PNL
Parameters:
PrevBalance (float) : Is The Previous Balance To Be Updated
PNL (float) : Is The Current Trade PNL To Be Added
Returns: Float - The Current Updated PNL
CalculateSlpComm(PNL, MaxRate)
Calculates Random Slippage & Commisions Fees Based On The Parameters
Parameters:
PNL (float) : Is The Current Trade PNL
MaxRate (float) : Is The Upper Limit (In Percentage) Of The Randomized Fee
Returns: Float - A Percentage Fee Of The Current Trade PNL
UpdateDD(MaxBalance, Balance)
Calculates & Updates The DD Based On Its Given Parameters
Parameters:
MaxBalance (float) : Is The Maximum Balance Ever Recorded
Balance (float) : Is The Current Account Balance
Returns: Float - The Current Strategy DD
CalculateWR(TotalTrades, LongID, ShortID)
Calculate The Total, Long & Short Trades Win Rate
Parameters:
TotalTrades (int) : Are The Current Total Trades That The Strategy Has Taken
LongID (string) : Is The Order ID Of The Long Trades Of The Strategy
ShortID (string) : Is The Order ID Of The Short Trades Of The Strategy
Returns: Tuple Of Long WR%, Short WR%, Total WR%, Total Winning Trades, Total Losing Trades, Total Long Trades & Total Short Trades
CalculateAvgRRR(WinTrades, LossTrades)
Calculates The Overall Strategy Avg Risk Reward Ratio
Parameters:
WinTrades (int) : Are The Strategy Winning Trades
LossTrades (int) : Are The Strategy Losing Trades
Returns: Float - The Average RRR Values
CAGR(StartTime, StartPrice, EndTime, EndPrice)
Calculates The CAGR Over The Given Time Period © TradingView
Parameters:
StartTime (int) : Is The Starting Time Of The Calculation
StartPrice (float) : Is The Starting Price Of The Calculation
EndTime (int) : Is The Ending Time Of The Calculation
EndPrice (float) : Is The Ending Price Of The Calculation
Returns: Float - The CAGR Values
//====================================================================================================================================================
// Custom Plot Functions
//====================================================================================================================================================
EditLabels(LabelID, X1, Y1, Text, Color, TextColor, EditCondition, DeleteCondition)
Edit / Delete Labels
Parameters:
LabelID (label) : Is The ID Of The Selected Label
X1 (int) : Is The X1 Coordinate IN BARINDEX Xloc
Y1 (float) : Is The Y1 Coordinate IN PRICE Yloc
Text (string) : Is The Text Than Wants To Be Written In The Label
Color (color) : Is The Color Value Change Of The Label Text
TextColor (color)
EditCondition (int) : Is The Edit Condition of The Line (Setting Location / Color)
DeleteCondition (bool) : Is The Delete Condition Of The Line If Ture Deletes The Prev Itteration Of The Line
Returns: Void
EditLine(LineID, X1, Y1, X2, Y2, Color, EditCondition, DeleteCondition)
Edit / Delete Lines
Parameters:
LineID (line) : Is The ID Of The Selected Line
X1 (int) : Is The X1 Coordinate IN BARINDEX Xloc
Y1 (float) : Is The Y1 Coordinate IN PRICE Yloc
X2 (int) : Is The X2 Coordinate IN BARINDEX Xloc
Y2 (float) : Is The Y2 Coordinate IN PRICE Yloc
Color (color) : Is The Color Value Change Of The Line
EditCondition (int) : Is The Edit Condition of The Line (Setting Location / Color)
DeleteCondition (bool) : Is The Delete Condition Of The Line If Ture Deletes The Prev Itteration Of The Line
Returns: Void
//====================================================================================================================================================
// Custom Display Functions (Using Tables)
//====================================================================================================================================================
FillTable(TableID, Column, Row, Title, Value, BgColor, TextColor, ToolTip)
Filling The Selected Table With The Inputed Information
Parameters:
TableID (table) : Is The Table ID That Wants To Be Edited
Column (int) : Is The Current Column Of The Table That Wants To Be Edited
Row (int) : Is The Current Row Of The Table That Wants To Be Edited
Title (string) : Is The String Title Of The Current Cell Table
Value (string) : Is The String Value Of The Current Cell Table
BgColor (color) : Is The Selected Color For The Current Table
TextColor (color) : Is The Selected Color For The Current Table
ToolTip (string) : Is The ToolTip Of The Current Cell In The Table
Returns: Void
DisplayBTResults(TableID, BgColor, TextColor, StartingBalance, Balance, DollarReturn, TotalPips, MaxDD)
Filling The Selected Table With The Inputed Information
Parameters:
TableID (table) : Is The Table ID That Wants To Be Edited
BgColor (color) : Is The Selected Color For The Current Table
TextColor (color) : Is The Selected Color For The Current Table
StartingBalance (float) : Is The Account Starting Balance
Balance (float)
DollarReturn (float) : Is The Account Dollar Reture
TotalPips (float) : Is The Total Pips Gained / loss
MaxDD (float) : Is The Maximum Drawdown Over The Backtesting Period
Returns: Void
DisplayBTResultsV2(TableID, BgColor, TextColor, TotalWR, QTCount, LongWR, ShortWR, InitialCapital, CumProfit, CumFee, AvgRRR, MaxDD, CAGR, MeanDD)
Filling The Selected Table With The Inputed Information
Parameters:
TableID (table) : Is The Table ID That Wants To Be Edited
BgColor (color) : Is The Selected Color For The Current Table
TextColor (color) : Is The Selected Color For The Current Table
TotalWR (float) : Is The Strategy Total WR In %
QTCount (int) : Is The Strategy Questionable Trades Count
LongWR (float) : Is The Strategy Total WR In %
ShortWR (float) : Is The Strategy Total WR In %
InitialCapital (float) : Is The Strategy Initial Starting Capital
CumProfit (float) : Is The Strategy Ending Cumulative Profit
CumFee (float) : Is The Strategy Ending Cumulative Fee (Based On Randomized Fee Assumptions)
AvgRRR (float) : Is The Strategy Average Risk Reward Ratio
MaxDD (float) : Is The Strategy Maximum DrawDown In Its Backtesting Period
CAGR (float) : Is The Strategy Compounded Average GRowth In %
MeanDD (float) : Is The Strategy Mean / Average Drawdown In The Backtesting Period
Returns: Void
//====================================================================================================================================================
// Custom Pattern Detection Functions
//====================================================================================================================================================
BullFib(priceLow, priceHigh, fibRatio)
Calculates A Bullish Fibonacci Value (From Swing Low To High) © ZenAndTheArtOfTrading
Parameters:
priceLow (float)
priceHigh (float)
fibRatio (float)
Returns: The Fibonacci Value Of The Given Ratio Between The Two Price Points
BearFib(priceLow, priceHigh, fibRatio)
Calculates A Bearish Fibonacci Value (From Swing High To Low) © ZenAndTheArtOfTrading
Parameters:
priceLow (float)
priceHigh (float)
fibRatio (float)
Returns: The Fibonacci Value Of The Given Ratio Between The Two Price Points
GetBodySize()
Gets The Current Candle Body Size IN POINTS © ZenAndTheArtOfTrading
Returns: The Current Candle Body Size IN POINTS
GetTopWickSize()
Gets The Current Candle Top Wick Size IN POINTS © ZenAndTheArtOfTrading
Returns: The Current Candle Top Wick Size IN POINTS
GetBottomWickSize()
Gets The Current Candle Bottom Wick Size IN POINTS © ZenAndTheArtOfTrading
Returns: The Current Candle Bottom Wick Size IN POINTS
GetBodyPercent()
Gets The Current Candle Body Size As A Percentage Of Its Entire Size Including Its Wicks © ZenAndTheArtOfTrading
Returns: The Current Candle Body Size IN PERCENTAGE
GetTopWickPercent()
Gets The Current Top Wick Size As A Percentage Of Its Entire Body Size
Returns: Float - The Current Candle Top Wick Size IN PERCENTAGE
GetBottomWickPercent()
Gets The Current Bottom Wick Size As A Percentage Of Its Entire Bodu Size
Returns: Float - The Current Candle Bottom Size IN PERCENTAGE
BullishEC(Allowance, RejectionWickSize, EngulfWick, NearSwings, SwingLookBack)
Checks If The Current Bar Is A Bullish Engulfing Candle
Parameters:
Allowance (int) : To Give Flexibility Of Engulfing Pattern Detection In Markets That Have Micro Gaps, Defval = 0
RejectionWickSize (float) : To Filter Out long (Upper And Lower) Wick From The Bullsih Engulfing Pattern, Defval = na
EngulfWick (bool) : To Specify If We Want The Pattern To Also Engulf Its Upper & Lower Previous Wicks, Defval = false
NearSwings (bool) : To Specify If We Want The Pattern To Be Near A Recent Swing Low, Defval = true
SwingLookBack (int) : To Specify How Many Bars Back To Detect A Recent Swing Low, Defval = 10
Returns: Bool - True If The Current Bar Matches The Requirements of a Bullish Engulfing Candle
BearishEC(Allowance, RejectionWickSize, EngulfWick, NearSwings, SwingLookBack)
Checks If The Current Bar Is A Bearish Engulfing Candle
Parameters:
Allowance (int) : To Give Flexibility Of Engulfing Pattern Detection In Markets That Have Micro Gaps, Defval = 0
RejectionWickSize (float) : To Filter Out long (Upper And Lower) Wick From The Bearish Engulfing Pattern, Defval = na
EngulfWick (bool) : To Specify If We Want The Pattern To Also Engulf Its Upper & Lower Previous Wicks, Defval = false
NearSwings (bool) : To Specify If We Want The Pattern To Be Near A Recent Swing High, Defval = true
SwingLookBack (int) : To Specify How Many Bars Back To Detect A Recent Swing High, Defval = 10
Returns: Bool - True If The Current Bar Matches The Requirements of a Bearish Engulfing Candle
Hammer(Fib, ColorMatch, NearSwings, SwingLookBack, ATRFilterCheck, ATRPeriod)
Checks If The Current Bar Is A Hammer Candle
Parameters:
Fib (float) : To Specify Which Fibonacci Ratio To Use When Determining The Hammer Candle, Defval = 0.382 Ratio
ColorMatch (bool) : To Filter Only Bullish Closed Hammer Candle Pattern, Defval = false
NearSwings (bool) : To Specify If We Want The Doji To Be Near A Recent Swing Low, Defval = true
SwingLookBack (int) : To Specify How Many Bars Back To Detect A Recent Swing Low, Defval = 10
ATRFilterCheck (float) : To Filter Smaller Hammer Candles That Might Be Better Classified As A Doji Candle, Defval = 1
ATRPeriod (simple int) : To Change ATR Period Of The ATR Filter, Defval = 20
Returns: Bool - True If The Current Bar Matches The Requirements of a Hammer Candle
Star(Fib, ColorMatch, NearSwings, SwingLookBack, ATRFilterCheck, ATRPeriod)
Checks If The Current Bar Is A Hammer Candle
Parameters:
Fib (float) : To Specify Which Fibonacci Ratio To Use When Determining The Hammer Candle, Defval = 0.382 Ratio
ColorMatch (bool) : To Filter Only Bullish Closed Hammer Candle Pattern, Defval = false
NearSwings (bool) : To Specify If We Want The Doji To Be Near A Recent Swing Low, Defval = true
SwingLookBack (int) : To Specify How Many Bars Back To Detect A Recent Swing Low, Defval = 10
ATRFilterCheck (float) : To Filter Smaller Hammer Candles That Might Be Better Classified As A Doji Candle, Defval = 1
ATRPeriod (simple int) : To Change ATR Period Of The ATR Filter, Defval = 20
Returns: Bool - True If The Current Bar Matches The Requirements of a Hammer Candle
Doji(MaxWickSize, MaxBodySize, DojiType, NearSwings, SwingLookBack)
Checks If The Current Bar Is A Doji Candle
Parameters:
MaxWickSize (float) : To Specify The Maximum Lenght Of Its Upper & Lower Wick, Defval = 2
MaxBodySize (float) : To Specify The Maximum Lenght Of Its Candle Body IN PERCENT, Defval = 0.05
DojiType (int)
NearSwings (bool) : To Specify If We Want The Doji To Be Near A Recent Swing High / Low (Only In Dragonlyf / Gravestone Mode), Defval = true
SwingLookBack (int) : To Specify How Many Bars Back To Detect A Recent Swing High / Low (Only In Dragonlyf / Gravestone Mode), Defval = 10
Returns: Bool - True If The Current Bar Matches The Requirements of a Doji Candle
BullishIB(Allowance, RejectionWickSize, EngulfWick, NearSwings, SwingLookBack)
Checks If The Current Bar Is A Bullish Harami Candle
Parameters:
Allowance (int) : To Give Flexibility Of Harami Pattern Detection In Markets That Have Micro Gaps, Defval = 0
RejectionWickSize (float) : To Filter Out long (Upper And Lower) Wick From The Bullsih Harami Pattern, Defval = na
EngulfWick (bool) : To Specify If We Want The Pattern To Also Engulf Its Upper & Lower Previous Wicks, Defval = false
NearSwings (bool) : To Specify If We Want The Pattern To Be Near A Recent Swing Low, Defval = true
SwingLookBack (int) : To Specify How Many Bars Back To Detect A Recent Swing Low, Defval = 10
Returns: Bool - True If The Current Bar Matches The Requirements of a Bullish Harami Candle
BearishIB(Allowance, RejectionWickSize, EngulfWick, NearSwings, SwingLookBack)
Checks If The Current Bar Is A Bullish Harami Candle
Parameters:
Allowance (int) : To Give Flexibility Of Harami Pattern Detection In Markets That Have Micro Gaps, Defval = 0
RejectionWickSize (float) : To Filter Out long (Upper And Lower) Wick From The Bearish Harami Pattern, Defval = na
EngulfWick (bool) : To Specify If We Want The Pattern To Also Engulf Its Upper & Lower Previous Wicks, Defval = false
NearSwings (bool) : To Specify If We Want The Pattern To Be Near A Recent Swing High, Defval = true
SwingLookBack (int) : To Specify How Many Bars Back To Detect A Recent Swing High, Defval = 10
Returns: Bool - True If The Current Bar Matches The Requirements of a Bearish Harami Candle
//====================================================================================================================================================
// Custom Time Functions
//====================================================================================================================================================
BarInSession(sess, useFilter)
Determines if the current price bar falls inside the specified session © ZenAndTheArtOfTrading
Parameters:
sess (simple string)
useFilter (bool)
Returns: A boolean - true if the current bar falls within the given time session
BarOutSession(sess, useFilter)
Determines if the current price bar falls outside the specified session © ZenAndTheArtOfTrading
Parameters:
sess (simple string)
useFilter (bool)
Returns: A boolean - true if the current bar falls outside the given time session
DateFilter(startTime, endTime)
Determines if this bar's time falls within date filter range © ZenAndTheArtOfTrading
Parameters:
startTime (int)
endTime (int)
Returns: A boolean - true if the current bar falls within the given dates
DayFilter(monday, tuesday, wednesday, thursday, friday, saturday, sunday)
Checks if the current bar's day is in the list of given days to analyze © ZenAndTheArtOfTrading
Parameters:
monday (bool)
tuesday (bool)
wednesday (bool)
thursday (bool)
friday (bool)
saturday (bool)
sunday (bool)
Returns: A boolean - true if the current bar's day is one of the given days
AUSSess()
Checks If The Current Australian Forex Session In Running
Returns: Bool - True If Currently The Australian Session Is Running
ASIASess()
Checks If The Current Asian Forex Session In Running
Returns: Bool - True If Currently The Asian Session Is Running
EURSess()
Checks If The Current European Forex Session In Running
Returns: Bool - True If Currently The European Session Is Running
USSess()
Checks If The Current US Forex Session In Running
Returns: Bool - True If Currently The US Session Is Running
UNIXToDate(Time, ConversionType, TimeZone)
Converts UNIX Time To Datetime
Parameters:
Time (int) : Is The UNIX Time Input
ConversionType (int) : Is The Datetime Output Format, Defval = DD-MM-YYYY
TimeZone (string) : Is To Convert The Outputed Datetime Into The Specified Time Zone, Defval = Exchange Time Zone
Returns: String - String Of Datetime

Everything ICT v1█ OVERVIEW
This script presents some of the concepts taught by the ICT. It includes "Fair value gaps", "Double tops and bottoms", "New week opening gaps", "Optimal trade entry" and some other minor things. This is a work in progress and there will be more concepts included in the future.
█ FEATURES
The first group in the indicator's menu is "Active fair value gaps" .
Its purpose is to display a FVG if the price enters one. Most of the other scripts are deleting the FVG when the price go through it but this script won't. You can choose how many candles to look back for a FVG, FVG lines transparency and to show only current FVG and delete old ones.
Second, you can choose to show relatively equal highs and lows otherwise known as double bottoms and tops . There is a filter which will remove some of the lines. It is included to clean up your chart a bit but if you don't want to miss something you can leave it enabled.
There is a precision value which is ranging between 20 and 120. Higher number means the difference between the two highs/lows should be very small. On its biggest setting 120 it will display only equal highs/lows.
You can choose the colors and width of the lines.
"Weekend gaps" category is self explanatory. You can chose either to show them or not, colors and width.
"Optimal trade entry" is constantly measuring a defined range and it's presenting real-time a graph on the chart with which you can easily find if price is in OTE.
There are options to choose how many candles to look back for defining a range and everything else is for the minimal visual representation.
And lastly, there are options to show horizontal line at 0:00 am NY local time, clock adjustment setting if the line doesn't correspond to its spot and option to change the color of a FVG candle which in my opinion is the most useful thing in a trading indicator.
Credits: ICT
═════════════════════════════════════════════════════════════════════════
This indicator is not meant to be, and do not constitute, financial, investment, trading, or other types of advice.
Please note that it is NOT providing trading signals but trading ideas instead.
Under no circumstances will the Programmer be held responsible or liable in any way for any claims, damages, losses, expenses, costs or liabilities whatsoever (including, without limitation, any direct or indirect damages for loss of profits, business interruption or loss of information) resulting or arising directly or indirectly from your use of or inability to use this indicator or anything linked to it, or from your reliance on the information and material on this indicator, even if the Programmer has been advised of the possibility of such damages in advance.
All trades you make are your responsibility.
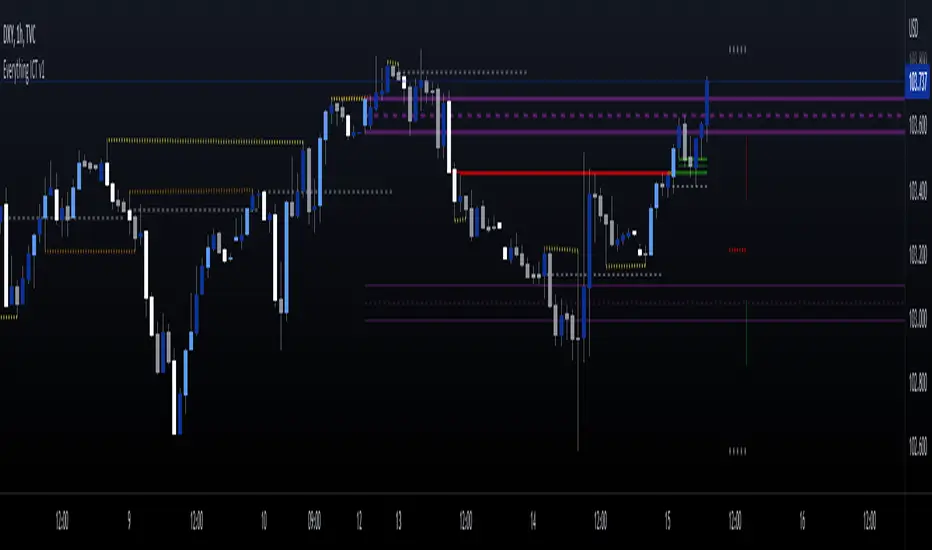
ICT SM Trades PREMIUMIndicator looks for ICT & Smart Money trades on any timeframe. These types of trades reveal how the big institutions, banks and hedge funds trade with big money. If they want their very big positions to be filled they need to find areas in chart where the majority of the money is sitting. Where is it? Where is the majority of orders placed? Right below supports or right above resistance, these orders are stoplosses or stop orders. So they need to push the price to these areas, take all the available stoplosses and trigger all the available stop orders in order to fill their positions and then push the price to the opposite side to make profit (and retail to lose).
Indicator looks for support or resistance (S/R) areas which are represented by dotted lines. This S/R areas are created by minimum of 2 pivot high/low (H/L). Every pivot H/L that creates the S/R area is marked with diamond label. This S/R area is called liquidity. After liquidity is created, indicator looks for liquidity grab (mostly represented by fast spike to this area - it is labeled with x-cross) and then price should go fast to the opposite side of the created structure. Indicator considers as a created structure everything that was created on the other side of the candles from the oldest pivot H/L which creates particular liquidity. For example, if liquidity is created with 3 pivot highs, indicator looks at the oldest pivot high and from there it is looking for the lowest low. Under this lowest low is dashed line which means that this level should be broken with closed candle. This action is called market structure shift (MSS), when the price shifted very fast from highs to lows. After MSS, when the price went fast to one direction, there were some imbalances in prices, in our example selling pressure was a lot bigger than buying pressure and there were created some long untested bearish candles. This untested areas in candles are called imbalances or gaps of fair value gaps (FVG). These are labeled with rectangles. It is expected that these gaps will be tested in near future to "balance the market".
We can put limit orders into these gaps (or into order blocks in PREMIUM indicator) and await some retracement after MSS to open our positions and after the positions are opened we can expect trend continuation in the direction where market structure shift was made (away from liquidity grab). So stoplosses can be placed above/below liquidity grab candle (marked with x-cross).
Alerts can be set for MSS to Long & Short and for liquidity grabs to Long & Short.
All settings of this indicator should be self-explanatory and most of them have tooltips for better understanding.
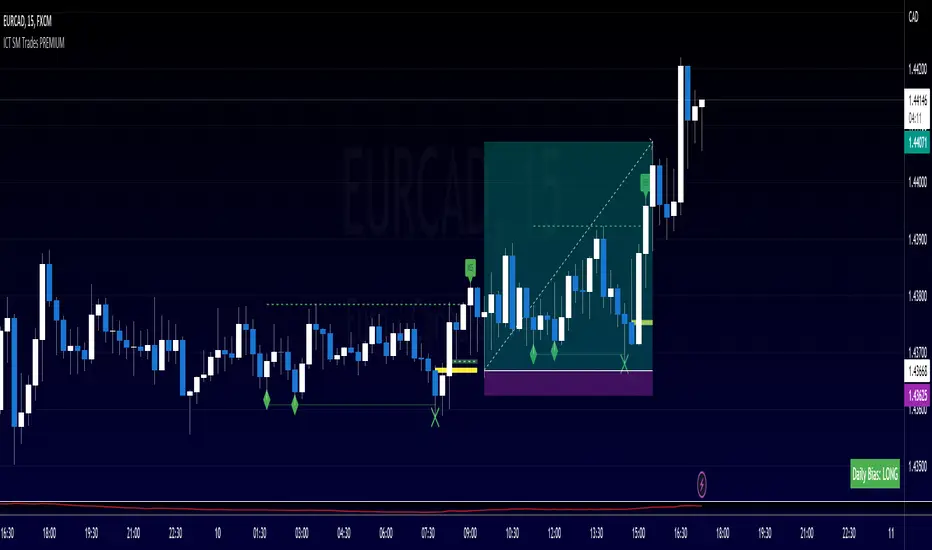
FVG Finder [PLLP]///////////////////////////
ENGLISH (Spanish follows)
///////////////////////////
It is an indicator that shows the FVG (Fair Value Gap) generated by prices in any type of market.
These gaps are important because price generally tends to go through these bounds again and fill in the gaps, which can be a predictor of price action.
As main and differentiating characteristics of this indicator we have that:
Provides key data on each FVG.
It is highly configurable at the behavior level
It is highly configurable on an aesthetic level.
Includes a statistics panel that allows a quick view of the behavior of the FVGs in the asset and work timing.
Basic operation of the indicator:
This indicator draws a box for each FVG it identifies. For each FVG we will have the input level, or 'IN Boundary', and the output level, or 'OUT Boundary'. The box corresponding to the FVG is limited by the 'IN Boundary' and 'OUT Boundary' levels.
Likewise, each FVG will be assigned an 'Entry Price' and an 'Exit Price'.
The entry price or 'Entry Price' is determined as the entry level of the FVG ('IN Boundary') increased according to the 'Entry Percentage'.
The exit price or 'Exit Price' is determined as the exit level of the FVG ('OUT Boundary') decreased according to the 'Exit Percentage'.
The 'Input Percentage' and 'Output Percentage' can vary from 0 to 50:
>>> When the 'Entry Percentage' is set to 0 it means that the 'Entry Price' coincides with the 'IN Boundary' and when it is set to 50 it means that it is set at the central level of the FVG.
>>> When the 'Exit Percentage' is set to 0 it means that the 'Exit Price' matches the 'Exit Limit' and when it is set to 50 it means that it is set at the central level of the FVG.
It will be considered that a FVG can have 3 states:
>>> 'Clean': when the price has never yet reached the 'Entry Price'.
>>> 'Touched': when the price has reached the 'Entry Price' but not the 'Exit Price'.
>>> 'Sunk': when the price has reached the 'Exit Price'.
Within each FVG the following information is displayed:
Icon that represents the state of the FVG.
Percentage of price variation between the 'Entry Price' and the 'Exit Price'.
Date and time the FVG is created.
Date and time when the FVG goes into 'Sunk' status.
Number of times a FVG has been 'touched'.
>>> An FVG is considered to have been 'touched' when a candle pierces the 'Entry Price', that is, when the 'high' of a candle is above the 'Entry Price' and the 'low' below, or vice versa.
>>> The first time a FVG is 'touched' its status changes from 'Clean' to 'Sunk'.
The statistics panel displays the following information for either bullish FVGs (second column), bearish FVGs (third column) or the total FVG set (fourth column) regardless of whether it is bullish or bearish:
Number of FVGs that are in the 'Clean' state, that is, that have never been 'touched'.
Number of FVGs that are in the 'Touched' state, that is, that have been 'touched' at some time but have not yet been drilled to 'Exit Price', that is, they have not yet evolved to the 'Sunk' state .
Number of FVGs that are in the 'Sunk' state.
Number of FVG that the first time you see that they have been 'touched' for the first time have also been 'pierced'. Therefore, it corresponds to the number of FVG in which the first 'touch' of the price manages to reach the 'Exit Price' and, therefore, the status changes directly from 'Clean' to 'Sunk' in that same candle.
Mean number of times a FVG is 'touched' before evolving to the 'Sunk' state. This average is only calculated on the FVG in the 'Sunk' state.
Percentage of FVG in 'Sunk' state with respect to the total FVG.
Percentage of FVG whose 'Exit Price' has been pierced on the same candle in which it has been 'touched' for the first time. In other words, it represents the percentage of FVG that have passed from the 'Clean' to 'Sunk' state in a single candle with respect to the total of FVG in 'Sunk' state.
At the behavioral level, the configuration options stand out for:
Possibility of establishing the percentage for the 'Entry Price' and for the 'Exit Price' of the FVG.
Possibility of establishing the minimum price range percentage between the 'Entry Price' and the 'Exit Price' of the FVG. This makes it possible to hide FVGs that have very small price variations.
Possibility of filtering between which start date and which end date you want to calculate the FVG.
On an aesthetic level, the configuration options stand out for:
Possibility of being able to configure the color of bullish and bearish FVGs depending on their status ('Clean', 'Touched' or 'Sunk').
Possibility of configuring the color and type of the bullish and bearish FVG price entry and exit lines depending on their status ('Clean', 'Touched' or 'Sunk').
Possibility of configuring the color of the candles that have 'touched' a FVG (they have pierced the 'Entry Price') and of those that have pierced the 'Exit Price' (they have made it evolve to the 'Sunk' state) .
Possibility of using a custom icon within the FVG text depending on its status.
Possibility of showing, or not, the FVGs in 'Sunk' state. This allows to have a vision only of the 'past of the FVG' or only of the 'future of the FVG' (those that have not yet been sunk).
Possibility of showing, or not, the FVGs in NO 'Sunk' state. This allows to have a vision only of the 'past of the FVG' or only of the 'future of the FVG' (those that have not yet been sunk).
Possibility to show, or not, the number of times a FVG has been 'touched'.
Possibility of showing, or not, when the FVG is created and when it goes to 'Sunk' status.
Possibility of showing, or not, the statistics panel as well as choosing its location, the colors of the cells and the font size.
WARNING:
1) Due to TradingView's limitations on the number of boxes and lines that can be added to a chart, it is advisable to always apply a value of no less than '0.1' for the 'Minimum FVG price travel' setting.
2) Due to the internal calculations that this indicator requires, the loading time can be long. In the event that the indicator does not load and a 'time out' error is obtained, the value of the 'Minimum FVG price travel' configuration parameter must be increased, thus reducing the number of FVGs that will be identified.
///////////////////////////
ESPAÑOL
///////////////////////////
Se trata de un indicador que muestra los FVG (Fair Value Gap) que generan los precios en cualquier tipo de mercado.
Estos gaps son importantes porque, en general, el precio tiende a pasar por estas cotas nuevamente y rellenar los gaps, lo cual puede constituir una manera de predecir la acción del precio.
Como características principales y diferenciadoras de este indicador tenemos que:
Aporta datos clave de cada FVG.
Es altamente configurable a nivel de comportamiento
Es altamente configurable a nivel estético.
Incorpora un panel de estadísticas que permite obtener de manera rápida una visión del comportamiento de los FVG en el activo y temporalidad de trabajo.
Funcionamiento básico del indicador:
Este indicador dibuja un recuadro para cada FVG que identifica. Para cada FVG tendremos el nivel de entrada, o 'IN Boundary', y el nivel de salida u 'OUT Boundary'. El recuadro que corresponde al FVG queda limitado por los niveles 'IN Boundary' y 'OUT Boundary'.
Asimismo, a cada FVG se le asignará un 'Entry Price' y un 'Exit Price'.
El precio de entrada o 'Entry Price' se determina como el nivel de entrada del FVG ('IN Boundary') incrementado según el 'Entry Percentage'.
El precio de salida o 'Exit Price' se determina como el nivel de salida del FVG ('OUT Boundary') decrementado según el 'Exit Percentage'.
El 'Entry Percentage' y 'Exit Percentage' pueden variar de 0 a 50:
>>> Cuando el 'Entry Percentage' se establece a 0 significa que el 'Entry Price' coincide con el 'IN Boundary' y cuando se establece a 50 significa que se establece al nivel central del FVG.
>>> Cuando el 'Exit Percentage' se establece a 0 significa que el 'Exit Price' coincide con el 'OUT Boundary' y cuando se establece a 50 significa que se establece al nivel central del FVG.
Se considerará que un FVG puede tener 3 estados:
>>> 'Clean': cuando el precio aun no ha alcanzado nunca el 'Entry Price'.
>>> 'Touched': cuando el precio ha alcanzado el 'Entry Price' pero no el 'Exit Price'.
>>> 'Sunk': cuando el precio ha alcanzado el 'Exit Price'.
Dentro de cada FVG se muestra la siguiente información:
Icono que representa el estado del FVG.
Porcentaje de variación del precio entre el 'Entry Price' y el 'Exit Price'.
Fecha y hora en que se crea el FVG.
Fecha y hora en que se el FVG pasa a estado 'Sunk'.
Número de veces en que un FVG ha sido 'tocado'.
>>> Se considera que un FVG ha sido 'tocado' cuando una vela perfora el 'Entry Price', es decir, cuando el 'high' de una vela está por encima del 'Entry Price' y el 'low' por debajo, o viceversa.
>>> La primera vez que un FVG es 'tocado' su estado pasa de 'Clean' a 'Sunk'.
El panel de estadísticas muestra las siguientes informaciones tanto para los FVG alcistas (segunda columna), los FVG bajistas (tercera columna) o el conjunto del total de FVG (cuarta columna) sin importar si es alcista o bajista:
Número de FVG que están en estado 'Clean', es decir, que nunca han sido 'tocados'.
Número de FVG que están en estado 'Touched', es decir, que alguna vez han sido 'tocados' pero aún no han sido perforados hasta el 'Exit Price', es decir, aún no han evolucionado al estado 'Sunk'.
Número de FVG que están en estado 'Sunk'.
Número de FVG que la primera vez que en la misma vea en que han sido 'tocados' por primera vez también han sido 'perforados'. Se corresponde, por lo tanto, el número de FVG en que el primer 'toque' el precio consigue alcanzar el 'Exit Price' y, por lo tanto, el estado pasa en esa misma vela de 'Clean' a 'Sunk' directamente.
Media del número de veces que un FVG es 'tocado' antes de evolucionar hasta el estado 'Sunk'. Esta media solo se calcula solamente sobre los FVG en estado 'Sunk'.
Porcentaje de FVG en estado 'Sunk' respecto el total de FVG.
Porcentaje de FVG cuyo 'Exit Price' ha sido perforado en la misma vela en que ha sigo 'tocado' por primera vez. Es decir, representa el porcentaje de FVG que han pasado del estado 'Clean' a 'Sunk' en una única vela respecto el total de FVG en estado 'Sunk'.
A nivel de comportamiento las opciones de configuración destacan por:
Posibilidad de establecer el porcentaje para el 'Entry Price' y para el el 'Exit Price' del FVG.
Posibilidad de establecer el porcentaje mínimo de recorrido del precio entre el 'Entry Price' y el 'Exit Price' del FVG. Esto permite ocultar los FVG que presenten variaciones muy pequeñas del precio.
Posibilidad de filtrar entre qué fecha inicio y qué fecha fin se desea calcular los FVG.
A nivel estético las opciones de configuración destacan por:
Posibilidad de poder configurar el color de los FVG alcistas y bajistas en función de su estado ('Clean', 'Touched' o 'Sunk').
Posibilidad de configurar el color y tipo de las líneas de entrada y salida del precio de los FVG alcistas y bajistas en función de su estado ('Clean', 'Touched' o 'Sunk').
Posibilidad de configurar el color de las velas que han 'tocado' un FVG (han perforado el 'Entry Price') y del de las que han perforado el 'Exit Price' (lo han hecho evolucionar al estado 'Sunk').
Posibilidad de utilizar un icono personalizado dentro del texto del FVG dependiendo del estado de éste.
Posibilidad de mostrar, o no, los FVG en estado 'Sunk'. Esto permite tener una visión únicamente del 'pasado de los FVG' o bien únicamente del 'futuro de los FVG' (los que aún no han sido hundidos).
Posibilidad de mostrar, o no, los FVG en estado NO 'Sunk'. Esto permite tener una visión únicamente del 'pasado de los FVG' o bien únicamente del 'futuro de los FVG' (los que aún no han sido hundidos).
Posibilidad de mostrar, o no, el número de veces que un FVG ha sido 'tocado'.
Posibilidad de mostrar, o no, cuándo se crea el FVG y cuándo pasa a estado 'Sunk'.
Posibilidad de mostrar, o no, el panel de estadísticas así como de elegir la ubicación de éste, los colores de las celdas y el tamaño de la fuente.
ADVERTENCIA:
1) Debido a las limitaciones de TradingView respecto el número de cajas y líneas que se pueden añadir a un gráfico, es aconsejable aplicar siempre un valor no inferior a '0.1' para el parámetro de configuración 'Minimum FVG price travel'.
2) Debido a los cálculos internos que requiere este indicador el tiempo de carga puede ser elevado. En el caso de que el indicador no se cargue y se obtenga un error de 'time out' debe incrementarse el valor del parámetro de configuración 'Minimum FVG price travel' reduciéndose así la cantidad de FVG que se identificarán.

Gap Size Outcome Statistics [vnhilton]This indicator displays a table with statistics showing the outcomes of gap ups or downs based on your threshold (i.e. does the day end in green or red?). This can be useful for trading, where you're using relevant ETFs & see that they've gapped up/down, & can assume based on statistics that the ETF will end in green/red depending on which has the higher probability (however, you can use these on any other instruments such as stocks to find edges e.g. seeing whether stock XYZ is more likely to end in green/red when it gaps up 100%).
The table also includes sample sizes for your threshold tests for more confidence in the statistics, & also displays average gap up & downs & their respective sample sizes as well. This indicator is intended to be used on the daily timeframe, but can be used on lower or higher timeframes if you prefer.
In the chart snapshot image above, we can see that when the SPY gaps up > 1%, the day is more likely to end in green than in red. But when the SPY gaps down < -1%, it's also more likely to end in green than in red.
( IMPORTANT NOTE : There's 1 limitation with this indicator & it's that it assumes that days where close=open are green days, & that 0% gaps exact are considered gap ups.)
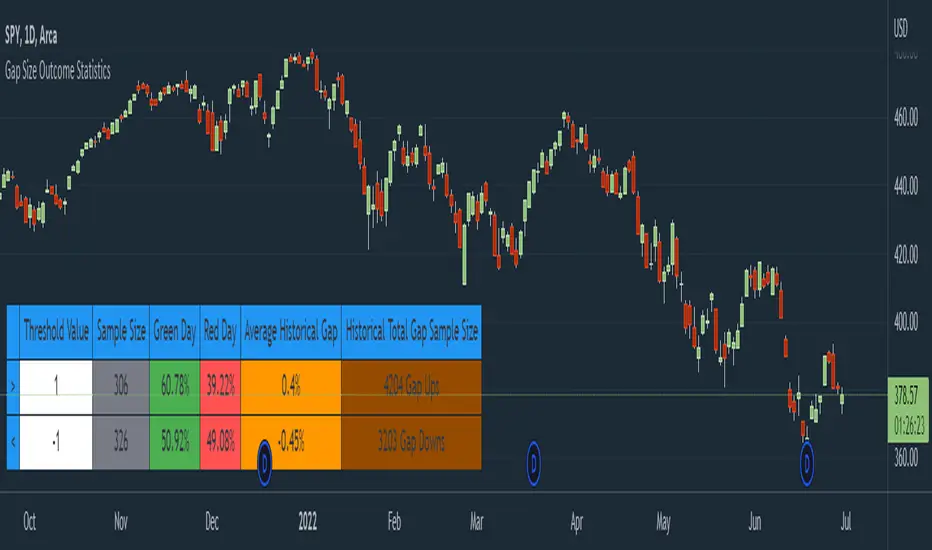
Fair Value Gap by AncheIndicator that plots boxes for fair value gaps (also known as imbalances or inefficiencies)
fair value gaps are a very useful concept in price action trading, as they provide a trader with information about where a lot of orders were injected creating this inefficiency in the market. This inefficiency can become a magnet for price in the future to resolve this inefficiency as there are many resting orders. A trader can use this information to target a fair value gap, or to look for a potential entry for a long/short making it a good POI.
you have the possible to extend boxes to the right of the screen or to edit their width
fair value gaps tend to get mitigated, to restore the balance. This indicator gives you the option to define a mitigation using a full fill or a 0.5 fill. You can also define what to use for mitigation: candle bodies or candle wicks.
there are some other indicators for fair value gaps, although I haven't found one that let's me define a 0.5 mitigation, this indicator suits my trading style
CME:BTC1! RTA-V2.0CME:BTC1!缺口指标 RTA-V2.0 来自RTA学院,作者STAR
指标作用:
用于查看CME:BTC1!品种缺口回补情况,根据历史回测,CME缺口产生后大概率会回补,所以CME缺口对未来行情有一定参考价值
功能说明:
可自行选择查看完全未回补缺口和部分未回补缺口
可自定义缺口颜色、透明度
支持缺口在图标上以表格形式显示、可自定义表格颜色
支持只显示特定加个之上的缺口
适用范围:所有时间范围小于1D的BTC图表
有任何意见或者建议请联系作者,联系方式请看签名
-----------------------------------------------------------------
以下英文为谷歌翻译
CME: BTC1! Gap indicator RTA-V2.0 from RTA Academy, author STAR
Indicator function:
It is used to check the CME:BTC1! variety gap covering situation. According to historical backtests, there is a high probability that the CME gap will be covered after it is generated, so the CME gap has a certain reference value for the future market.
Function Description:
You can choose to view completely unfilled gaps and partial unfilled gaps
Customizable notch color and transparency
Support gaps to be displayed in table form on the icon, and table colors can be customized
Support to display only the gaps above a specific plus
Scope of application: all BTC charts with a time range of less than 1D
If you have any comments or suggestions, please contact the author, please see the signature for contact information

How to avoid repainting when using security() - PineCoders FAQNOTE
The non-repainting technique in this publication that relies on bar states is now deprecated, as we have identified inconsistencies that undermine its credibility as a universal solution. The outputs that use the technique are still available for reference in this publication. However, we do not endorse its usage. See this publication for more information about the current best practices for requesting HTF data and why they work.
This indicator shows how to avoid repainting when using the security() function to retrieve information from higher timeframes.
What do we mean by repainting?
Repainting is used to describe three different things, in what we’ve seen in TV members comments on indicators:
1. An indicator showing results that change during the realtime bar, whether the script is using the security() function or not, e.g., a Buy signal that goes on and then off, or a plot that changes values.
2. An indicator that uses future data not yet available on historical bars.
3. An indicator that uses a negative offset= parameter when plotting in order to plot information on past bars.
The repainting types we will be discussing here are the first two types, as the third one is intentional—sometimes even intentionally misleading when unscrupulous script writers want their strategy to look better than it is.
Let’s be clear about one thing: repainting is not caused by a bug ; it is caused by the different context between historical bars and the realtime bar, and script coders or users not taking the necessary precautions to prevent it.
Why should repainting be avoided?
Repainting matters because it affects the behavior of Pine scripts in the realtime bar, where the action happens and counts, because that is when traders (or our systems) take decisions where odds must be in our favor.
Repainting also matters because if you test a strategy on historical bars using only OHLC values, and then run that same code on the realtime bar with more than OHLC information, scripts not properly written or misconfigured alerts will alter the strategy’s behavior. At that point, you will not be running the same strategy you tested, and this invalidates your test results , which were run while not having the additional price information that is available in the realtime bar.
The realtime bar on your charts is only one bar, but it is a very important bar. Coding proper strategies and indicators on TV requires that you understand the variations in script behavior and how information available to the script varies between when the script is running on historical and realtime bars.
How does repainting occur?
Repainting happens because of something all traders instinctively crave: more information. Contrary to trader lure, more information is not always better. In the realtime bar, all TV indicators (a.k.a. studies ) execute every time price changes (i.e. every tick ). TV strategies will also behave the same way if they use the calc_on_every_tick = true parameter in their strategy() declaration statement (the parameter’s default value is false ). Pine coders must decide if they want their code to use the realtime price information as it comes in, or wait for the realtime bar to close before using the same OHLC values for that bar that would be used on historical bars.
Strategy modelers often assume that using realtime price information as it comes in the realtime bar will always improve their results. This is incorrect. More information does not necessarily improve performance because it almost always entails more noise. The extra information may or may not improve results; one cannot know until the code is run in realtime for enough time to provide data that can be analyzed and from which somewhat reliable conclusions can be derived. In any case, as was stated before, it is critical to understand that if your strategy is taking decisions on realtime tick data, you are NOT running the same strategy you tested on historical bars with OHLC values only.
How do we avoid repainting?
It comes down to using reliable information and properly configuring alerts, if you use them. Here are the main considerations:
1. If your code is using security() calls, use the syntax we propose to obtain reliable data from higher timeframes.
2. If your script is a strategy, do not use the calc_on_every_tick = true parameter unless your strategy uses previous bar information to calculate.
3. If your script is a study and is using current timeframe information that is compared to values obtained from a higher timeframe, even if you can rely on reliable higher timeframe information because you are correctly using the security() function, you still need to ensure the realtime bar’s information you use (a cross of current close over a higher timeframe MA, for example) is consistent with your backtest methodology, i.e. that your script calculates on the close of the realtime bar. If your system is using alerts, the simplest solution is to configure alerts to trigger Once Per Bar Close . If you are not using alerts, the best solution is to use information from the preceding bar. When using previous bar information, alerts can be configured to trigger Once Per Bar safely.
What does this indicator do?
It shows results for 9 different ways of using the security() function and illustrates the simplest and most effective way to avoid repainting, i.e. using security() as in the example above. To show the indicator’s lines the most clearly, price on the chart is shown with a black line rather than candlesticks. This indicator also shows how misusing security() produces repainting. All combinations of using a 0 or 1 offset to reference the series used in the security() , as well as all combinations of values for the gaps= and lookahead= parameters are shown.
The close in the call labeled “BEST” means that once security has reached the upper timeframe (1 day in our case), it will fetch the previous day’s value.
The gaps= parameter is not specified as it is off by default and that is what we need. This ensures that the value returned by security() will not contain na values on any of our chart’s bars.
The lookahead security() to use the last available value for the higher timeframe bar we are using (the previous day, in our case). This ensures that security() will return the value at the end of the higher timeframe, even if it has not occurred yet. In our case, this has no negative impact since we are requesting the previous day’s value, with has already closed.
The indicator’s Settings/Inputs allow you to set:
- The higher timeframe security() calls will use
- The source security() calls will use
- If you want identifying labels printed on the lines that have no gaps (the lines containing gaps are plotted using very thick lines that appear as horizontal blocks of one bar in length)
For the lines to be plotted, you need to be on a smaller timeframe than the one used for the security() calls.
Comments in the code explain what’s going on.
Look first. Then leap.

Gap Gain Test V1.0 by @overratedtraderOddball indicators for entertainment purposes only. This is best used on daily chart.
Look at the 20 ALMA to gauge likelihood of stock following its up or down gap.
- if above the 20 ALMA , follow the gap direction
- if below the 20 ALMA , take counter trend trade
If stock gaps up AND closes higher than it opens, that gain % (close/open) is colored green and if stock gaps down and closes lower than it opens, that gain % (close/open) is colored green
Conversely if the stock gaps up BUT closes lower than it opens, red and if a stop gaps down but closes higher than it opens, red.
Enjoy and follow me on twitter @overratedtrader for more nonsensical and out-of-the-box ideas.

Student Wyckoff Relative StrengthSTUDENT WYCKOFF Relative Strength compares one instrument against another and plots their relative performance as a single line.
Instead of asking “is this chart going up or down?”, the script answers a more practical question: “is THIS asset doing better or worse than my benchmark?”
━━━━━━━━━━
1. Concept
━━━━━━━━━━
The indicator builds a classic relative strength (RS) line:
• Main symbol = the chart you attach the script to.
• Benchmark symbol = any symbol you choose in the settings (index, ETF, sector, another coin, etc.).
RS is calculated as:
RS = Price(main symbol) / Price(benchmark)
If RS is rising, your symbol outperforms the benchmark.
If RS is falling, your symbol underperforms the benchmark.
You can optionally normalize RS from the first bar (start at 1 or 100) to clearly see how many times the asset has outperformed or lagged behind over the visible history.
This is not a “buy/sell” indicator. It is a **context tool** for rotation, selection and Wyckoff-style comparative analysis.
━━━━━━━━━━
2. How the RS line is built
━━━━━━━━━━
Inputs:
• Source of main symbol – default is close, but you can choose any OHLC/HL2/typical price etc.
• Benchmark symbol – ticker used as reference (index, sector, futures, Bitcoin, stablecoin pair, etc.).
• Benchmark timeframe – by default the current chart timeframe is used, or you can force a different TF.
The script uses `request.security()` with `lookahead_off` and `gaps_off` to pull benchmark prices **without look-ahead**.
A small epsilon is used internally to avoid division by zero when the benchmark price is very close to 0.
Normalization options:
• Normalize RS from first bar – if enabled, the very first valid RS value becomes “1” (or 100), and all further values are expressed relative to this starting point.
• Multiply RS by 100 – purely cosmetic; makes it easier to read RS as a “percentage-like” scale.
━━━━━━━━━━
3. Smoothing and color logic
━━━━━━━━━━
To help read the trend of relative strength, the script calculates a simple moving average of the RS line:
• RS MA length – period of smoothing over the RS values.
• Show RS moving average – toggle to display or hide this line.
Color logic:
• When RS is above its own MA → the line is drawn with the “stronger” color.
• When RS is below its MA → the line uses the “weaker” color.
• When RS is close to its MA → neutral color.
Optional background shading:
• When RS > RS MA → background can be tinted softly green (phase of relative strength).
• When RS < RS MA → background can be tinted softly red (phase of relative weakness).
This makes it easy to read the **trend of strength** at a glance, without measuring every small swing.
━━━━━━━━━━
4. How to interpret it
━━━━━━━━━━
Basic reading rules:
• Rising RS line
– The main symbol is outperforming the benchmark.
– In Wyckoff terms, this can indicate a leader within its group, or a sign of accumulation relative to the market.
• Falling RS line
– The main symbol is underperforming the benchmark.
– Can point to laggards, distribution, or simply an asset that is “dead money” compared to alternatives.
• Flat or choppy RS line
– No clear edge versus the benchmark; performance is similar or rotating back and forth.
With normalization on:
• RS > 1 (or > 100) – the asset has grown more than the benchmark since the starting point.
• RS < 1 (or < 100) – it has grown less (or fallen more) than the benchmark over the same period.
The RS moving average and colored background highlight whether this outperformance/underperformance is a **temporary fluctuation** or a more sustained phase.
━━━━━━━━━━
5. Practical uses
━━━━━━━━━━
This indicator is useful for:
• **Selecting stronger assets inside a group**
– Compare individual stocks vs an index, sector, or industry ETF.
– Compare altcoins vs BTC, ETH, or a crypto index.
– Prefer charts where RS is in a sustained uptrend rather than just price going “up on its own”.
• **Monitoring sector and rotation flows**
– Attach the script to sector ETFs or major coins and switch the benchmark to a broad market index.
– See where capital is rotating: which areas are gaining or losing strength over time.
• **Supporting Wyckoff-style analysis**
– Use RS together with volume, structure, phases and trading ranges.
– A breakout or SOS with rising RS vs the market tells a different story than the same pattern with falling RS.
• **Portfolio review and risk decisions**
– When an asset shows a long period of relative weakness, it may be a candidate to reduce or replace.
– When RS turns up from a long weak phase, it can signal the start of potential leadership (not an entry by itself, but a reason to study the chart deeper).
━━━━━━━━━━
6. Notes and disclaimer
━━━━━━━━━━
• Works on any symbol and timeframe available on TradingView.
• The last bar can change in real time as new prices arrive; this is normal behaviour for all indicators that depend on current close.
• There are no built-in alerts or trading signals – this tool is meant to support your own analysis and trading plan.
This script is published for educational and analytical purposes only.
It does not constitute financial or investment advice and does not guarantee any performance. Always test your ideas, understand the logic of your tools and use proper risk management.

Bitcoin vs M2 Global Liquidity (Lead 3M) - Table Ticker═══════════════════════════════════════════════════════════════
Bitcoin vs M2 Global Liquidity - Regression Indicator
═══════════════════════════════════════════════════════════════
TECHNICAL SPECS
• Pine Script v6
• Overlay: false (separate pane)
• Data sources: 5 M2 series + 4 FX pairs (request.security)
• Calculation: Rolling OLS linear regression with configurable lead
• Output: Regression line + ±1σ/±2σ confidence bands + R² ticker
CORE FUNCTIONALITY
Aggregates M2 money supply from 5 central banks (CN, US, EU, JP, GB),
converts to USD, applies time-lead, runs rolling linear regression
vs Bitcoin price, plots predicted value with confidence intervals.
CONFIGURABLE PARAMETERS
Input Controls:
• Lead Period: 0-365 days (default: 90)
• Lookback Window: 50-2000 bars (default: 750)
• Bands: Toggle ±1σ and ±2σ visibility
• Colors: BTC, M2, regression line, confidence zones
• Ticker: Position, size, colors, transparency
Advanced Settings:
• Table display: R², lead, M2 total, country breakdown (%)
• Ticker customization: 9 position options, 6 text sizes
• Border: Width 0-10px, color, outline-only mode
DATA AGGREGATION
Sources (via request.security):
• ECONOMICS:CNM2, USM2, EUM2, JPM2, GBM2
• FX_IDC:CNYUSD, JPYUSD (others: FX:EURUSD, GBPUSD)
• Conversion: All M2 → USD → Sum / 1e12 (trillions)
REGRESSION ENGINE
• Arrays: m2Array, btcArray (dynamic sizing, auto-trim)
• Window: Rolling (lookbackPeriod bars)
• Lead: Time-shift via array indexing (i + leadPeriodDays)
• Calc: Manual OLS (covariance/variance), no built-in ta functions
• Outputs: slope, intercept, r2, stdResiduals
CONFIDENCE BANDS
±1σ and ±2σ calculated from standard deviation of residuals.
Fill zones between upper/lower bounds with configurable transparency.
ALERTS
5 pre-configured alertcondition():
• Divergence > 15%
• Price crosses ±1σ bands (up/down)
• Price crosses ±2σ bands (up/down)
TICKER TABLE
Dynamic table.new() with 9 rows:
• R² value (4 decimals)
• Lead period (days + months)
• M2 Global total (trillions USD)
• Country breakdown: CN, US, EU, JP, GB (absolute + %)
• Optional: Hide/show M2 details
VISUAL CUSTOMIZATION
All plot() elements support:
• Color picker inputs (group="Couleurs")
• Line width: 1-3px
• Transparency: 0-100% for zones
• Offset: M2 plot has +leadPeriodDays offset option
PERFORMANCE
• Max arrays size: lookbackPeriod + leadPeriodDays + 200
• Calculations: Only when array.size >= lookbackPeriod + leadPeriodDays
• Table update: barstate.islast (once per bar)
• Request.security: gaps_off mode
CODE STRUCTURE
1. Inputs (lines 7-54)
2. Data fetch (lines 56-76)
3. M2 aggregation (line 78)
4. Array management (lines 84-95)
5. Regression calc (lines 97-172)
6. Prediction + bands (lines 174-183)
7. Plots (lines 185-199)
8. Ticker table (lines 201-236)
9. Alerts (lines 238-246)
DEPENDENCIES
None. Pure Pine Script v6. No external libraries.
LIMITATIONS
• Daily timeframe recommended (1D)
• Requires 750+ bars history for optimal calculation
• M2 data availability: TradingView ECONOMICS feed
• Max lines: 500 (declared in indicator())
CUSTOMIZATION EXAMPLES
• Shorter lookback (200d): More reactive, lower R²
• Longer lookback (1500d): More stable, regime mixing
• No bands: Set showBands=false for clean view
• Different lead: Test 60d, 120d for sensitivity analysis
TECHNICAL NOTES
• Manual OLS implementation (no ta.linreg)
• Array-based lead application (not plot offset)
• M2 values stored in trillions (/ 1e12) for readability
• Residuals array cleared/rebuilt each calculation
OPEN SOURCE
Code fully visible. Modify, fork, analyze freely.
No hidden calculations. No proprietary data.
VERSION
1.0 | November 2025 | Pine Script v6
═══════════════════════════════════════════════════════════════

RSI Value Table – match builtin🧭 Overview
“RSI Value Table – match builtin” displays the exact RSI value (identical to TradingView’s built-in RSI) for any selected timeframe — directly on your chart.
It’s designed for professional traders who need quick RSI confirmation without switching panels or opening multiple indicators.
⚙️ Core Logic
Reads RSI from any timeframe using request.security() with gaps_off and lookahead_off — ensuring a perfect match with the native RSI.
Optional EMA smoothing (non-standard) for visual stability.
Color-coded cell:
🟩 Green → RSI > 50 (bullish momentum)
🟥 Red → RSI < 50 (bearish momentum)
🟨 Yellow → Neutral zone around 50
Adjustable table position: top/bottom, left/right corners.
⚡ Alerts
Built-in alert conditions trigger automatically:
RSI > 50 → bullish momentum confirmation.
RSI < 50 → bearish momentum confirmation.
📈 How to Use
Select your preferred RSI timeframe (e.g., Daily, Weekly, 4H).
Watch the color-coded cell:
Green → trade long bias only.
Red → short bias only.
Ideal as a confirmation module for multi-timeframe systems or smart signal engines.

ADX MTF mura visionOverview
ADX MTF — mura vision measures trend strength and visualizes a higher-timeframe (HTF) ADX on any chart. The current-TF ADX is drawn as a line; the HTF ADX is rendered as “step” segments to reflect closed HTF bars without repainting. Optional soft fills highlight the 20–25 (trend forming) and 40–50 (strong trend) zones.
How it works
ADX (current TF) : Classic Wilder formulation using DI components and RMA smoothing.
HTF ADX : Requested via request.security(..., lookahead_off, gaps_off).
When a new HTF bar opens, the previous value is frozen as a horizontal segment.
The current HTF bar is shown as a live moving segment.
This staircase look is expected on lower timeframes.
Auto timeframe mapping
If “Auto” is selected, the HTF is derived from the chart TF:
<30m → 60m, 30–<240m → 240m, 240m–<1D → 1D, 1D → 1W, 1W/2W → 1M, ≥1M → same.
Inputs
DI Length and ADX Smoothing — core ADX parameters.
Higher Time Frame — Auto or a fixed TF.
Line colors/widths for current ADX and HTF ADX.
Fill zone 20–25 and Fill zone 40–50 — optional light background fills.
Number of HTF ADX Bars — limits stored HTF segments to control chart load.
Reading the indicator
ADX < 20: typically range-bound conditions; trend setups require extra caution.
20–25: trend emergence; breakouts and continuation structures gain validity.
40–50: strong trend; favor continuation and manage with trailing stops.
>60 and turning down: possible trend exhaustion or transition toward range.
Note: ADX measures strength, not direction. Combine with your directional filter (e.g., price vs. MA, +DI/−DI, structure/levels).
Non-repainting behavior
HTF values use lookahead_off; closed HTF bars are never revised.
The only moving piece is the live segment for the current HTF bar.
Best practices
Use HTF ADX as a regime filter; time entries with the current-TF ADX rising through your threshold.
Pair with ATR-based stops and a MA/structure filter for direction.
Consider higher thresholds on highly volatile altcoins.
Performance notes
The script draws line segments for HTF bars. If your chart becomes heavy, reduce “Number of HTF ADX Bars.”
Disclaimer
This script is for educational purposes only and does not constitute financial advice. Trading involves risk.
