Elite Zone Master Pro - Advanced Multi-Session Trading System🚀 Elite Zone Master Pro - Advanced Multi-Session Trading System
🎯 ORIGINALITY & UNIQUE VALUE PROPOSITION
Elite Zone Master Pro is NOT a simple mashup of existing indicators. It's a proprietary trading system that combines three distinct methodologies into a unified, synergistic approach:
Multi-Session Zone Analysis - Original algorithm for tracking global market sessions
Dynamic Opening Range Breakout (ORB) - Enhanced ORB with bias-aware signal filtering
Advanced Fair Value Gap Detection - Proprietary FVG identification with smart mitigation tracking
🔧 Why This Combination Works
The power lies in how these components work together, not separately:
Session zones provide market context and volatility windows
ORB system identifies key breakout levels during optimal timeframes
FVG detection pinpoints precise entry locations within the ORB framework
Integrated bias system filters signals based on range direction momentum
🧠 DETAILED METHODOLOGY & CALCULATIONS
🌍 1. Multi-Session Zone Framework
What it does: Tracks and visualizes three major global trading sessions simultaneously.
How it works:
Dynamic zone tracking algorithm that calculates session highs/lows in real-time
Adaptive box rendering that expands/contracts based on actual price movement
Session overlap detection for identifying high-volatility periods
Time-weighted zone positioning using custom timezone calculations
Original concepts:
Simultaneous multi-session visualization (not found in standard session indicators)
Dynamic zone expansion based on volatility, not fixed time periods
Cross-session momentum analysis for bias determination
🎯 2. Enhanced Opening Range Breakout System
What it does: Identifies breakout opportunities from predefined session ranges with intelligent bias filtering.
How it works:
Multi-session ORB calculation: Supports US (16:30-16:45), EU (10:00-10:15), Asian (03:00-03:15), and custom sessions
Dynamic range establishment: Range is built in real-time during active session periods
Bias-aware signal filtering: Two-tier breakout system based on range midpoint momentum
Range direction analysis: Compares current range midpoint to previous session's midpoint
Original methodology:
Range Bias Calculation:
- If Current_Midpoint > Previous_Midpoint = Bullish Bias (+1)
- If Current_Midpoint < Previous_Midpoint = Bearish Bias (-1)
- If Current_Midpoint = Previous_Midpoint = Neutral Bias (0)
Signal Logic:
- Bullish Bias: Standard breakout above range high
- Bearish Bias: Enhanced breakout (range_high + 0.5 * range_width) for bullish signals
- Neutral Bias: Standard breakouts both directions
⚡ 3. Advanced Fair Value Gap (FVG) Detection
What it does: Identifies and tracks fair value gaps with automatic mitigation detection.
How it works:
Three-bar gap analysis: Compares current bar relationships to identify true gaps
Dynamic threshold calculation: Auto-adjusting sensitivity based on market volatility
Smart mitigation tracking: Automatically removes filled gaps from display
Directional bias integration: Color-codes gaps based on their directional implication
Proprietary algorithms:
Bullish FVG Criteria:
- Current_Low > High (gap condition)
- Close > High (confirmation)
- (Current_Low - High ) / High > Threshold (significance filter)
Bearish FVG Criteria:
- Current_High < Low (gap condition)
- Close < Low (confirmation)
- (Low - Current_High) / Current_High > Threshold (significance filter)
Mitigation Logic:
- Bullish FVG: Mitigated when Close < FVG_Low
- Bearish FVG: Mitigated when Close > FVG_High
📈 4. Session-Based Moving Average System
What it does: Calculates moving averages that reset and adapt to session boundaries.
How it works:
Session-aware length calculation: Effective length = min(bars_since_session_start, user_length)
Multiple MA types: EMA, SMA, RMA, WMA, VWMA with session-specific calculations
Dynamic smoothing: Adapts to session length for consistent signals across different session durations
🔄 INTEGRATED SYSTEM SYNERGY
🎯 How Components Work Together
Context Layer: Session zones provide market timing context
Setup Layer: ORB system identifies breakout opportunities within optimal timeframes
Entry Layer: FVG detection pinpoints precise entry levels
Filter Layer: Bias system ensures alignment with momentum direction
Confirmation Layer: Session MA provides trend confirmation
🧭 Signal Generation Process
Step 1: Session Analysis
- Identify active trading session
- Calculate session volatility metrics
- Establish range boundaries
Step 2: Range Bias Calculation
- Compare current vs previous range midpoints
- Assign directional bias (-1, 0, +1)
- Adjust breakout thresholds accordingly
Step 3: Breakout Detection
- Monitor price interaction with range boundaries
- Apply bias-specific breakout criteria
- Generate preliminary signals
Step 4: FVG Confirmation
- Scan for fair value gaps within range
- Validate gap significance using dynamic thresholds
- Provide entry refinement opportunities
Step 5: Signal Validation
- Cross-reference with session MA direction
- Ensure alignment with overall bias
- Output final trading signals
📊 PRACTICAL IMPLEMENTATION
🎯 Trading Strategy Framework
Setup Phase:
Configure session times for your timezone
Enable preferred sessions (US/EU/Asian)
Adjust FVG sensitivity based on instrument volatility
Execution Phase:
Wait for range establishment during active session
Monitor for bias-aligned breakouts
Look for FVG retest opportunities
Enter trades with ORB-based stop losses
Risk Management:
Stop loss placement: Outside ORB range boundaries
Position sizing: Based on range width volatility
Trade direction: Must align with calculated range bias
🎨 UNIQUE VISUAL IMPLEMENTATION
📊 Advanced Visualization Features
Multi-layered zone rendering with transparency controls
Dynamic range boxes that adapt to price movement
Smart label positioning to avoid chart clutter
Color-coded bias indication through range fills
Progressive FVG display with automatic cleanup
🔧 TECHNICAL SPECIFICATIONS
⚙️ Performance Optimizations
Efficient array management for FVG tracking
Memory optimization through historical data cleanup
Smart rendering to prevent chart overload
Error handling for edge cases and invalid timeframes
📈 Compatibility
All timeframes under 1 day
All instruments (Forex, Stocks, Crypto, Futures)
All chart types with overlay capability
Mobile and desktop platform support
🏆 WHAT MAKES THIS DIFFERENT FROM OTHER INDICATORS
❌ Standard ORB indicators: Only show basic range breakouts without bias consideration
❌ Basic FVG indicators: Don't integrate with session analysis or range systems
❌ Session indicators: Simply highlight time periods without actionable trading signals
❌ Moving average indicators: Don't adapt to session dynamics
✅ Elite Zone Master Pro: Combines all elements with proprietary logic for a complete trading system
📋 USE CASES & MARKET APPLICATION
🎯 Primary Applications
Forex day trading during major session overlaps
Index futures scalping using session-specific ranges
Cryptocurrency swing trading with 24/7 session analysis
Stock market opening range breakout strategies
📊 Performance Characteristics
Best performance: During high-volatility session transitions
Optimal timeframes: 1m to 4H for intraday trading
Risk-reward ratios: Typically 1:2 to 1:4 based on range width
Win rate: Higher probability when all components align
This indicator represents months of development combining institutional trading concepts with retail accessibility. It's not just another indicator - it's a complete trading methodology in one comprehensive tool.
In den Scripts nach "gaps" suchen
Unfilled ImbalancesUNFILLED IMBALANCES TRACKER - IDENTIFY HIGH-PROBABILITY REVERSAL ZONES
This advanced indicator automatically detects and tracks unfilled price imbalances (Fair Value Gaps/FVGs) between candle bodies, providing traders with crucial levels where price is likely to return.
METHODOLOGY
This indicator employs an approach to imbalance detection that differs from standard FVG indicators:
1. Body-to-Body Gap Detection: Unlike typical FVG indicators that use wicks, this system exclusively tracks gaps between candle bodies, filtering out noise and focusing on the most significant price inefficiencies.
2. Dynamic Partial Fill Tracking: Our unique algorithm continuously monitors and adjusts imbalance zones as they're partially filled, showing exactly how much of each gap remains unfilled in real-time. This feature helps traders identify the strongest remaining levels.
3. Dual Fill Detection Logic: Proprietary fill detection offers two distinct modes - Distal (gap filled when touched) and Through (requires complete price movement through the entire gap), allowing adaptation to different market behaviors.
KEY FEATURES
Real-Time Imbalance Detection
Identifies body-to-body gaps between consecutive candles
Tracks both bullish and bearish imbalances
Automatically removes filled imbalances from the chart
Advanced Fill Detection Modes
Distal Mode: Imbalance considered filled when price touches the near edge
Through Mode: Requires price to completely trade through the gap
Body Fill Option: Requires candle body (not just wick) to enter the gap zone
Partial Fill Visualization
Watch imbalances shrink in real-time as price partially fills them
Visual representation shows exact percentage of gap remaining
Critical for position sizing and risk management
Flexible Display Options
Full Box Mode: Shows complete imbalance zones
Line Mode: Displays only critical edge levels for cleaner charts
Customizable visual parameters (colors, transparency, line thickness)
Smart Extension Features
Auto-extends visual elements to current price bar
Optional extension into future (0-500 bars)
Statistics table showing active imbalances count and fill rates
TRADING METHODOLOGY
Unfilled imbalances represent areas where price moved too quickly, leaving behind inefficiencies that markets tend to revisit. This indicator helps identify:
High-probability entry zones for trend continuation trades
Logical take profit targets at unfilled gaps
Stop loss placement beyond strong imbalance zones
Market structure breaks when key imbalances are filled
Supply and demand zone identification
HOW TO USE
Apply the indicator to any timeframe (works best on 15m and above)
Configure fill detection mode based on your trading style
Watch for price approaching unfilled imbalance zones
Use partial fill information to gauge zone strength
Combine with your existing strategy for confirmation
TARGET AUDIENCE & BEST PRACTICES
This tool is designed for traders who understand price action and market structure. It works best on:
Liquid instruments with consistent volume
Trending markets where imbalances are more likely to be revisited
Higher timeframes for more reliable signals
LIMITATIONS & CONSIDERATIONS
Imbalances may not always be filled, especially in strong trending markets
Performance varies across different market conditions and instruments
Should be used in conjunction with other analysis methods, not as a standalone system
Gap detection is based on candle closes and may miss intrabar movements
Historical imbalances from many bars ago may lose relevance
SETTINGS EXPLANATION
The indicator includes multiple customization options:
Require Body Fill: Controls whether wicks or bodies must enter gaps
Fill Detection Mode: Choose between Distal or Through modes
Visual Display: Select between boxes or lines
Alert Configuration: Set minimum age before fill alerts trigger
Debug Mode: Learn how the algorithm works with visual feedback
This indicator represents months of research into price inefficiency patterns and provides a systematic approach to identifying and tracking these critical market levels.
Note: Works on all timeframes and markets. Best results on liquid instruments with consistent volume patterns.

Golden Sweep - ZTFGolden Sweep - ZTF: Multi-Confluence Reversal Detection System
Purpose & Methodology:
The Golden Sweep combines six distinct market structure analysis methods into a unified confluence system designed to identify high-probability reversal points at inverse Fair Value Gaps (iFVGs). Rather than relying on single-indicator signals, this system requires simultaneous confirmation across multiple independent market dimensions to filter out noise and reduce false signals.
Core Logic & Technical Approach:
1. Fair Value Gap Analysis Foundation
The system begins by detecting standard Fair Value Gaps (price inefficiencies where gaps exist between candle wicks) and monitors when price returns to fill these gaps, creating inverse FVGs. This forms the base signal trigger.
2. Liquidity Sweep Confirmation Engine
Uses pivot-based swing detection to identify when price has recently swept through key support/resistance levels, indicating stop-loss hunting activity. The algorithm tracks recent liquidity events within a configurable lookback period and correlates them with iFVG formations.
3. VWAP Statistical Positioning
Calculates real-time Volume Weighted Average Price with standard deviation bands. Signals are only validated when price is positioned at statistically significant VWAP deviations (configurable zones), ensuring alignment with institutional flow patterns.
4. Balanced Price Range (BPR) Structure Analysis
Detects overlapping bullish and bearish Fair Value Gaps that create consolidation zones. The system identifies when new iFVGs form within or near these balanced ranges, indicating potential breakout reversals from established accumulation/distribution areas.
5. Turtle Soup Reversal Pattern Recognition
Implements Larry Connors' turtle soup methodology to detect false breakouts. Identifies when price penetrates recent highs/lows but closes back within the prior range, indicating failed breakout attempts that often precede strong reversals.
6. Exhaustion Signal Detection
Employs dual-timeframe momentum analysis using Williams %R methodology with optimized smoothing parameters. Detects overbought/oversold exhaustion conditions and confirms when momentum shifts from extreme readings back toward equilibrium, indicating potential trend exhaustion reversals.
Confluence Requirement Logic:
A Golden Sweep signal only triggers when ALL enabled filters simultaneously confirm within their respective lookback periods. This six-dimensional approach significantly reduces signal frequency while increasing reliability by ensuring multiple market forces align before generating alerts.
Session & Timing Integration:
Incorporates session-based filtering to account for varying market dynamics across trading sessions (NY Open, London Close, etc.), as different sessions exhibit distinct liquidity and volatility characteristics.
Implementation Notes:
All calculations use confirmed bar data to prevent repainting
Configurable lookback periods allow adaptation to different timeframes and market conditions
Visual overlays are optional and independent of signal generation logic
Built-in risk management through signal rarity and confluence requirements
This systematic approach addresses the common problem of indicator overload by creating a structured framework where multiple analysis methods must agree before signaling, resulting in fewer but higher-quality trade opportunities.
⚠️ Disclaimer: This indicator is for educational purposes only. It does not constitute financial advice or a recommendation to buy or sell any security. Trading involves risk — always do your own research and use proper risk management.

ACE FVG & IFVG Trading System1. What the Script Does
The "ACE FVG & IFVG Trading System " is a TradingView Pine Script (version 5) that identifies and trades Fair Value Gaps (FVGs) and Inverse Fair Value Gaps (IFVGs). It offers:
Detection of bullish/bearish FVGs and IFVGs with customizable parameters.
Multiple entry types: regular FVG retracement, Break of Structure (BOS), breakaway gaps, and Immediate/Retrace IFVG entries.
A pending setup system showing potential trades before they trigger.
Risk management with configurable stop loss (SL) and take profit (TP) based on FVG levels, swing points, or risk-reward ratios.
Market structure analysis using swing highs/lows, BOS, and Market Structure Shifts (MSS).
Time filters to restrict trading to specific sessions.
Visualizations including FVG boxes, trade boxes, pivot lines, and labels.
Entry and performance tables displaying trade details and metrics like win rates and P&L by entry type.
2. How It Works
The script is organized into modular sections for efficient execution:
Inputs: Extensive customization options (e.g., FVG size, entry types, SL/TP modes, time filters) grouped for clarity.
Data Structures: Custom types (FVGData, SwingPoint, EntryData) store FVG, pivot, and trade data in arrays.
Utility Functions: Handle calculations like risk-reward ratios, time validation, and trade size filtering.
Swing Point Detection: Uses ta.pivothigh/ta.pivotlow to identify pivots, supporting BOS/MSS and SL/TP calculations.
FVG Detection: Identifies regular FVGs (low > high or high < low ) and IFVGs (mitigated FVGs with immediate or retrace signals).
Entry Logic: Triggers trades based on user-enabled conditions (e.g., retracement, BOS, breakaway gaps) with dynamic SL/TP.
Trade Management: Tracks active/pending trades, updates visualizations (boxes, lines, labels), and handles cancellations/invalidations.
Main Logic: Executes on each bar to detect FVGs, process entries, update trades, and manage visualizations.
Tables: Displays recent trades and performance stats (e.g., win rates by entry type) on the last bar.
Pivot Visualization: Plots swing points with dynamic extensions and mitigation status (solid/dotted lines).
3. How to Use It
Add to TradingView:
Open Pine Editor, paste the script, save it, and add to chart.
Configure Inputs:
Access settings via chart (right-click indicator > Settings).
Adjust:
fvgMinSize for market volatility (e.g., 5 for forex).
Entry types (e.g., enable IFVG, disable breakaway gaps).
SL/TP modes and minimum R:R (e.g., 2.0 for 1:2).
Time filters for active sessions (e.g., 09:30-16:00).
Visual settings (box transparency, table positions).
Interpret Output:
FVG Boxes: Green (bullish), red (bearish), purple (IFVG/mitigated).
Trade Boxes: Gray-green/red-gray (pending), green/red (active), updated for win/loss.
Pivot Lines: Solid (unmitigated), dotted (mitigated).
Tables: Entry table shows trade details; performance table shows win rates/P&L.
Trading:
Monitor pending setups for entry signals.
Enter manually at active trade levels, following SL/TP.
Use performance stats to refine settings.
Test on demo charts and adjust for market/timeframe.
Best Practices:
Use higher timeframes (e.g., 1H, 4H) for less noise.
Combine with other analysis (e.g., support/resistance).
Backtest using TradingView’s replay feature.
Originality
The script is original due to its unique combination of features:
Enhanced IFVG Strategy: Dual Immediate/Retrace IFVG modes with a novel “Immediate Then Retrace” preference.
Pending Setup System: Proactive visualization of potential trades with auto-cancellation.
Granular Performance Tracking: Detailed breakdown of win rates/P&L by entry type (regular FVG, IFVG, breakaway).
Dynamic Pivot Visualization: Real-time mitigation updates (solid to dotted lines).
Modular Design: Custom types and organized logic for extensibility. It builds on general FVG concepts (e.g., from ICT) but implements unique logic and features not found in standard
TradingView FVG scripts, distinguishing it from both open-source and premium indicators.
Credit of Concepts to ICT
Collaborations with JMAC and Timeless

ICT HTF Candles [Pro] (fadi)The ICT HTF Candles shows you multi-timeframe price action by plotting up to six higher timeframe candles on your chart, scaled to real price levels. Set candle counts per timeframe or toggle them off for a clean view, saving you time switching between charts. This helps you spot trends and reversals quickly, align trades with the market’s direction, and time setups like sweeps or bounces better. From scalping on the 1m to swinging on the 4H, it simplifies ICT and Smart Money Concepts (SMC), revealing trend shifts and institutional moves clearly. Once you use it, trading without this clarity just won’t feel right.
Key Features:
In-Depth Price Action Levels
These levels track ICT PD arrays and confluences across timeframes, making it easy to see how price action flows from higher timeframes and what your setup faces. Is your 5m trade about to run into a 1H bearish order block? Did it bounce off a higher timeframe FVG and create an SMT with a correlated asset? They make your chart a clear roadmap to market structure, helping you find strong setups, save time, and align with institutional moves:
Change in State of Delivery (CISD): In ICT trading, CISD marks potential reversal levels on each timeframe by showing the open of the highest series of up (green) candles for a bullish shift or the open of the lowest series of down (red) candles for a bearish shift. These levels are set at the opening price of the first candle in those runs, highlighting where the market turns. The indicator makes these levels easy to spot across timeframes, so you can track reversal points clearly. You can set your own confirmation criteria—a close or wick above/below the CISD line (bearish/bullish) or a close or wick above/below the high/low—to verify the CISD level cross. When confirmed, there is a high probability that we have a change in trend, and a reversal order block forms. CISD helps you track these reversal levels and confirm market shifts, making multi-timeframe analysis straightforward.
Order Blocks: When a CISD level cross is confirmed, the price is now below a series of up (green) candles or above a series of down (red) candles, marking these candles as order blocks that usually support the new trend direction. The indicator shows these levels clearly across timeframes, making it easy to spot high-probability reversal or consolidation areas. Keep in mind that price may sometimes move to mitigate an imbalance, so use your best judgment based on your multi-timeframe analysis to confirm they meet your trading criteria.
Trend Bias: Traders often struggle figuring out market bias—guessing the trend wrong, losing on trades against the flow, or missing how lower and higher timeframes line up. The Trend Bias feature tracks order blocks and change in state of delivery, displaying bullish or bearish trends for each timeframe to help you choose trades that go with the market’s direction. The indicator shows these trends clearly across timeframes, so you can quickly see if the 5m matches the 1H or if you’re going against the bigger trend. This makes it easier to avoid bad trades and make decisions faster, keeping you on track with setups that follow the main trend.
Immediate Rebalance: When looking at price action, you’ll see the market doesn’t usually leave behind many Fair Value Gaps (FVGs). That’s because the market is efficient and always rebalancing any inefficiencies. When the market starts a strong move, the last candle will usually close above the previous candle high (for up moves) or below the low (for down moves). At this point, the market will do one of two things: immediately rebalance by retracing first, or have a small retracement but leave behind an FVG. The Immediate Rebalance feature tracks rebalance levels across multiple timeframes, clearly showing where price rebalances. This helps traders have a better expectation of how the market may need to retrace and anticipate Power of Three (PO3) setups by being ready for a Judas swing to rebalance the imbalance.
Fair Value Gaps and Volume Imbalances: If the market fails to immediately rebalance, it will usually attempt to come back and rebalance it at a later time. FVGs and VIs give you a clear area where the price might be heading if it starts breaking structure on lower timeframes. These inefficiencies—price gaps (FVGs) or aggressive moves (VIs)—show where the market’s working to fix imbalances. The Fair Value Gaps and Volume Imbalances feature tracks these levels across timeframes.
Previous Candle Levels: The Previous Candle Levels feature marks the high, low, and middle of the prior candle on each timeframe, helping you identify key price levels for sweeps, bounces, or breakouts. It tracks the candle’s high and low as its extremes and the middle as the 50% mark, which you can set to calculate using the high-to-low range or the open-to-close range. These levels can provide tradable setups on lower timeframes.
Smart Money Techniques (SMT): What’s an ICT indicator without an SMT feature to track cracks in correlated assets? The ICT HTF Candles monitors your chosen correlated assets, like EUR/USD and GBP/USD or SQ and NQ, for signs of strength or weakness to use as confluence with other features and build the case for A+ setups. The SMT feature spots divergences when one asset makes a higher high or lower low while the other doesn’t follow, hinting at potential reversals or market shifts. It tests SMT using two immediate candles, since higher timeframes (HTFs) create larger gaps on lower timeframes. Traders can easily see these divergence levels, like a 15m SMT lining up with a 1H order block or CISD, helping you confirm high-probability setups and strengthen trade entries with multi-timeframe confluence.

Overnight Bias: Net Long/Short with PercentOvernight bias can assist with NY session gap fades or gap and go trading once the NY session is open.
Some general gap rules are:
1. Gap Direction Aligned with Overnight Bias
Rule: If the NY session gaps up and the overnight bias is Net Long (e.g., >60% of bars above the overnight open), favor longs.
Confirmation: Look for price to hold above overnight open or VWAP.
Invalidation: If price re-enters the overnight range, reassess.
2. Gap Opposing Overnight Bias (Contrarian Setup)
Rule: If the NY opens opposite the overnight bias, expect potential gap fill or reversal.
Trade Bias: Look for retracement back toward the overnight open or VWAP.
Example: Overnight was Net Long, but NY gaps down → wait for reclaim of VWAP to go long, else fade strength.
3. Gap Into Prior Day Value Area (VAH to VAL)
Rule: If the NY session gaps into the prior day value area:
It implies mean reversion behavior.
Expect price to rotate toward the POC (point of control).
Trade Bias: Fade toward POC if overnight bias is balanced or opposite the gap direction.
4. Gap Outside Prior Day Value Area
Rule: A gap above VAH or below VAL suggests potential breakout or new trend day.
Trade Bias: If overnight bias aligns (e.g., gap above VAH + Net Long overnight), consider trend continuation.
Invalidation: If price breaks back inside the prior day value area, watch for failed breakout → fade trade possible.
5. Gap Above Prior Day High / Below Prior Day Low
Rule: This is a true breakout gap.
Above Prior High + Net Long Bias: Look for continuation.
Below Prior Low + Net Short Bias: Look for sell pressure continuation.
Trade Bias: Use pullbacks to the prior high/low or overnight open for continuation setups.
6. Gap Within Prior Day Range
Rule: If the NY open is within the prior day’s high and low, expect chop or balanced conditions.
Trade Bias: Use overnight VWAP and prior POC as decision zones. Be cautious unless a breakout occurs.
7. Failed Gap and Re-entry into Prior Day Range
Rule: If price gaps above prior high but re-enters the prior range, it's a failed breakout.
Trade Bias: Look for a fade back to VAH or POC.
Confirmation: Watch for breakdown below overnight VWAP or failure to hold overnight open.
8. Gap + Overnight VWAP Divergence
Rule: If price gaps opposite the direction of VWAP (e.g., VWAP rising, gap down), wait for confirmation.
Trade Bias: Be cautious with early trades. Bias may flip if VWAP is reclaimed.
9. Gap + Overnight Open Test
Rule: If price opens with a gap and then retests the overnight open, that level becomes a decision zone.
Trade Bias:
Hold above = trend continuation.
Rejection = gap fill or reversal.
10. Unfilled Gap = Trend Bias
Rule: If the gap remains unfilled for the first 30–60 minutes, it increases the odds of a trend day.
Trade Bias: Trade pullbacks in the direction of the gap and overnight bias.
Should anyone have suggestion to add please do so.

FVG + Swings + ConfigurableOverview
This Pine Script v5 indicator highlights Fair Value Gaps (FVGs), plots swing‑high and swing‑low pivots, and marks single breakouts above the last swing‑high or below the last swing‑low by recoloring the breakout candle. Every aspect—gap size, count limits, colors, and feature toggles—is exposed as an input so you can tailor it to your own workflow.
Key Features
Fair Value Gaps
Detects bullish gaps when the high of bar i-2 is below the low of the current bar.
Detects bearish gaps when the low of bar i-2 is above the high of the current bar.
Draws a semi‑transparent rectangle spanning from bar i-2 to bar i + extension.
Automatically deletes oldest boxes when exceeding the user’s “Max FVG Boxes” limit.
Swing‑High / Swing‑Low Pivots
Identifies a swing‑high when the middle candle of a three‑bar sequence has the highest high.
Identifies a swing‑low when the middle candle has the lowest low.
Marks each pivot with a tiny dot above (high) or below (low) the bar.
Single Breakouts
Tracks the most recent swing‑high and swing‑low levels.
On the first close above the last swing‑high (or below the last swing‑low), recolors that single candle.
Prevents repeated coloring until a new swing pivot forms.
Full Customization
Show/Hide toggles for FVGs, swing pivots, breakouts.
Numeric inputs for FVG extension length and maximum retained boxes.
Color pickers for bullish/bearish gaps, swing pivots, and breakout candles.

SMC+The "SMC+" indicator is a comprehensive tool designed to overlay key Smart Money Concepts (SMC) levels, support/resistance zones, order blocks (OB), fair value gaps (FVG), and trap detection on your TradingView chart. It aims to assist traders in identifying potential areas of interest based on price action, swing structures, and volume dynamics across multiple timeframes. This indicator is fully customizable, allowing users to adjust lookback periods, colors, opacity, and sensitivity to suit their trading style.
Key Components and Functionality
1. Key Levels (Support and Resistance)
This section plots horizontal lines representing support and resistance levels based on highs and lows over three distinct lookback periods, plus daily nearest levels.
Short-Term Lookback Period (Default: 20 bars)
Plots the highest high (short_high) and lowest low (short_low) over the specified period.
Visualized as dotted lines with customizable colors (Short-Term Resistance Color, Short-Term Support Color) and opacity (Short-Term Resistance Opacity, Short-Term Support Opacity).
Adjustment Tip: Increase the lookback (e.g., to 30-50) for less frequent but stronger levels on higher timeframes, or decrease (e.g., to 10-15) for scalping on lower timeframes.
Long-Term Lookback Period (Default: 50 bars)
Plots broader support (long_low) and resistance (long_high) levels using a solid line style.
Customizable via Long-Term Resistance Color, Long-Term Support Color, and their respective opacity settings.
Adjustment Tip: Extend to 100-200 bars for swing trading or major trend analysis on daily/weekly charts.
Extra-Long Lookback Period (Default: 100 bars)
Identifies significant historical highs (extra_long_high) and lows (extra_long_low) with dashed lines.
Configurable with Extra-Long Resistance Color, Extra-Long Support Color, and opacity settings.
Adjustment Tip: Use 200-500 bars for monthly charts to capture macro-level key zones.
Daily Nearest Resistance and Support Levels
Dynamically calculates the nearest resistance (daily_res_level) and support (daily_sup_level) based on the current day’s price action relative to historical highs and lows.
Displayed with Daily Resistance Color and Daily Support Color (with opacity options).
Adjustment Tip: Works best on intraday charts (e.g., 15m, 1h) to track daily pivots; combine with volume profile for confirmation.
How It Works: These levels update dynamically as new highs/lows form, providing a visual guide to potential reversal or breakout zones.
2. SMC Inputs (Smart Money Concepts)
This section identifies swing structures, order blocks, fair value gaps, and entry signals based on SMC principles.
SMC Swing Lookback Period (Default: 12 bars)
Defines the period for detecting swing highs (smc_swing_high) and lows (smc_swing_low).
Adjustment Tip: Increase to 20-30 for smoother swings on higher timeframes; reduce to 5-10 for faster signals on lower timeframes.
Minimum Swing Size (%) (Default: 0.5%)
Filters out minor price movements to focus on significant swings.
Adjustment Tip: Raise to 1-2% for volatile markets (e.g., crypto) to avoid noise; lower to 0.2-0.3% for forex pairs with tight ranges.
Order Block Sensitivity (Default: 1.0)
Scales the size of detected order blocks (OBs) for bullish reversal (smc_ob_bull), bearish reversal (smc_ob_bear), and continuation (smc_cont_ob).
Visuals include customizable colors, opacity, border thickness, and blinking effects (e.g., SMC Bullish Reversal OB Color, SMC Bearish Reversal OB Blink Thickness).
Adjustment Tip: Increase to 1.5-2.0 for wider OBs in choppy markets; keep at 1.0 for precision in trending conditions.
Minimum FVG Size (%) (Default: 0.3%)
Sets the minimum gap size for Fair Value Gaps (fvg_high, fvg_low), displayed as boxes with Fair Value Gap Color and FVG Opacity.
Adjustment Tip: Increase to 0.5-1% for larger, more reliable gaps; decrease to 0.1-0.2% for scalping smaller inefficiencies.
How It Works:
Bullish Reversal OB: Detects a bearish candle followed by a bullish break, marking a potential demand zone.
Bearish Reversal OB: Identifies a bullish candle followed by a bearish break, marking a supply zone.
Continuation OB: Spots strong bullish momentum after a prior high, indicating a continuation zone.
FVG: Highlights bullish gaps where price may retrace to fill.
Entry Signals: Plots triangles (SMC Long Entry) when price retests an OB with a liquidity sweep or break of structure (BOS).
3. Trap Inputs
This section detects potential bull and bear traps based on price action, volume, and key level rejections.
Min Down Move for Bear Trap (%) (Default: 1.0%)
Sets the minimum drop required after a bearish OB to qualify as a trap.
Visualized with Bear Trap Color, Bear Trap Opacity, and blinking borders.
Adjustment Tip: Increase to 2-3% for stronger traps in trending markets; lower to 0.5% for ranging conditions.
Min Up Move for Bull Trap (%) (Default: 1.0%)
Sets the minimum rise required after a bullish OB to flag a trap.
Customizable with Bull Trap Color, Bull Trap Border Thickness, etc.
Adjustment Tip: Adjust similarly to bear traps based on market volatility.
Volume Lookback for Traps (Default: 5 bars)
Compares current volume to a moving average (avg_volume) to filter low-volume traps.
Adjustment Tip: Increase to 10-20 for confirmation on higher timeframes; reduce to 3 for intraday sensitivity.
How It Works:
Bear Trap: Triggers when price drops significantly after a bearish OB but reverses up with low volume or support rejection.
Bull Trap: Activates when price rises after a bullish OB but fails with low volume or resistance rejection.
Boxes highlight trap zones, resetting when price breaks out.
4. Visual Customization
Line Width (Default: 2)
Adjusts thickness of support/resistance lines.
Tip: Increase to 3-4 for visibility on cluttered charts.
Blink On (Default: Close)
Sets whether OB/FVG borders blink based on Open or Close price interaction.
Tip: Use "Open" for intraday precision; "Close" for confirmed reactions.
Colors and Opacity: Each element (OBs, FVGs, traps, key levels) has customizable colors, opacity (0-100), border thickness (1-5 or 1-7), and blink effects for dynamic visualization.
How to Use SMC+
Setup: Apply the indicator to any chart and adjust inputs based on your timeframe and market.
Key Levels: Watch for price reactions at short, long, extra-long, or daily levels for potential reversals or breakouts.
SMC Signals: Look for entry signals (triangles) near OBs or FVGs, confirmed by liquidity sweeps or BOS.
Traps: Avoid false breakouts by monitoring trap boxes, especially near key levels with low volume.
Notes:
This indicator is a visual aid and does not guarantee trading success. Combine it with other analysis tools and risk management strategies.
Performance may vary across markets and timeframes; test settings thoroughly before use.
For optimal results, experiment with lookback periods and sensitivity settings to match your trading style.
The default settings are optimal for 1 minute and 10 second time frames for small cap low float stocks.
Continuation OB are Blue.
Bullish Reversal OB color is Green
Bearish Reversal OB color is Red
FVG color is purple
Bear Trap OB is red with a green border and often appears with a Bearish Reversal OB signaling caution to a short position.
Bull trap OB is green with a Red border signaling caution to a long position.
All active OB area are highlighted and solid in color while other non active OB area are dimmed.
My personal favorite setups are when we have an active bullish reversal with an active FVG along with an active Continuation OB.
Another personal favorite is the Bearish reversal OB signaling an end to a recent uptrend.
The Trap OB detection are also a unique and Original helpful source of information.
The OB have a white boarder by default that are colored black giving a simulated blinking effect when price is acting in that zone.
The Trap OB border are colored with respect to direction of intended trap, all of which can be customized to personal style.
All vaild OB zones are shown compact in size ,a unique and original view until its no longer valid.

DB - CME Gap [Multi Asset Auto Detection: BTC,SOL, etc]DB - CME Gap is a pro-grade, zero-maintenance CME gap tracker designed for serious traders.
This script automatically detects unfilled CME futures gaps across a wide range of assets—crypto, equities, bonds, commodities, FX, and agriculture—by pulling the official Friday close from CME’s daily futures data. It visually highlights unfilled weekend gaps and keeps them active on the chart until the price fully crosses through the gap level, offering a reliable view of market inefficiencies that often attract future liquidity.
Whether you're trading BTC, ES, CL, ZN, 6E, or ZC... this tool auto-detects and adjusts to the asset you're charting, so you don’t need to change any settings.
🧠 Key Benefits
Fully Automated – No symbol selection required; works instantly across asset classes
Professional Grade – Clean, minimal visuals with dynamic gap tracking
Always Accurate – Uses CME official daily closes to identify true weekend gaps
Cross-Market Versatility – Supports a broad range of assets without editing code
✅ Features
🔍 Auto Symbol Detection
Automatically identifies whether you're viewing BTC, ETH, SOL, ES, NQ, CL, ZN, 6E, GC, ZC, and more—no input required.
📅 CME Friday Close Logic
Pulls the actual Friday close from CME's daily data to detect accurate gap reference points.
🚨 Weekend Gap Detection
Monitors Friday after-hours, Saturday, and Sunday to detect gaps between CME close and weekend price action.
🧠 Persistent Gap Tracking
Gaps remain active until price fully crosses the gap level—no false closures.
📈 Dynamic Line Drawing
Draws a horizontal line at the gap price and extends it to the point of fill.
🌈 Custom Gradient Shading
Fills the area between the current price and the CME gap with directional color gradients based on price movement.
🎨 User-Configurable Colors
Adjust bull and bear fill color themes to suit your personal style.
🧩 Compatible with All Major Asset Classes
Works with:
Crypto: BTC, ETH, SOL
Equities: ES, NQ, YM, MES, MNQ
Bonds & Rates: ZN, ZB, ZF, ZT, GE
Commodities: CL, GC, NG, BZ, SI
FX: 6E, 6J, 6B
Ags: ZC (Corn), ZS (Soybeans)

Fair Value Gap Finder [Find Better Trades]Fair Value Gap Finder (FVG) – Spot Institutional Imbalances
📈 Identify Key Market Imbalances
The Fair Value Gap Finder automatically detects price inefficiencies where aggressive buying or selling has created an imbalance in liquidity. These gaps, often left by institutional traders, can serve as key areas for price to revisit before continuing its trend.
🔍 How It Works:
Highlights bullish Fair Value Gaps (FVGs) in green, signaling potential support zones.
Highlights bearish Fair Value Gaps (FVGs) in red, signaling potential resistance zones.
Uses ATR-based filtering to eliminate small, insignificant gaps, focusing only on high-probability setups.
Alerts included! Get notified when a valid Fair Value Gap is detected.
📊 How to Trade Using FVGs:
✅ For Buy Trades: Wait for price to return to a bullish FVG and confirm support before entering long.
✅ For Sell Trades: Wait for price to revisit a bearish FVG and confirm resistance before entering short.
✅ Use with candlestick patterns, trend analysis, or volume for additional confirmation.
⚙️ Customizable Settings:
Adjust the ATR Multiplier to control how large a gap must be before triggering a signal.
Enable alerts to stay informed in real time when new FVGs appear.
💡 Why Use This Indicator?
Fair Value Gaps are widely used by professional traders to spot areas of liquidity, making them valuable for scalping, swing trading, and institutional-style trading.
🚀 Add it to your TradingView chart and start trading with precision!

Inverse FVG with Quadrants [Modified]# Inverse FVG with Quadrants
*Modified version of original indicator by **tradeforopp**
## Overview
This advanced Fair Value Gap (FVG) indicator identifies both regular and inverse fair value gaps with precision, displaying them in a visually intuitive quadrant-based system. The enhanced version now features automatic timeframe selection that aligns higher timeframe FVGs with your current chart period for multi-timeframe analysis.
## Key Features
### 🔹 Fair Value Gap Detection
- **Regular FVGs**: Identifies traditional bullish and bearish fair value gaps
- **Inverse FVGs**: Automatically detects and displays inverse fair value gaps when price closes through a regular FVG
- **Quadrant Display**: Shows only the relevant half of each FVG for cleaner visual analysis (upper quadrant for bullish patterns, lower quadrant for bearish)
### 🔹 Smart Timeframe Management
- **Auto Timeframe Selection**: Automatically selects the appropriate higher timeframe based on your current chart:
- 1min → 15min
- 3min → 30min
- 5min → 1h
- 15min → 4h
- 1h → Daily
- 4h → Weekly
- **Manual Override**: Optional manual timeframe selection still available
### 🔹 Visual Customization
- Adjustable colors for both regular and inverse FVGs
- Optional box extension
- Customizable display limits to prevent chart clutter
- Session filtering capabilities
### 🔹 Trading Signals
- FVGs provide potential support/resistance zones and price targets
- Inverse FVGs offer confirmation of trend continuation or reversal
- Alert conditions for new FVG creation, regular FVG, and inverse FVG events
## How to Use
1. Apply the indicator to your chart
2. Enable "Auto Timeframe Selection" for multi-timeframe analysis (recommended)
3. Adjust displacement settings to filter for more significant FVGs
4. Use regular FVGs as potential zones where price may return to fill the gap
5. Watch for inverse FVGs as confirmation signals when price breaks through regular FVGs
This refined indicator combines powerful FVG analysis with automatic timeframe alignment to provide traders with clear, actionable insights across multiple timeframes. Perfect for both intraday traders and swing traders looking for high-probability entry and exit points.
Credits to @tradeforopp for creating the original version of this indicator. This is a modified version with enhanced features while preserving the core functionality.
## Tips
- Blue boxes (FVG+) indicate bullish fair value gaps (potential support)
- Red boxes (FVG-) indicate bearish fair value gaps (potential resistance)
- When price closes through an FVG, watch for the inverse FVG as a confirmation signal
- Use the dashed centerline as a potential target within each FVG

Fair Value Gap Oscillator | Flux Charts💎 GENERAL OVERVIEW
Introducing the new Fair Value Gap Oscillator (FVG Oscillator) indicator! This unique indicator identifies and tracks Fair Value Gaps (FVGs) in price action, presenting them in an oscillator format to reveal market momentum based on FVG strength. It highlights bullish and bearish FVGs while enabling traders to adjust detection sensitivity and apply volume and ATR-based filters for more precise setups. For more information about the process, check the "📌 HOW DOES IT WORK" section.
Features of the new FVG Oscillator:
Fully Customizable FVG Detection
An Oscillator Approach To FVGs
Divergence Markers For Potential Reversals
Alerts For Divergence Labels
Customizable Styling
📌 HOW DOES IT WORK?
Fair Value Gaps are price gaps within bars that indicate inefficiencies, often filled as the market retraces. The FVG Oscillator scans historical bars to identify these gaps, then filters them based on ATR or volume. Each FVG is marked as bullish or bearish according to the trend direction that preceded its formation.
An oscillator is calculated using recent FVGs with this formula :
1. The Oscillator starts as 0.
2. When a new FVG Appears, it contributes (FVG Width / ATR) to the oscillator of the corresponding type.
3. Each confirmed bar, the oscillator is recalculated as OSC = OSC * (1 - Decay Coefficient)
The oscillator aggregates and decays past FVGs, allowing recent FVG activity to dominate the signal. This approach emphasizes current market momentum, with oscillations moving bullish or bearish based on FVG intensity. Divergences are marked where FVG oscillations suggest potential reversals. Bullish Divergence conditions are as follows :
1. The current candlestick low must be the lowest of last 25 bars.
2. Net Oscillator (Shown in gray line by default) must be > 0.
3. The current Bullish FVG Oscillator value should be no more than 0.1 below the highest value from the last 25 bars.
Traders can use divergence signals to get an idea of potential reversals, and use the Net FVG Oscillator as a trend following marker.
🚩 UNIQUENESS
The Fair Value Gap Oscillator stands out by converting FVG activity into an oscillator format, providing a momentum-based visualization of FVGs that reveals market sentiment dynamically. Unlike traditional indicators that statically mark FVG zones, the oscillator decays older FVGs over time, showing only the most recent, relevant activity. This approach allows for real-time insight into market conditions and potential reversals based on oscillating FVG strength, making it both intuitive and powerful for momentum trading.
Another unique feature is the combination of customizable ATR and volume filters, letting traders adapt the indicator to match their strategy and market type. You can also set-up alerts for bullish & bearish divergences.
⚙️ SETTINGS
1. General Configuration
Decay Coefficient -> The decay coefficient for oscillators. Increasing this setting will result in oscillators giving the weight to recent FVGs, while decreasing it will distribute the weight equally to the past and recent FVGs.
2. Fair Value Gaps
Zone Invalidation -> Select between Wick & Close price for FVG Zone Invalidation.
Zone Filtering -> With "Average Range" selected, algorithm will find FVG zones in comparison with average range of last bars in the chart. With the "Volume Threshold" option, you may select a Volume Threshold % to spot FVGs with a larger total volume than average.
FVG Detection -> With the "Same Type" option, all 3 bars that formed the FVG should be the same type. (Bullish / Bearish). If the "All" option is selected, bar types may vary between Bullish / Bearish.
Detection Sensitivity -> You may select between Low, Normal or High FVG detection sensitivity. This will essentially determine the size of the spotted FVGs, with lower sensitivies resulting in spotting bigger FVGs, and higher sensitivies resulting in spotting all sizes of FVGs.
3. Style
Divergence Labels On -> You can switch divergence labels to show up on the chart or the oscillator plot.

Cumulative Volume Delta Strategy | Flux Charts💎 GENERAL OVERVIEW
Introducing the Cumulative Volume Delta Strategy (CVDS) Indicator, an advanced tool designed to enhance trading strategies by identifying potential trend reversals through volume dynamics. This script features integrated order block detection, Fair Value Gaps (FVGs), and a dynamic take-profit (TP) and stop-loss (SL) system. For an in-depth understanding of the strategy, refer to the "HOW DOES IT WORK?" section below.
Features of the new Cumulative Volume Delta Strategy (CVDS) Indicator :
Cumulative Volume Delta-based Strategy
Order Block and Fair Value Gap (FVG) Entry Methods
Dynamic TP/SL System
Customizable Risk Management Settings
Alerts for Buy, Sell, TP, and SL Signals
📌 HOW DOES IT WORK ?
The CVDS indicator operates by tracking the net volume difference between buyers and sellers to identify divergences that could indicate potential trend reversals. A cumulative volume delta (CVD) calculation is employed to measure the intensity of these divergences in relation to price movements. The net volume sum is reset every trading day (can be changed from the settings using the anchor period option), and divergences are detected when the cumulative volume crosses the 0-line over or under.
Once a significant divergence is detected, the indicator identifies breakout points, confirmed by either Fair Value Gaps (FVGs) or Order Blocks (OBs). Depending on your chosen entry mode, the indicator will trigger a buy or sell entry when the confirmation signal aligns with the breakout direction. Alerts for Buy, Sell, Take-Profit, and Stop-Loss are available.
Note that the indicator cannot run on 1-minute and 1-second charts, as it needs to get data from a lower timeframe. 1-minutes & 1-second timeframes are the minimum timeframes in their ranges respectively.
🚩 UNIQUENESS
What sets this indicator apart is the combination of volume divergence analysis with advanced price action tools like Fair Value Gaps (FVGs) and Order Blocks (OBs). The ability to choose between these methods, along with a dynamic TP/SL system that adapts based on volatility, provides flexibility for traders in any market condition. The backtesting dashboard provides metrics about the performance of the indicator. You can use it to tune the settings for best use in the current ticker. The CVD-based strategy ensures that trades are initiated only when meaningful divergences between volume and price occur, filtering out noise and increasing the likelihood of profitable trades.
⚙️ SETTINGS
1. General Configuration
Anchor Period: Time anchor period used in CVD calculation. This is essentially the period that the volume delta sum will be reset. Lower timeframes may result in more entries at the cost of less reliable results.
Entry Mode: Choose between FVGs or OBs to trigger your entries based on the confirmation signals.
Retracement Requirement: Enable to confirm the entry after a retracement toward the FVG or OB.
2. Fair Value Gaps
FVG Sensitivity: Modify the sensitivity of FVG detection, allowing for more or fewer gaps to be considered valid.
3. Order Blocks (OB)
Swing Length: Define the swing length to identify OB formations. Shorter lengths find smaller OBs, while longer lengths detect larger structures.
4. TP / SL
TP / SL Method:
a) Dynamic: The TP / SL zones will be auto-determined by the algorithm based on the Average True Range (ATR) of the current ticker.
b) Fixed : You can adjust the exact TP / SL ratios from the settings below.
Dynamic Risk: The risk you're willing to take if "Dynamic" TP / SL Method is selected. Higher risk usually means a better winrate at the cost of losing more if the strategy fails. This setting is has a crucial effect on the performance of the indicator, as different tickers may have different volatility so the indicator may have increased performance when this setting is correctly adjusted.

Directional Targets & POC TableThe "Directional Targets & POC Table" Pine Script™ is a comprehensive tool designed to help traders identify directional bias, potential price targets, and important levels like the Point of Control (POC). Additionally, it detects fair value gaps (FVGs) and order blocks, which are crucial concepts in Smart Money Concepts (SMC) trading. Here's an overview of its functionality:
1. Indicator Overview:
The script combines multiple technical tools into a single visual aid:
Directional Targets: Fibonacci-based upper and lower targets that provide a forecast of where the price might move.
Point of Control (POC): Midpoint of the daily range, displayed visually on the chart.
Fair Value Gaps (FVGs): Areas of imbalance in the market, potentially leading to price reversals.
Order Blocks: Areas where institutional traders might have entered large positions, potentially serving as support or resistance.
2. Key Features:
Directional Targets & POC Table:
A table is displayed in the top-right corner of the chart, showing:
Direction: Based on whether the price is above or below the POC.
Target ↑: The upper target, calculated using Fibonacci's 0.618 level, which acts as a potential resistance.
POC: The midpoint between the daily high and low, serving as the central level of interest.
Target ↓: The lower target, also calculated using the 0.618 Fibonacci level, which serves as potential support.
The table uses colors to make each level easily distinguishable, with green for bullish targets, red for bearish, and yellow for the POC.
POC Visualization:
The Point of Control (POC) is drawn on the chart as a box that stretches horizontally. It highlights the central price range where the highest volume or interest may have occurred, providing a key level for traders to watch.
The POC can act as a support or resistance area, with price frequently reacting at or near this level.
FVG Detection:
Fair Value Gaps are identified when there’s a price imbalance between two bars. These gaps occur when the high of one bar is lower than the low of a bar two periods earlier, or vice versa.
The script draws lines at the boundaries of these gaps, helping traders spot potential areas where the price may return to fill the gap.
If the price revisits and fills the gap, the FVG lines are automatically deleted, signaling the gap is no longer relevant.
Order Blocks Detection:
Bullish Order Blocks are detected when a strong bullish candle forms, where the close equals the high, and it’s higher than the previous bar’s low. This represents potential institutional buying interest.
Bearish Order Blocks are detected when a strong bearish candle forms, where the close equals the low, and it’s lower than the previous bar’s high, representing potential selling interest.
The order blocks are drawn as rectangles on the chart, marking significant price zones that may act as future support (bullish) or resistance (bearish).
3. Direction Determination:
The script calculates the daily high, low, and mid-point (POC). If the current price is above the POC, the market is deemed bullish; if it’s below, the market is bearish. If it’s near the POC, the market is considered neutral.
This directional bias is then displayed in the table, giving traders an easy way to assess whether they should be looking for long or short opportunities.
4. Use Case:
This script is particularly useful for traders who:
Want to identify key levels like the POC and potential price targets based on Fibonacci retracement.
Follow Smart Money Concepts (SMC) and need tools to detect FVGs and order blocks, which can signal areas of market imbalance or institutional involvement.
Need a simple visual aid to determine market direction and structure, helping them make informed trading decisions.
5. Additional Features:
The script is highly visual, providing both numeric information in a table and plotted elements (lines, boxes) directly on the chart.
The automatic detection and clearing of FVGs and order blocks make this tool dynamic and easy to follow.
The script helps identify areas where price might react, giving traders a roadmap to follow for potential entries, exits, or take-profit levels.
This indicator is designed for traders looking to incorporate both conventional and advanced concepts like Fibonacci targets, POC, and SMC principles (FVGs and Order Blocks) into their strategy.

ICT Balance Price Range [UAlgo]The "ICT Balance Price Range " indicator identifies and visualizes potential balance price ranges (BPRs) on a price chart. These ranges are indicative of periods where the market exhibits balance between bullish and bearish forces, often preceding significant price movements.
🔶 What is Balanced Price Range (BPR) ?
Balanced Price Range is a concept based on Fair Value Gap. Balanced price range (BPR) is the area on price chart where two opposite fair value gaps overlap.
When price approaches the Balanced Price Range (BPR), we assume that the price will react quickly and strongly here. This is because its the combination of two fair value gaps and being a good point of interest for smart money traders.
🔶 Key Features:
Bars to Consider: Determines the number of bars to evaluate for BPR conditions.
Threshold for BPR: Sets the minimum range required for a valid BPR to be identified.
Remove Old BPR: Option to automatically remove invalidated BPRs from the chart.
Bearish/Bullish Box Color: Customizable colors for visual representation of bearish and bullish BPRs.
🔶 Disclaimer
This indicator is provided for educational and informational purposes only.
It should not be considered as financial advice or a recommendation to buy or sell any financial instrument.
The use of this indicator involves inherent risks, and users should employ their own judgment and conduct their own research before making any trading decisions. Past performance is not indicative of future results.
🔷 Related Scripts
Fair Value Gaps (FVG)

SMC Community [algoat] — Smart Money ConceptsEmpower your trading with the core principles of the Smart Money Concepts through interactive features and highly customizable settings.
The indicator's strength lies in the unique SMC Core algorithm, a calculation based on real price action data, capturing every tick from small intraday fluctuations to significant high timeframe movements.
algoat SMC Core is our continually evolving, specialized structure mapping algorithm, serving as the backbone of our price action related publications.
⭐ Key Features
Swing Market Structure: Change of Character, Break of Structure
Recognize and visualize real-time market structures with swing elements. Identify and mark key structural changes in the market to visually highlight shifts in market trends and patterns. This feature is designed to alert you to significant changes in the market's behavior, signaling a potential shift from accumulation to distribution phases, or vice versa. It helps traders adapt their strategies based on evolving market dynamics.
Order Flow: Structure Fractal
Connect the successive structural high and low levels, visualizing the intricate flow of market movements. This feature highlights fractal structures within the market, enabling traders to detect significant price action patterns.
Structure Range: Determine Discount, Premium, and Equilibrium Zones
This feature provides a unique way of visualizing price areas where a security could be overbought or oversold (premium or discount zones) and where the price is expected to be fair and balanced (equilibrium zone). Distance from the current price is displayed in percentage terms, which can assist traders with crucial data for risk management and strategic planning. The Range function helps you identify the most favorable price zones for entries and set your stop-loss and take-profit levels more accurately.
Liquidity Grabs: Reveal Hidden Manipulation Attempts
Identify uncovered market areas where high liquidity trading may take place. Liquidity Grabs help track "smart money" footprints by identifying levels where large institutional traders may have induced liquidity traps. Understanding these traps can aid in avoiding false market moves and optimizing trade entries.
Institutional Interest Zones: Order Blocks and Fair Value Gaps
Uncover areas where bigger orders may be lined up. Reveal zones of interest ordered by volume strength. Receive warnings about market price imbalances.
▸ Order Blocks pinpoint crucial zones where large institutional investors ("smart money") have shown strong buying or selling interest recently. These blocks can serve as a tool for identifying key areas for potential trade entries or exits.
▸ Fair Value Gaps detect discrepancies between the perceived market value and the actual market price, revealing potential areas for price correction. With its mitigation settings, you can fine-tune the FVG detection according to the magnitude of value misalignment you consider significant.
Mitigation types dictate how price interacts with a zone, with order blocks requiring a close through (indicating stronger price movement) and fair value gaps requiring a wick through (hinting at weak rejection).
══════════════════
⭐ Why SMC?
In the ever-evolving trading landscape, mainstream methods and strategies can quickly become outdated as they are widely adopted. Liquidity is constantly sought after, and the best source for this is exploring and exploiting trading strategies that are widely accepted and applied. Currently, one of these strategies is the SMC (Supply, Demand, and Price Action).
It's no coincidence that our educational materials incorporate concepts such as liquidity grabs (LG) and Smart Money Traps (SMT). As the application of SMC gains popularity among retail traders, trading with this approach becomes more challenging. Therefore, the recent focus has been on reforming the SMC methodology, as it is the only method that relies on real price movements and will always work when applied correctly.
The indicator reflects our personal use and deep comprehension of Smart Money Concepts. It provides streamlined tools for tracking algorithmic trends with modern visualizations, without unnecessary clutter.
▸ What does the proper application of SMC entail?
Many SMC traders associate their key areas of interest with the market structure, which is generally considered acceptable. However, depending solely on a single foundation can lead to significant deviations, which may cause notable impacts on trading results. Moreover, if the basis for the market structure calculation is inaccurate, the consequences can be even more severe. It's akin to risking money on a lottery ticket, believing it will be a winner.
Our methodology is different, and it may ensure longevity in the financial markets. The structure remains crucial, but it is not the sole foundation of everything; instead, it serves as a validation tool. Each calculation, such as order blocks (OB), Fair Value Gaps (FVG), liquidity grabs (LG), range analysis, and more, is independent and unique, separate from the structure. However, validation must ultimately come from the structure itself.
We employ individual and high-quality filters: before a function calculation is validated by the structure, it must undergo rigorous testing based on its own set of validation conditions. This approach aims to enhance robustness and accuracy, providing traders with a reliable framework for making informed trading decisions.
▸ An example of structure validation: Order Block with "Swing Sensitivity"
These order blocks will only be displayed and utilized by the script if there is a swing structure validation with a valid break. In other words, the presence of a confirmed swing Change of Character (ChoCh) or Break of Structure (BoS) is essential for the Order Block to be considered valid and relevant.
This approach ensures that the order blocks are aligned with the overall market structure and are not based on isolated or unreliable price movements. Whether it's Fair Value Gaps (FVG), Liquidity Grabs (LG), Range calculations, or other functionalities, the same underlying principle holds true. The background structure calculation serves as a validation mechanism for the data and insights generated by these functions, ensuring they adhere to the specific criteria and rules established within our methodology. By incorporating this robust validation process, traders can have confidence in the reliability and accuracy of the information provided by the indicator, allowing them to make informed trading decisions based on validated data and analysis.
══════════════════
👉 Usage - the general approach
Determine your trading style and build your basic strategy:
The indicator helps you understand your trading style, whether it's swing trading, scalping or another approach. By analyzing the SMC indicator, you gain valuable information about potential market trends, entry and exit points, and overall market sentiment.
Steps:
Identify Trading Style: Determine whether you are a swing trader, scalper, or long-term investor. This will influence how you use the indicator.
Analyze Market Trends: Use the SMC indicator to observe market trends and identify potential entry and exit points.
Adapt Strategies: Adjust your strategies based on the market dynamics revealed by the SMC indicator, such as changes in order flow or market structure.
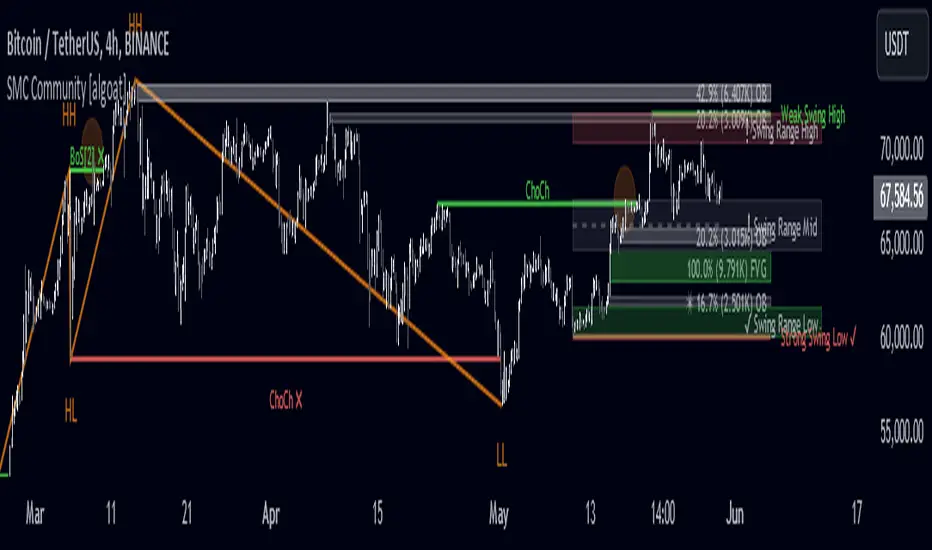
👉 Example of usage
In the following chart, you'll notice how we've utilized the indicator to formulate a strategic trading approach. We've employed Order Blocks equipped with volume parameters to identify crucial market zones. Simultaneously, we've leveraged swing/internal market structures to gain insights into potential long- and short-term market turnarounds. Lastly, we've examined trend line liquidity zones to pinpoint probable impulses and breakouts within ongoing trends.
Now we can see how the price descended to the order block with the highest volume, which we had previously marked as our point of interest for an entry. As the price closed below the median Order Block, we noted its mitigation. After an internal CHoCH, it's directing us towards the main Order Block as a target.
══════════════════
🧠 General advice
Trading effectively requires a range of techniques, experience, and expertise. From technical analysis to market fundamentals, traders must navigate multiple factors, including market sentiment and economic conditions. However, traders often find themselves overwhelmed by market noise, making it challenging to filter out distractions and make informed decisions. By integrating multiple analytical approaches, traders can tailor their strategies to fit their unique trading styles and objectives.
Confirming signals with other indicators
As with all technical indicators, it is important to confirm potential signals with other analytical tools, such as support and resistance levels, as well as indicators like RSI, MACD, and volume. This helps increase the probability of a successful trade.
Use proper risk management
When using this or any other indicator, it is crucial to have proper risk management in place. Consider implementing stop-loss levels and thoughtful position sizing.
Combining with other technical indicators
Integrate this indicator with other technical indicators to develop a comprehensive trading strategy and provide additional confirmation.
Conduct Thorough Research and Backtesting
Ensure a solid understanding of the indicator and its behavior through thorough research and backtesting before making trading decisions. Consider incorporating fundamental analysis and market sentiment into your trading approach.
══════════════════
⭐ Conclusion
We hold the view that the true path to success is the synergy between the trader and the tool, contrary to the common belief that the tool itself is the sole determinant of profitability. The actual scenario is more nuanced than such an oversimplification. A word to the wise is enough: developed by traders, for traders — pioneering innovations for the modern era.
Risk Notice
Everything provided by algoat — from scripts, tools, and articles to educational materials — is intended solely for educational and informational purposes. Past performance does not assure future returns.
CME Gap Oscillator [CryptoSea]Introducing the CME Gap Oscillator , a pioneering tool designed to illuminate the significance of market gaps through the lens of the Chicago Mercantile Exchange (CME). By leveraging gap sizes in relation to the Average True Range (ATR), this indicator offers a unique perspective on market dynamics, particularly around the critical weekly close periods.
Key Features
Gap Measurement : At its core, the CME Oscillator quantifies the size of weekend gaps in the context of the market's volatility, using the ATR to standardize this measurement.
Dynamic Levels : Incorporating a dynamic extreme level calculation, the tool adapts to current market conditions, providing real-time insights into significant gap sizes and their implications.
Band Analysis : Through the introduction of upper and lower bands, based on standard deviations, traders can visually assess the oscillator's position relative to typical market ranges.
Enhanced Insights : A built-in table tracks the frequency of the oscillator's breaches beyond these bands within the latest CME week, offering a snapshot of recent market extremities.
Settings & Customisation
ATR-Based Measurement : Choose to measure gap sizes directly or in terms of ATR for a volatility-adjusted view.
Band Period Adjustability : Tailor the oscillator's sensitivity by modifying the band calculation period.
Dynamic Level Multipliers : Adjust the multiplier for dynamic levels to suit your analysis needs.
Visual Preferences : Customise the oscillator, bands, and table visuals, including color schemes and line styles.
In the example below, it demonstrates that the CME will want to return to the 0 value, this would be considered a reset or gap fill.
Application & Strategy
Deploy the CME Oscillator to enhance your market analysis
Market Sentiment : Gauge weekend market sentiment shifts through gap analysis, refining your strategy for the week ahead.
Volatility Insights : Use the oscillator's ATR-based measurements to understand the volatility context of gaps, aiding in risk management.
Trend Identification : Identify potential trend continuations or reversals based on the frequency and magnitude of gaps exceeding dynamic levels.
The CME Oscillator stands out as a strategic tool for traders focusing on gap analysis and volatility assessment. By offering a detailed breakdown of market gaps in relation to volatility, it empowers users with actionable insights, enabling more informed trading decisions across a range of markets and timeframes.

Price Action SuiteThe TRN Price Action Suite incorporates a treasure trove of time and price action concepts. It includes a set of trading tools that, when combined, allow for a more accurate view of the market. This enables traders to find high probability entry points before the market moves to the next liquidation level.
Features of the TRN Price Action Suite:
(Inverse) Fair Value Gaps (FVG)
Order Blocks (OB)
FVG and OB with Cumulative Volume Delta
Volume Imbalances
Market Structure
Liquidity levels
Sessions
Kill zones/Opening Range
The indicator helps traders to easily identify favorable market conditions and high probability trade setups. It automatically finds time and price action concepts and displays them in an intuitive way on the chart. One of the highlights is the detection of Fair Value Gaps and Order Blocks in connection with Cumulative Volume Delta (approx.). You will not find this connection anywhere else.
Fair Value Gaps (FVGs)
A fair value gap occurs when there are inefficiencies in the market or imbalanced buying and selling pressures. Fair value gaps can become a magnet for the price before continuing in the same direction. Special attention should be paid to FVGs that are supported by support and resistance levels, as these offer a higher probability of success for trades. Additionally, the indicator plots inverse FVG (iFVG). These are FVG that are “closed” by a FVG in the other direction. IFVGs are a strong sign of the market to continue in the direction of the iFVG.
In addition to the FVGs you see on the chart, you can add also FVGs from a higher timeframe including the cumulative buy/sell volume. For this you can set “Timeframe 1” and “Timeframe 2” in the settings to your preferred timeframes. E.g. you trade on a 5-minute chart, and you want to see FVGs from 4 hours and a daily chart, then you set Timeframe 1 to 4 h and to Timeframe 2 to 1 D.
Order Blocks and Volume Imbalances can also be shown from higher timeframes.
Order Blocks (OBs)
Order blocks are areas on the chart where a high concentration of limit orders was found in the past. They can serve as potential support or resistance areas. These represent areas in the market where there is an oversupply (supply) or an excess demand (demand). They are often key zones for potential turning points or continuations of the current trend. A bullish OB, for example, is the last bearish candle before a significant uptrend.
FVGs and OBs with Cumulative Volume Delta
The TRN Price Action Suite can show FVGs and OBs with the corresponding Cumulative Volume Delta (CVD). It is a metric to analyze market dynamics by tracking the net difference between buying and selling volumes over a specific timeframe. It is used to determine the strength of the FVG/OB. The FVG/OB includes two bars on the left side, indicating the cumulative buy volume in green as well es the cumulative sell volume in red. At the right side of the FVG/OB box the ratio of the cumulative buy/sell volume is displayed. A high ratio over 1, for example 1.5, indicates a lot of buying pressure. On the hand, a ratio far below 1, for example 0.66, indicates a lot of selling pressure.
Volume Imbalances (VIBs)
Volume Imbalances indicate a price gap from the previous close, but unlike gaps, there is no absence of trading activity within a specific price range. Bullish VIs have opening and closing prices above the previous close, with overlap between the current low and previous high. Bearish VIs are vice versa.
Market Structure
The market structure represents the dominant trend in the market. It is based on swing highs and lows. For instance, if the price makes higher highs (HH) and higher lows (HL) the market structure represents an uptrend. Vice versa if price makes lower lows (LL) and lower highs (LH) the market trend is down.
If the market structure is up, traders can enter positions in a pullback. For this, a trader could use a FVG or an OB as an entry condition.
Market Structure Shift (MSS) (Change of Character (ChoCh))
A market structure shift occurs when the market transitions from one dominant trend to a different one, often signaling a potential change in the underlying market dynamics. A MSS signals the start of a new trend. It signals the change from an uptrend to a down trend and vice versa. Therefore, it is sometimes called change of character (ChoCh). A valid MSS should ideally occur in a strong supply or demand zone. This indicates that the market may be approaching a trend reversal or consolidation.
Break of Structure (BOS)
A break of structure happens when the market breaks out of its established trading range or pattern. The market continues its dominant trend, indicated by the last MSS.
In an uptrend, for example, each time the price breaks through a new high, a "bullish BOS" is formed. This indicates that the market can overcome previous resistance levels and continue to rise.
Levels
One core concept in trading is that price flows to areas of liquidity. Natural liquidity areas are the current day open, high, low (CDO, CDH, CDL) or the previous day high, low, close (PDH, PDL, PDC). The same is true for the current week (CWO, CWH, CWL) and the previous week (PWH, PWL, PWC).
Pay special attention in case some of these levels are close together. Then these levels serve like a magnet for the price. The TRN Price Action Suite indicator can cluster these levels fully automatically together to give the trader the flexibility to focus solely on the trading part.
Sessions
Sessions are the trading hours during which the banks are actively trading. The three main trading sessions:
Asia: Most of the volume from the Asian players are handled within this session.
London: This is where the European players are most active.
New York: In the New York session all the USA players are active as well as all the other American players. Furthermore, a lot of global players are active in this session as well.
Killzones
A kill zone in trading refers to a specific time period during the trading day when the market experiences increased volatility and liquidity. It is an opportunity for traders to capitalize on potential price movements and generate profits. There are several different killzones during the day.
There are three different types of killzones:
Indices/Futures: This one is suitable if you trade products like the ES, NQ, FDAX, CL or Stocks, Options.
Forex: If you trade Forex this setting will mark the most liquid periods of the day.
Opening Range: In case you trade the opening range of the sessions, use this setting.
Trading Example
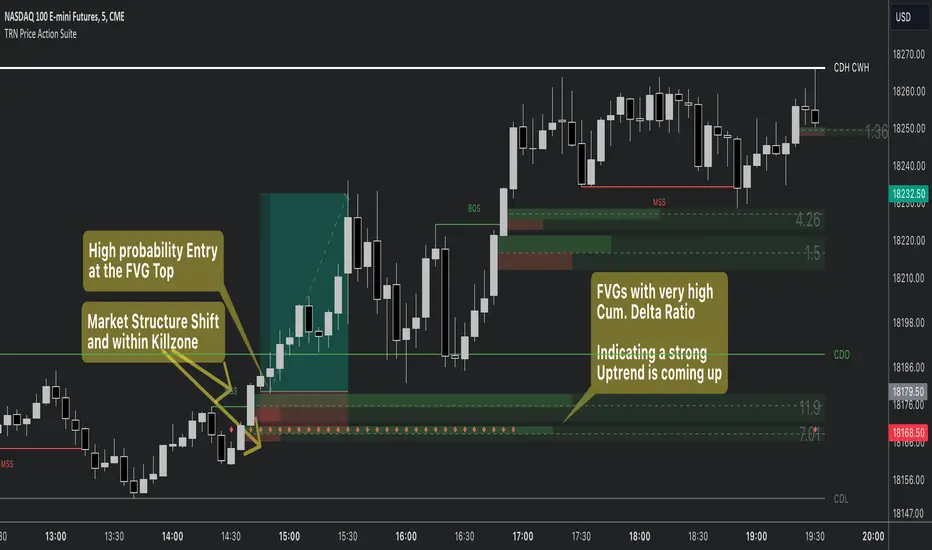
Volume Footprint Voids [BigBeluga]Volume Footprint Voids is a unique tool that uses lower timeframe calculation to plot different styles of single candle POC.
This indicator is very powerful for scalping and finding very precise entry and exits, spotting potential trapped traders, and more.
Unlike many other volume profiles, this aims to plot single candle profiles as well as their own footprints.
🔶 FEATURES
The script includes the following settings:
Windows: Plotting style and calculations
Coloring modes
Display modes
lower-timeframe calculations
🔶 CALCULATION
In the image above we can see how the script calculates each level position that will serve as a calculation process to see how much volume/closes there are within the levels.
In the image above, we can have a more clear example of how we count each candle close.
We use the prior screenshot as an example, after setting each level we will use the lower-timeframe input to measure the amount of closes within the ranges.
Depending on the lot size, the box will be larger or smaller, usually the POC will always have the highest box size.
NOTE: Size is the starting point, always from the low of the candle.
To find more voids, select a closer LTF to the current one you're using.
To find fewer voids, select a timeframe away from your current one.
Due to Pine Script limitations, we are only able to plot a certain amount of footprints, and we can't plot the whole history chart.
POC will be the largest block displayed, indicating the time point of control
Gray areas are closes above the average
Black are Void or imbalance that price will fill in the future, like FVG
The image above shows an incorrect size input that will lead to bad calculations, while on the other side, a correct size input that will lead to a clear vision and better calculation.
🔶 WINDOWS
The "▲▼" Mode will display delta buyers and delta sellers coloring with voids as black.
It also offers a gradient mode for a beautier visualization
The "Total Volume" mode will display the net volume within the lot size (closes within the levels).
This is useful to spot possible highest net volume within the same highest lot size.
The "POC + Gaps" will show both POC and Gaps as the highest block while all the rest will be considered as the smaller block.
This is useful to see where the highest lot were and if there are higher or lower imbalances within the candle
The last option "Gaps" will simply display the gaps as the highest block, while the POC as the lowest block.
This is useful to have a better view of the gaps areas
🔶 EXAMPLE
This is one of the most basic examples of how this script can be used. POC at the bottom creating a strong support area as price holds and creates higher voids gap that price fills while rising.
🔶 SETTINGS
Users have full control over the script, from colors to choosing the lower-timeframe inputs to disabling the lot size.

Gap SMAGap SMA Indicator - Analyzing Price Gaps with Moving Averages
Description:
The Gap SMA (Simple Moving Average) indicator is a powerful tool designed to analyze price gaps, a phenomenon occurring when the market opens significantly higher or lower than the previous session's close. These gaps often signify abrupt shifts in market sentiment, driven by fundamental news, earnings reports, or overnight geopolitical events.
This indicator calculates and visualizes the average gap-up and gap-down based on historical data, aiding traders in identifying potential support or resistance levels driven by gap behavior.
What is a Gap?
In financial markets, a gap occurs when there is a notable difference (upward or downward) between the previous session's close and the current session's open. Gaps can be categorized as gap-ups (when the current open is higher than the previous close) or gap-downs (when the current open is lower than the previous close).
Key Features:
User-Defined Parameters: Adjust the number of gaps considered and a multiplier factor for precise customization.
Average Gap Visualization: Plotting lines representing the moving average of gap-ups and gap-downs.
Alert System: Alerts notify traders when the close price crosses above/below the average gap lines, offering potential entry or exit signals.
This tool is particularly useful for swing traders and investors interested in understanding historical gap patterns and integrating this information into their decision-making process. It can assist in determining potential stop-loss levels, defining entry or exit points, and gauging market sentiment based on gap behavior.
Feel free to experiment with various settings and timeframes to suit your trading strategy and risk tolerance. Your feedback and suggestions for further enhancements are highly appreciated!
Fair Value Gap [MyTradingCoder]Introducing the "Fair Value Gap" indicator, a powerful tool designed to identify and visualize areas of potential market gaps where leftover orders may reside. This indicator utilizes price action analysis, specifically focusing on fair value gaps that occur between the current candle and the candle two bars prior.
The Fair Value Gap indicator draws customizable zones on the chart, representing bullish or bearish areas with distinct green or red colors. These zones highlight market gaps where price action has left a void, indicating the possibility of significant order activity in that region.
Key Features:
Liquidity Zone: Utilize the Fair Value Gap zones as areas of liquidity, offering potential entry points for trades.
Support/Resistance Indicator: Configure the indicator to extend beyond the initial breakout or gap fill, allowing it to act as a support/resistance zone indicator.
The Fair Value Gap indicator has several adjustable settings to customize its behavior according to your trading preferences. These settings include:
Invalidation Outcome: Choose how the fair value gap zone is treated when it becomes invalidated. Options include:
-Stop Updating: Maintain the gap zone in its current state without further updates.
-Delete: Completely remove the fair value gap from the screen.
Invalidation Method: Determine the logic that invalidates the fair value gap. Options include:
-Gap Fill: Visually shrink the zone as price action closes the gap until it is completely filled, at which point it gets deleted entirely.
-Number Of Breakouts: Invalidate the gap after a certain number of breaks or flips over the zone's border. Configure the allowed number of breakouts with the "Breakouts Until Invalidation" input.
-Age Of Gap: Invalidate the gap after a specified number of bars have passed since its creation. Set the threshold with the "Bars Until Invalidation" input.
Color Customization: Customize the appearance of the fair value gap zones with various color inputs, including bullish and bearish border colors, middle line color (shared for both bullish and bearish gaps), bullish and bearish background colors.
Line Width: Adjust the width of the border lines and the center line within the fair value gap zone for better visual clarity.
Please note that the Fair Value Gap indicator is a valuable tool but should be used alongside other technical analysis methods to make well-informed trading decisions. It does not guarantee profitable trades but aims to provide insights into potential areas of interest.
Discover opportunities within market gaps and leverage the power of leftover orders with the Fair Value Gap indicator—an indispensable asset in your trading toolkit.
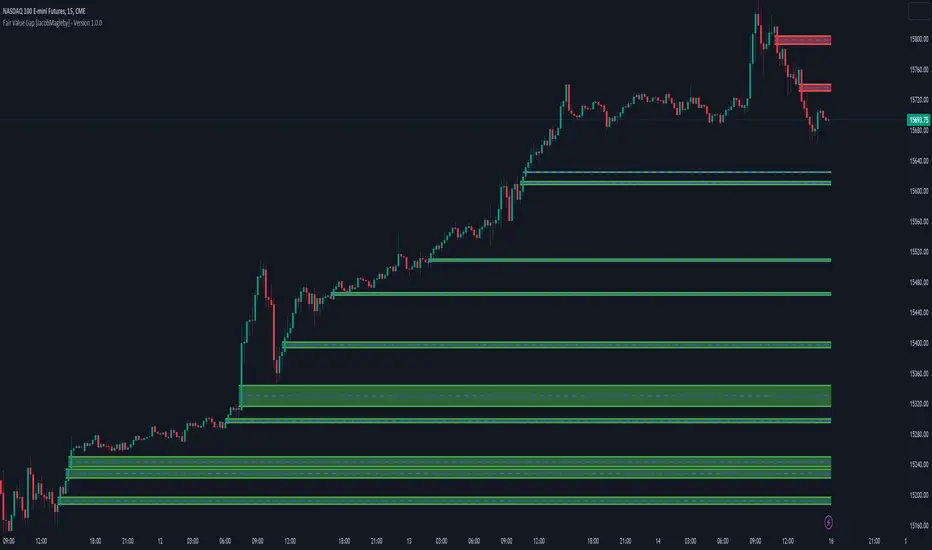
iGapFinderHi everybody!
I decided to release this script to help traders keeping track of market gaps on the CME.
The script works in general for any market and at any timeframe.
The script allows the user to:
- Identify price gaps of a customized amplitude (Gap Width)
- Compute the probabilities of filling them (specific for bullish and bearish gaps or cumulative)
- Visualize gaps on the chart through red and green price areas.
- Visualize the last N unfilled bullish and bearish gaps together with their time of creation.

Ema Short Long Indicator[CHE]█ CONCEPTS
This Pine Script is an EMA Short Long indicator that displays the crossing EMA lines on the chart. The indicator uses three exponential moving averages (EMAs) to generate the buy and sell signals. The EMA lines are plotted as green (uptrend) and red (downtrend) lines. When the green line is above the white signal line, the indicator generates a buy signal, when the green line is below the white signal line, the indicator generates a sell signal. Arrows are also displayed marking the buy and sell signals. There is also an option to allow indicator repainting or not. Finally, users can also set alerts to be alerted to potential trading opportunities.
Note: please do not disable "time frame gaps". Allows to calculate the indicator on a Timeframe (TF) different from that of the chart Time window. The TF should ideally be higher than the charts to provide a broader perspective than
the TF of the chart. Using TFs lower than the chart's will deliver fragmentary results, since only the last value of intrabar is displayed (multiple values cannot be displayed for a single chart bar). The Gaps setting determines the behavior when the TF is higher than the TF of the chart. If 'gaps' is checked, higher TF values only come in and are interconnected on the diagram when the higher TF completed. This has the advantage of avoidance Real-time epainting. If Gaps is not enabled, Gaps are filled with the last higher TF value calculated, which will not produce a repaint Values on historical bars but repaint values realtime.
█ HOW TO USE IT
Load the indicator on an active chart (see the Help Center if you don't know how).
Time period
By default, the script uses an auto-stepping mechanism to adjust the time period of its moving window to the chart's timeframe. The following table shows chart timeframes and the corresponding time period used by the script. When the chart's timeframe is less than or equal to the timeframe in the first column, the second column's time period is used to calculate the Ema Short Long Indicator :
Chart Time
timeframe period
1min 🠆 1H
5min 🠆 4H
1H 🠆 1D
4H 🠆 3D
12H 🠆 1W
1D 🠆 1M
1W 🠆 3M
█ DESCRIPTION
The script begins by setting up the chart indicator with a short title, "ESLI", and enabling it as an overlay. It then initializes several variables for time conversions, to be used later in the script.
The timeStep_translate() function converts the timeframe of the chart into a string representing a larger time interval, based on the number of seconds in the timeframe. The resulting string is used to label the horizontal axis of the chart.
Next, the script defines several input variables that can be modified by the user. These include the colors of the EMA lines and the signals, whether or not the indicator is allowed to repaint (i.e. update past values based on future data), and the number of periods used to calculate the EMA and signal lines.
The f_security() function calls the request.security() function to fetch data from the specified security and timeframe, and is used to calculate the EMA and signal lines using the ta.ema() function. The clo variable is assigned the closing price data, adjusted for repainting and timeframe.
The EMA line is calculated using a weighted average of the EMA over the specified period and two times that period, as well as three times that period, divided by six. The signal line is calculated as the EMA of the EMA line over the specified period.
The col_css variable sets the color of the EMA line based on whether it is currently above or below the signal line. The script then plots the EMA and signal lines, and uses the plotshape() function to indicate long and short signals based on the crossovers and crossunders of the EMA and signal lines.
Finally, the script sets up alert conditions using the alertcondition() function to notify the user when a long or short signal is generated, including information about the symbol and closing price.
█ SPECIAL THANKS
Special thanks to LOXX, I wanted to take a moment to express my gratitude for his valuable input in the EMA calculation. His insights and expertise have greatly helped me in improving my Pine Script coding skills. Thanks to his suggestion, I was able to better understand the EMA formula and implement it effectively in my script.
Your generosity in sharing your knowledge and experience is truly appreciated. It is through collaboration and exchanging ideas that we can all grow and become better in our craft.
This script provides exact signals that, with suitable additional indicators, provide very good results.
Best regards
Chervolino