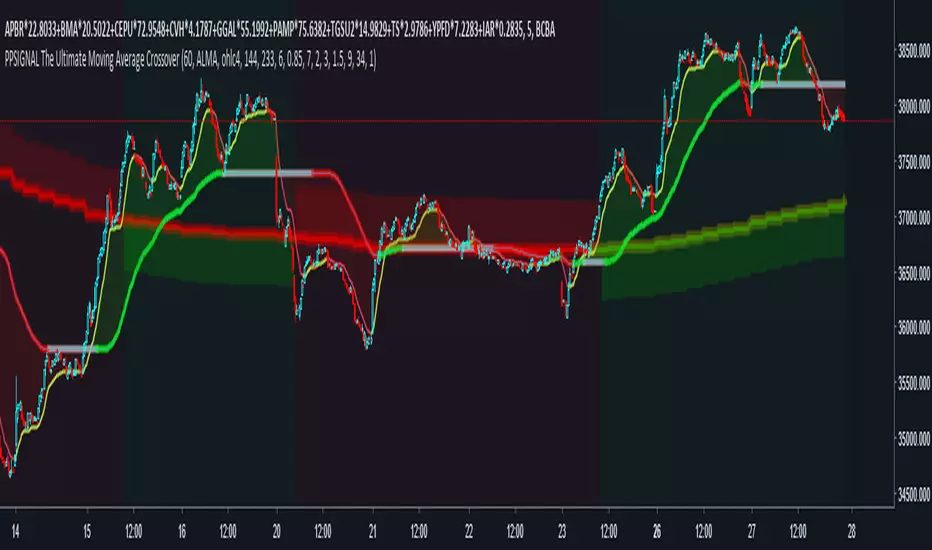
PpSignal The Ultimate Moving Average CrossoverNo matter how many times I explore new concepts, I tend to always incorporate a moving average, or two (if not on price, then on an oscillator). I am going to show the settings I have found to be most beneficial for finding the trend for the ES, forex, crypto etc. First, I have to admit, it is not just a simple crossover. Instead, it is a combination of a MA cross, Multi-Time Frame (MTF), and direction of a normalized moving average.
In den Scripts nach "crypto" suchen
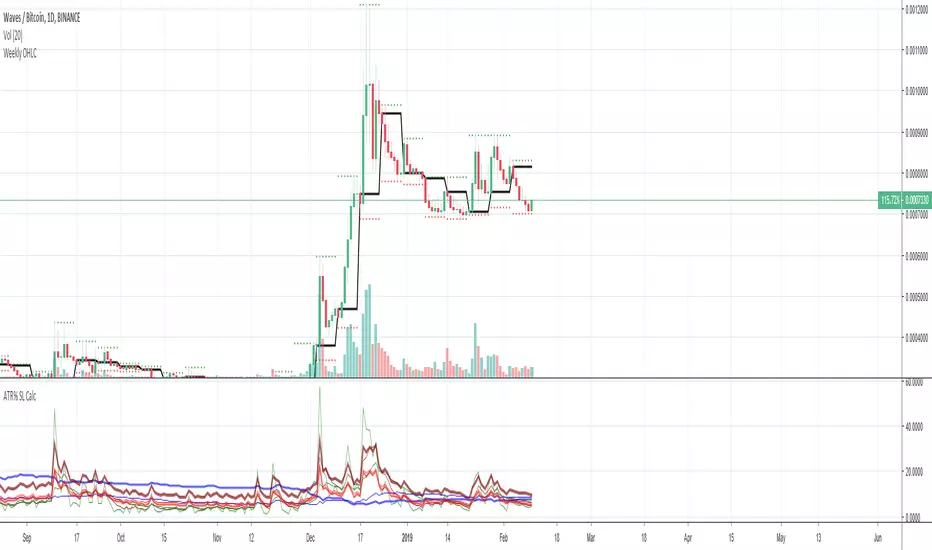
Average True Range Stop Loss CalculatorThis indicator takes the average of a series of ATR to calculate what I would consider an optimum stop loss placement represented in percentage (read below for full overview).
While the data is plotted what is most helpful are the actual numbers presented.
This indicator is most helpful on the daily timeframe but can be used for all timeframes such as the 4HR or 1HR.
This indicator should not be used alone. It should be used in conjunction with proper price action analysis. It’s also a great indicator if you chart using Value Channels. Ideally you want your stop placement to be below at least one core Value Channel boundary range. In addition to standard support and resistance and some key moving averages the market respects. This also works best when trading with the prevailing BIAS of the instrument (bull or bear).
Cryptos: Generally, that means you’re buying on retracements that fit the end of a structured move. The other option is using this in a clear up trending market where the pull backs are clearly being supported with buying.
FOREX: I use this in my FOREX swing trades for my stop placements. Keep in mind I primarily trade my trade system and use this indicator to ensure my stop placements I define based on VCs are within the ATR tolerance. I’ve found that ATR * 1.5 is the best for my trade system.
WTI: Helpful but I have different rules for when I trade WTI. I rely upon VCs and diagnal VCs much more when trading this.
Equities: Helpful but with the increase of volatility as well as uncertainty of Bias of the market-- this should be used as more of a guide than
Indicator Overview:
Value 1 (maroon): 3 Period ATR
Value 2 (green): 7 Period ATR
Value 3 (blue): 30 Period ATR
Value 4 (blue, bold): 90 Period ATR
Value 5 (green): 1 Period ATR
Value 6 – Prime Stop Loss Placement (red): Average of all above ATR multiplied by 1.5
Value 7 (red): Difference between Value 6 (prime stop loss) and current period move. This is an experimental value. Two ways to use this value. Use as a tighter stop loss placement. The other option is to use as a retrace target for purchase and using the Prime Stop Placement value as you’re stop loss.
All ATRs use the LOW price of the period. After testing both the low and close I’ve settled on the low to capture the most volatility you will typically experience.
Once again, this indicator should be used in conjunction with your proven trade system.
Also, by knowing what the values are within the indicator you could just eye ball what would be the best stop placement depending on the ATR or 1 or 2 ATRs you find most represent the volatility of what you are trading.
I will be expanding on this indicator by bringing in average measured moves as well as volume analysis and most likely with color changes and modifications.
Background:
While using and refining my trade system I've noticed that most moves happen in 3 periods. So we start there. The 7 period is good for a 24 hour market such as crypto (although weekend trading can be a hit or miss) and to some extent FOREX. The longer periods of 30 & 90 are to smooth out the data set. The final value of the 1 period is to bring a little more recency to the calculation.
Why multiply the average by 1.5? I've found in my own trading and system I built to be the best placement (in conjunction with VCs) to ensure you're stop isn't to close and is within the instrument you are trading volatility.
I'm looking at making this more intelligent as well as take into account volume and structured moves.

TradingLive24 System LTCUSDThis is a script for LTCUSD in 5 minutes resolution.
It will show you when you must to Buy, Sell or Exit from the Crypto.
The strategy has 80% of success. You can modify and adapt it to your requirements.
If you want to have more entries, you only need to modify the parameters 3 and 4, preferably with values less than 20.
Usually, the parameter 4 need to be grater than parameter 3.
The parameters 1 and 2 don't need to be modified, but you can touch them too.
Also, the TakeProfit1 and StopLoss1, usually are greater than TakeProfit2 and StopLoss2.
If you want more success percent, you can modify the TakeProfit with a smaller number.
Get 10-day Free Trial, just send us your TradingView Username here www.tradinglive24.com

Bones1390's GANN Strategy AlertsThese are the alerts to go along with my GANN Strategy. You can find the strategy here:
If you like my stuff, leave me a comment below.
If you're feeling kind or want to show some appreciation, you can donate Bitcoin to this Address here:
3Jp9Kow1VxvzAiLLwCdeeQ2g11wKyaT4rC
Also if there's anything you want to talk about PM me! I'm free to speak about anything. Want a custom indicator? I can do my best to code it for you!
Thanks!
Bones

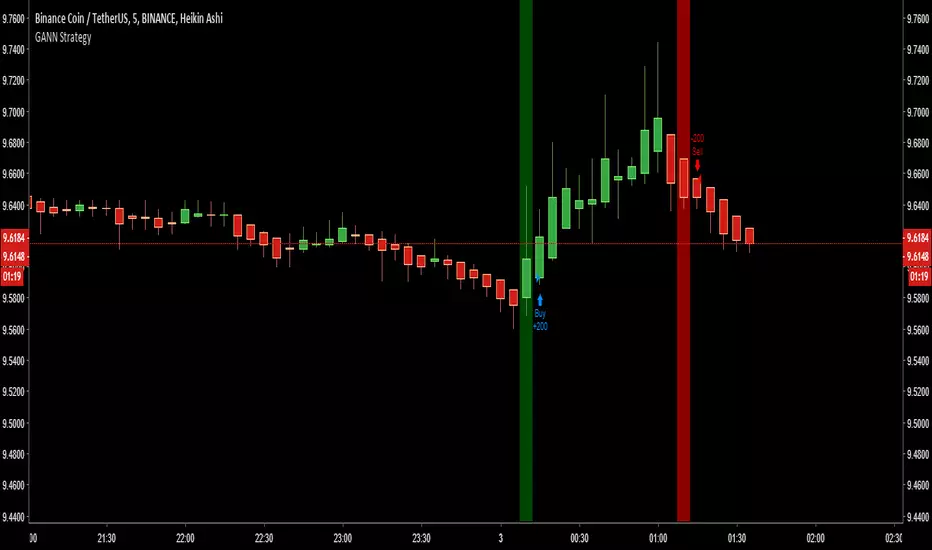
Bones1390's GANN Strategy - Works for Cryptocurrency too! [MTF]Simple Strategy.
Use this strategy with Heiken Ashi candlesticks.
RULES:
Enter Long ONE BAR after the green Vertical Signal Line plots, and sell as soon as a red Vertical Signal Line. Vice versa. You get it. ;)
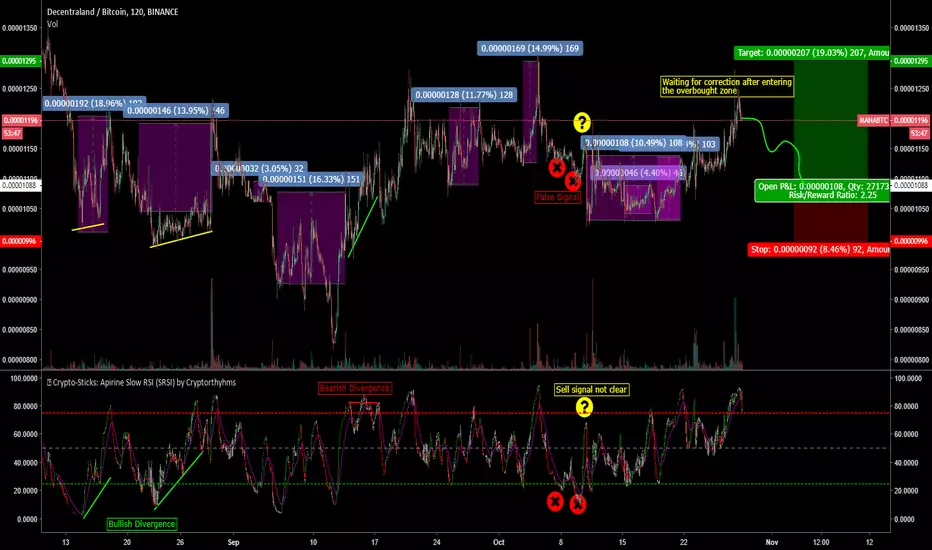
🥢 Crypto-Sticks: Apirine Slow RSI (SRSI) by Cryptorthyhms🥢 Crypto-Sticks™ Apirine Slow RSI (SRSI)
A new series of indicators brought to you by Cryptorthyhms...giving you an alternate look at your trusted favorites! Follow me, there are still 2 dozen Crypto-Sticks indicators planned - all will be released in public library.
🚀 Indicator Specific Info
🐻Thanks to Lazybear for posting the original Apirine RSI code I updated to create this indicator! (give that man a follow/thumbsup, hes a legend!)
New Crypto-Sticks option is an EMA of the average signal line output. Eventually I will go back and update the previous indicators with this feature as well!
⛔Please remember that you may have to adjust the overbought and oversold levels to suit the volatility of the instrument you are working with. In the future I will implement a feature that does this automatically, but for now its manual.
Heiken Ashi candles (default) adds some more clear trend changing points which can be executed at the second candle going in either direction. Other coins/charts will require their own strategy - you could potentially have to tweak that parameter. In this example you would enter on 2nd green, exit on 2nd red. HA Example:
Volume weighting the HA candles adds a different dimension to the indicator which I have to explore more fully.. In my opinion VW does not provide any benefit as is for this indicator. I left the option in for you though as YMMV. An example of VW+HA:
💭Please leave me any ideas or feedback you have!
🚫If you use volume weighting you should be on heiken candles.
🚀 Crypto-Sticks General Info
🚧This series isnt polished 100%, and I have some more options I will add in the future. But for now, I want to just release them, as I am not sure when I will have the time to put more work into them (many other big projects I am working on).
📊Its basically reinterpretations of all your favorite indicators. I calculate the values a little bit differently than normal, but the end result is creating a candlestick chart (for the indicator!). Then I added the option to plot them as Heiken Ashi candles to smooth out noise and make signaling easier. I recommend using the indicator on this setting.
🔊Lastly I implemented a Volume Weighting system for them all which simply integrates volume into the formulas for these indicators. For the most part this feature is experimental and doesn't provide huge utility (yet - I have other ways I want to try it as well - just no time). Though on some of the indicators it already shows great promise.
👍Enjoying this indicator or find it useful? Please give me a like and follow! There are many more indicators to be released in this series, not to mention I post crypto analysis and other free indicators regularly.
💬Questions? Comments? Want to get access to an entire suite of proven trading indicators? Come visit us on telegram and chat, or just soak up some knowledge. We make timely posts about the market, news, and strategy everyday. Our community isnt open only to subscribers - everyone is welcome to join.
🥢Crypto-Sticks: True Strength Index 1.0 by Cryptorthyhms🥢 Crypto-Sticks™ True Strength Index
A new series of indicators brought to you by Cryptorthyhms...giving you an alternate look at your trusted favorites!
🚀 Indicator Specific Info
Signal Line can be configured in options, but I personally prefer heiken candles to the signal line.
⛔Please remember that you may have to adjust the overbought and oversold levels to suit the volatility of the instrument you are working with. In the future I will implement a feature that does this automatically, but for now its manual.
The OB/OS zones are given in two levels, because often you can find a line of best fit that will hit "small movements" and one that will hit "big movements." In this case I chose 25 and -25 for the small zones. For the bigger zones I chose 50 and -50.
Heiken Ashi candles adds some more clear trend changing points which can be executed at the second candle going in either direction. Other coins/charts will require their own strategy - you could potentially have to tweak that parameter. In this example you would enter on 2nd green, exit on 2nd red. Here is the Heiken Ashi example:
Volume weighting the HA candles adds a different dimension to the indicator which I have to explore more fully. On this particular indicator it adds alot -1.51% more noise, and I dont particularly care for it, but YMMV. Example of what I mean:
💭Please leave me any ideas or feedback you have!
🚫If you use volume weighting you should be on heiken candles.
🚀 Crypto-Sticks General Info
🚧This series isnt polished 100%, and I have some more options I will add in the future. But for now, I want to just release them, as I am not sure when I will have the time to put more work into them (many other big projects I am working on).
📊Its basically reinterpretations of all your favorite indicators. I calculate the values a little bit differently than normal, but the end result is creating a candlestick chart (for the indicator!). Then I added the option to plot them as Heiken Ashi candles to smooth out noise and make signaling easier. I recommend using the indicator on this setting.
🔊Lastly I implemented a Volume Weighting system for them all which simply integrates volume into the formulas for these indicators. For the most part this feature is experimental and doesn't provide huge utility (yet - I have other ways I want to try it as well - just no time). Though on some of the indicators it already shows great promise.
👍Enjoying this indicator or find it useful? Please give me a like and follow! There are many more indicators to be released in this series, not to mention I post crypto analysis and other free indicators regularly.
💬Questions? Comments? Want to get access to an entire suite of proven trading indicators? Come visit us on telegram and chat, or just soak up some knowledge. We make timely posts about the market, news, and strategy everyday. Our community isnt open only to subscribers - everyone is welcome to join.

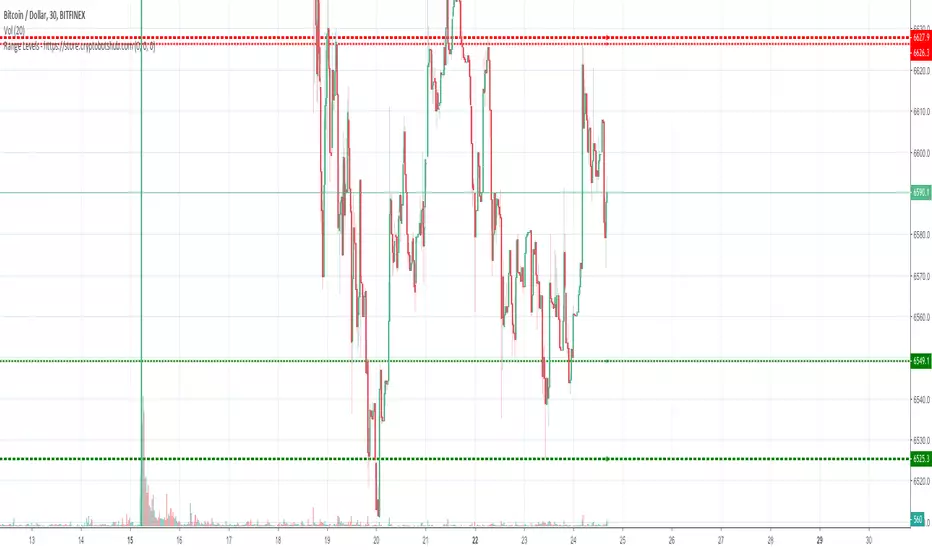
Range Levels - High and Low of Daily, Weekly, and Montly RangesThis is a great free script for the current ranging crypto markets.
You can see the daily, weekly, and monthly high and low of ranges. It also has alerts that you can enable in the settings and then setup in your TradingView alerts for when the price crosses these levels.
Ultimate Crypto Trading Script :Not Actually,But It Make's MoneyAll You Need To Get Started With Trading With Your Crypto Investment's
For More Info And Fun Join Our Community On : forum.cryptoeasternwizards.com
or
Just Join Our What's App Group : chat.whatsapp.com

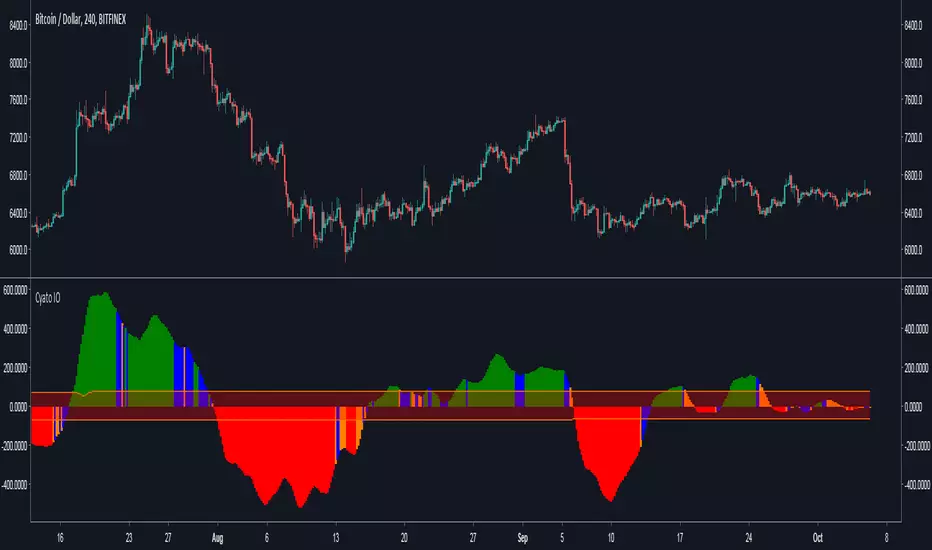
Cyatophilum Ichimoku Oscillator [ALERT SETUP]Hello, I built an oscillator based on Ichimoku trading rules. I wanted something simple to use, but powerful, with automated alerts that would help us trade breakouts and trend reversals.
The indicator can be used on all timeframes and everywhere : Crypto, Forex, Index, Stocks, Futures, CFD.
Basically, green bars equals bull market and red bars equals bear market.
Blue and Orange bars show potential breakouts and you can setup automatic alerts for receiving an email or SMS when it happens.
You can also setup alerts for new highs and new lows indicating a potential trend reversal.
The narrow channel in the middle indicates consolidating periods and unsignificant trades, because we know Ichimoku performs badly in range markets.
For more information on how to use it, I made a description page at the link below.
Sample Use Cases :
BTCUSD 4H
BTCUSD 2H with New Highs/Lows on chart (blue and red circles correspond to alert conditions)
BTCUSD 1H
ETHUSD 2H
Use divergences with price action to trade breakouts.
More information on my website
blockchainfiesta.com
Purchase this indicator today and get access to my other Cyatophilum Indicators that will help you in your trading
blockchainfiesta.com
Happy trading!
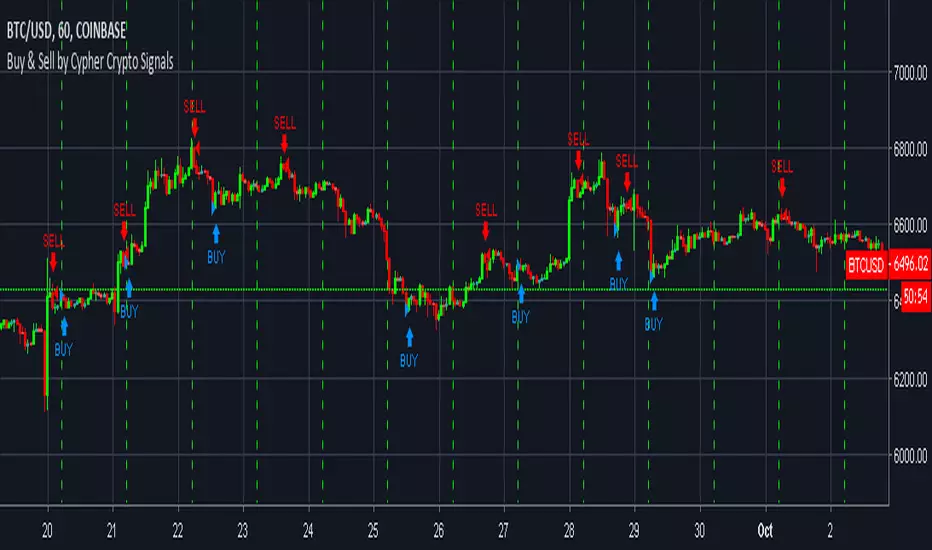
Buy & Sell by Cypher Crypto Signals
Cypher Crypto Signals
+++ Affordable Altcoin Signals with High Success rate and Constant BTC Analysis+++
Trading Signals for All major Exchanges | Bitcoin Analysis
You can purchase crypto currency coins or tokens for the long run, Just buy and hold them for a broader timeframe. This is more an investment than trading.
You can trade cryptocurrency coins or tokens for short to medium terms, Which means you buy undervalued or outbreaking assets, hold them until a projected target price has been hit and sell them against Bitcoin, USD or Tether. This indicator analyze the Bitcoin and Altcoin markets and provide you with signals on what to buy, at a particular price, and when to sell it again. You will use exchanges like Binance, and the only way to profit is at an increased price of the purchased asset.
You can use a Mercantile Exchange like Bitmex to day trade Bitcoin and few other altcoins. Here you can long (you anticipate an increasing price), or you can go short (you anticipate a decreasing price), which means you can trade bi-directional and profit from price movements in both directions. Additionally, you can leverage your trades up to 100x, which increases the risk significantly but also the gains can be much higher.
Note:- This indicator work Excellent in all timeframes excluding 1 Day timeframe.
Disclaimer :- This indicator is for educational purposes only. We are no financial advisors. Do not make investment decisions based on this informations. The information provided from Cypher Crypto Signals is for informational purposes only. It should not be considered legal or financial advice. You should consult with a financial advisor or other professional to find out what may be best for your individual needs and risk tolerance. Please do your own research and let never anyone trade for you. Please read this Disclaimer and leave the Indicator if you disagree with it.
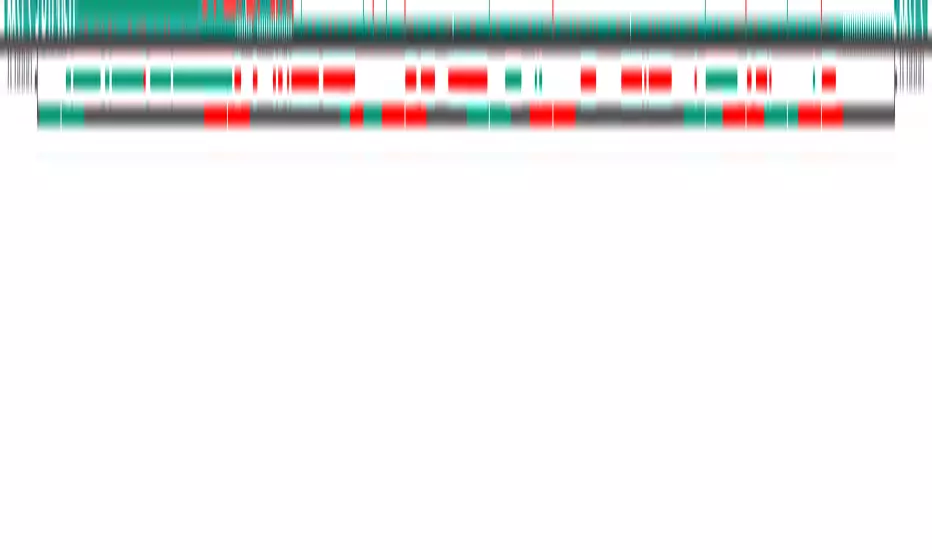
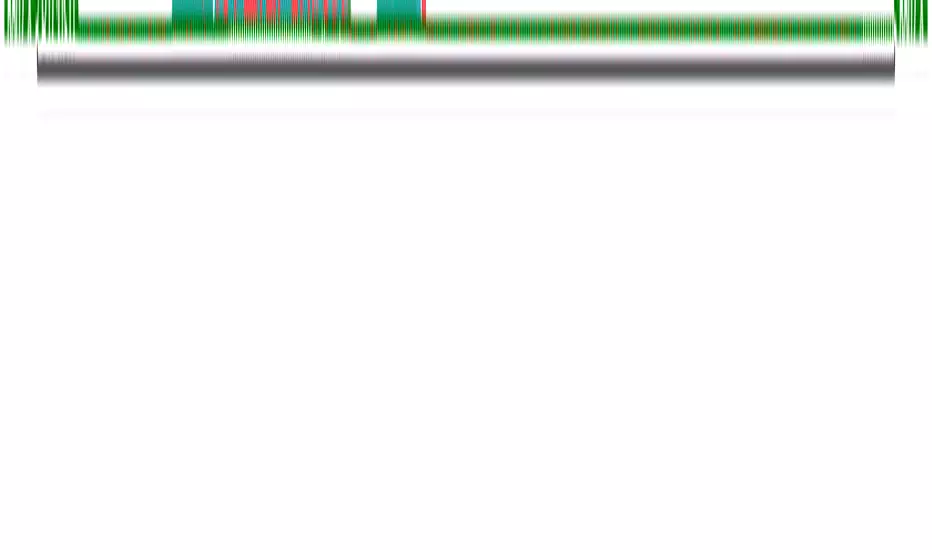
Correlated Market Matrix - Correlation Computer - GyromaticalCorrelated Market Matrix - Correlation Computer
Works with up to 7 markets simultaneously to find price divergences.
Study Forex pairs, stocks, crypto alt coins.
Find potential entries quicker.
Short Description:
This indicator analyzes 6 markets and one spread (or 7 and no spread) against the currently loaded instrument,
with support for complex formulas. This indicator finds positive and negative correlations intrabar and throughout
the specified time frame simultaneously. It employs a weighting system and score threshold
(everything is user-definable) and signals upon positive or negative score. Alerts are included
for intrabar and overall positive and negative correlations.
Detailed description:
This indicator analyzes 6 different markets and 1 spread (or 7 different markets if no spread) and
measures correlations between them. The squares on the background are individual
correlations (intrabar) and the circles to the right-hand side depict whether the markets have risen
or fallen in price since the start of the specified time frame (red/green or gray for neutral).
To the right of the circles you have the instrument numbers. The numbers represent the instruments you
have specified, in order. Above these numbers and circles you will find two square icons.
You will notice the left-most icon has the caption of "Overall Score +" (or -) and the right-most icon
has the caption of "Intrabar Score +" (or -). The overall score measures the correlation score from the
start of the time frame to the present time. The intrabar icon measures the correlation score of
individual candles. The scoring system implements weighting which uses scores for each individual instrument
and all scores are user-definable (positive and negative). There is also a threshold level which is user-definable,
if the score reaches or crosses this level it will trigger the aforementioned signal icons.
The analyzation time frame is decided by the user. The Correlated Market Matrix can calculate from a
given date to present (real-time), or between two specified historic dates.
You are able to represent the correlations using the close (price) of the instrument or an EMA (speed is user-adjustable).
The spread has the individual option to use EMA or close (price) separately from the other instruments.
You have the option to assign the weight of any number (0 to 100) to any instrument if the instrument is bullish.
You additionally have the option of subtracting the numbers if it is bearish (-100 to 0).
You may assign both bullish and bearish weights to each instrument at the same time to obtain maximum balance.
If you do not desire custom weighting, simply leave the weights at 1.
The negative vs positive levels are then measured, and whichever score is the strongest determines if the
square icon displays "Overall Score +" or "Overall Score -" (same for Intrabar).
"Score +" means that the score is equal to or greater than the threshold.
"Score -" means that the score is less than the threshold.
Additionally you are provided the option of visualizing the actual correlation lines. This is useful in the sense that
you may view the direction of that particular secondary instrument without actually opening its chart. The color red
implies that the correlation is falling, while green implies it is rising. Please note that due to
limitations you cannot see the actual correlation value of these lines, and also this is an experimental feature so lines
may not always appear appropriately. In testing a line may vanish momentarily here and there but it is somewhat rare.
The background squares will tell you the actual state of the correlation.
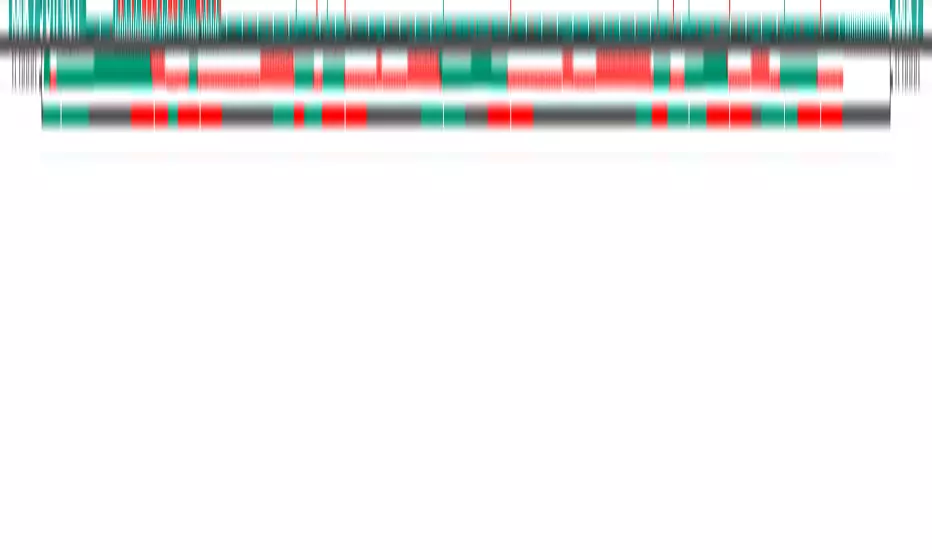
HOW DO YOU READ IT?
The numbers represent the instrument you selected in that number slot.
The circles to the left of the numbers indicate if that market is up or down since the beginning of the specified timeframe.
Red means price is down, green means price is up, gray is neutral.
The icon "Intrabar Score +" or "Intrabar Score -" indicates whether the majority of markets are over their score threshold
(negative or positive correlation) for the current candle only.
If this is "Neutral" then there is no current score.
The icon "Overall Score +" or "Overall Score -" indicated the majority of markets are over their score threshold (negative or
positive correlation) for the OVERALL time frame (start to current, or start to finish if you are not using in real-time).
If this is "Neutral" then there is no current score.
For individual candle correlations, if the secondary instrument is up and the main instrument is down, the boxes are red.
If secondary instrument is down and main instrument is up, boxes are green.
If correlation lines are red then the correlation is becoming negative, if they're green then they're becoming positive.
This does not mean there is a negative or positive correlation, only that the correlation is rising or falling.
The background squares will tell you the state of the correlation.
PLEASE NOTE:
If you are using a white or bright colored chart, click the gear icon next to the indicator name.
Select the "Style" tab. The first option "Time frame Background Color" should be adjusted to either
black or white with no transparency (take note of the slider underneath the color squares).
This will make the matrix appear correctly.
INPUT MENU
By clicking the gear icon next to the indicator name, you are presented with a host of options.
The options are as follows, in order of appearance:
- Correlation Length : Amount of bars to look back for the correlation.
- Show Correlation Lines : Chose whether to display the correlation lines or not.
- Use Rising/Falling Colors : Use rising/falling colors for correlation lines instead of unique colors.
- Instrument Source : Chose from 'Price' or process the instrument through EMA instead.
- Price Source : This source works for both "Price" source and the EMA source.
- EMA Speed : Speed of the EMA if 'Instrument Source' is set to 'EMA'.
- Use EMA on Spread 1 : Use EMA on the 'Spread Instrument 1'. If unchecked, close is used by default.
- Use EMA on Spread 2 : Use EMA on the 'Spread Instrument 2'. If unchecked, close is used by default.
- EMA Speed for Spread 1 : Speed of EMA for Spread 1 if EMA is used instead of 'close'.
- EMA Speed for Spread 2 : Speed of EMA for Spread 2 if EMA is used instead of 'close'.
- Disable Spread and use Instrument 1 as correlated market instead : By default, the indicator takes both spread
instruments and calculates the spread between each (instrument1-instrument2=spread). If this feature is enabled, the indicator
will use only the 'Spread Instrument 1' and calculate it in the same manner as the other markets.
This is useful if you do not wish to use a spread and would rather have an extra market.
- Positive Weight of Instrument (1-7/spread) : Positive weight for the instrument.
It is recommended to enter only positive numbers here. If left 0, no weight will be added to the instrument but the indicator will
signal "Score -" if all others are also 0. If left at 1, if more markets are positive than negative, the indicator will present "Score +".
- Negative Weight of Instrument (1-7/spread) : This works in the same way as positive weight except it is recommended you enter
only negative numbers here (example: -1.5, -20). This number is subtracted from the overall score. If left 0, no weight will be
added to the instrument but the indicator will signal "Score -" if all others are also 0. If left at 1, if more markets are negative than positive,
the indicator will present "Score -".
- Threshold for score to be determined : if the weighting score of the instruments is this number or greater then
the square signal icon of + (greater) or - (lesser) is triggered.
- Instrument (1-6) : This is where you select which instruments/securities you wish to analyze. This input also
supports complex formulas, same as you'd enter them on your chart.
- Spread Instrument 1 : Instrument of part 1 of spread calculation
- Spread Instrument 2 : Instrument of part 2 of spread calculation
- From Month/Day/Year/Hour/Minute : Display data beginning at this specified time.
- To Month/Day/Year/Hour/Minute : Stop analyzing data at this specified time. To have it calculate indefinitely
in real-time, then the "To" settings should be left at Month: 12, Day: 31, Year: 2222, Hour: 23, Minute: 59.
STYLE MENU
- Time frame background color : The background color of the viewing area, especially helpful for white charts where colors may become faded.
- Correlation Line (1-7) : Properties for the displayed lines (if enabled). The first two colors are for rising and falling respectively
(if "Use rising/falling colors" is enabled), the last color is the default color of the line. This last color
will also be used for neutral if "rising/falling" is enabled.
- Instrument Label (1-7,Spread) : Properties for the right-hand numbered column, denoting which line is which instrument.
- Separator (1-8) : Solid lines between instruments
- Price Circle (1-7) : Circles between labels and background colors, denoting price rise/fall.
- Score + or - : Score icon above the instrument numbers
- Fill Row (1-6, Spread) : Background colors for the matrix. Default is red and green.
Have an idea? Customized logic is available for this framework.
This is not financial advice and this indicator system does not guarantee or claim to make profit.
The signals and ideas contained within this page and indicator are provided on an as-is basis. Use at your own risk.

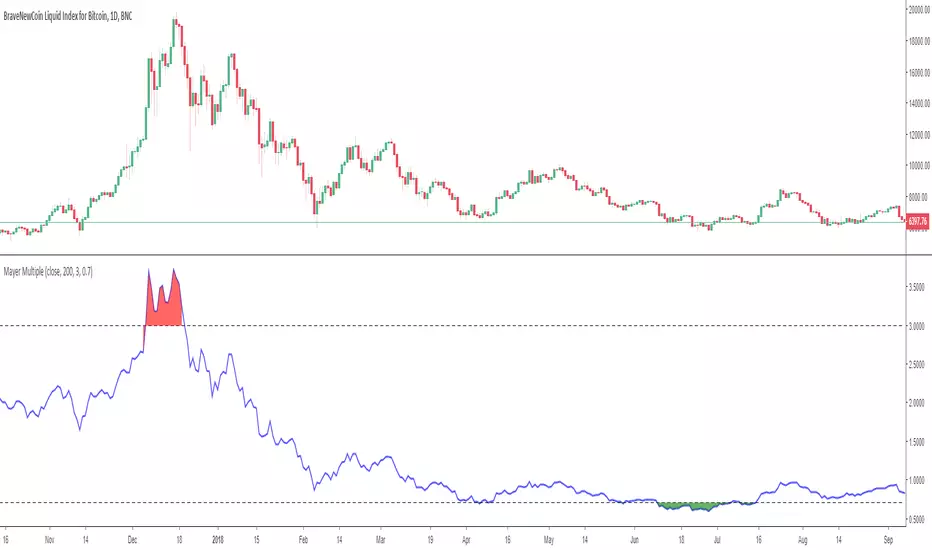
HSS Bitcoin Mayer MultipleIntroducing the Mayer Multiple script…the Mayer Multiple looks over extended periods of time and pinpoints when a cryptocurrency was overbought/sold. The calculation itself is simply the price of the cryptocurrency divided by the 200-day SMA. The default settings are based on Trace Mayer’s recommended numbers but can be adjusted to satisfy your own preferences.
So check it out – I hope you find it useful. As always, this indicator/script should not be taken as trading or financial advice of any kind; it should be used for educational purposes only.
Scalping with Heikin Ashi candle pattern for BTCUSDThis strategy is based on a trading idea that works for me on crypto markets. I use this trading strategy manually from a couple of weeks.
It is based on 1 minute timeframe and heikin ashi candles.
Basically, the strategy places two pending orders in a certain moment of the market and scalp as many pips as possible. Then suddenly it exits before price correction.
The scope of this script is to back test the strategy on a larger period but due to trading view limitation it has to be done modifing the backtesting period manually.
If some of you want to test, please write in comment section.
Please use comment section for any feedback.
Next improvment (only to whom is interested to this script and follows me): study with alerts. Leave a comment if you want to have access to study.

Relative Strength CryptoMeasures Relative Strength of a crypto asset to the an index consisting of top 10 alts + btc

Coinopi_matrixstrategy_[babelii]Best Oscillator for trade cryptocurrency
- Very easy to use
- Highest profit
------------------
eth/btc
zrx/btc
Coinopi_ma_stratgy[babelii]Best Oscillator for trade cryptocurrency
- color bar
- Very easy to use
- Highest profit
-------------------
eth/btc
zrx/btc
Coinopi_Trendstrategy_[babelii]Best Oscillator for trade cryptocurrency
- Very easy to use
- Highest profit
B LAODA TRENDThank for JayRogers
This is a strategy for bitcoin ,cryptocurrency , stock market
1 hardly any repaint ,suggest 2 hour frame for bitcoin or use hekin ashi K line with 90 minute frame, suggest 1 Day or more for stock exchange

Profit Maximizer 90%-95% IntraDayTrade Strategy WithTester Developed for Intraday and for very very Lesser Time Frame Trading. Note: Invite only Script .Request to me Access permission to test this.
Strategy tester enabled .All you can test this in live market in any segment.
Lesser the time frame greater the success rates as the test results.
This can be used : Crypto Currency/Bitcoins ,Forex,currencies ,Index ,Commodity Gold/silver ,Oil Market and in Equity /Futures
It will work for BINARY OPTION ,BINARY DIGITAL to enter and hold the position in right direction, User test it and confirm .
How to Use:
Three Main Zone BackGrounds: 1. Green Zone 2. LightRed Zone 3. Yellow Zone
1.Long only when Bar Color changed from Red or Black to BLUE and BackGround in Green, Hold the position until opposite color comes.
2.Short when BAR become Black and BackGround Red Exit when opposite color come.
3.Yellow Back Ground : Risk Trade Zone : When Red BARs Cautious Short , Yellow Zone LightGreen Bars (Avoid Trade) .In Yellow Zone Close the previous Entered postions.
Time Frame : Lesser Time Frame and holding for longer time will give Good Result . 1min-1Hrs . This will not work >1Hr Strategy and Candle will disappear >1hr TimeFrame.
Strategy Tester : Choose any Date Month Year to Current Date and check the results below in the Strategy Tester.
REPAINT/NO REPAINT : No Repaint ,Previous candles and Background Color wont change. In the current candle position wait for the candle to close to see the stability.Current candle color might oscillate bit However it will not change from Blue to Black or Black to Blue or Black to Red.
Note : Last Bar will be a actual Green or Red Bar by Default Do not Confuse with this.It is trading view default strategy design working way.Once Bar closes actual strategy color will appear.
ALERT /AUTOVIEW capabilities : Strategy Tester does not support ALERT by default as you all know.In the Indicator version Alert will be added for all Buy Sell and cover entries.
Test the strategy.
SCRIPT : Access must be given by me to test this .Once access given you can test ,Request for access .Without access Study Not Auth error will come.
Review and Feedback.Thank you!
Refer the Release notes for any updates and my posts below and in my idea page for more details. Thank you!
Any issues report to me to Fix.Thank you!

6 EMA Crypto InvestidorExponential Moving Averages - 6 EMA Crypto Investidor
Indicator developed to facilitate the use of 6 EMAs in a single indicator.
EMAs: 9, 13, 21, 55, 100 and 200 Periods
Developed by Diego do Youtube Channel Crypto Investor

