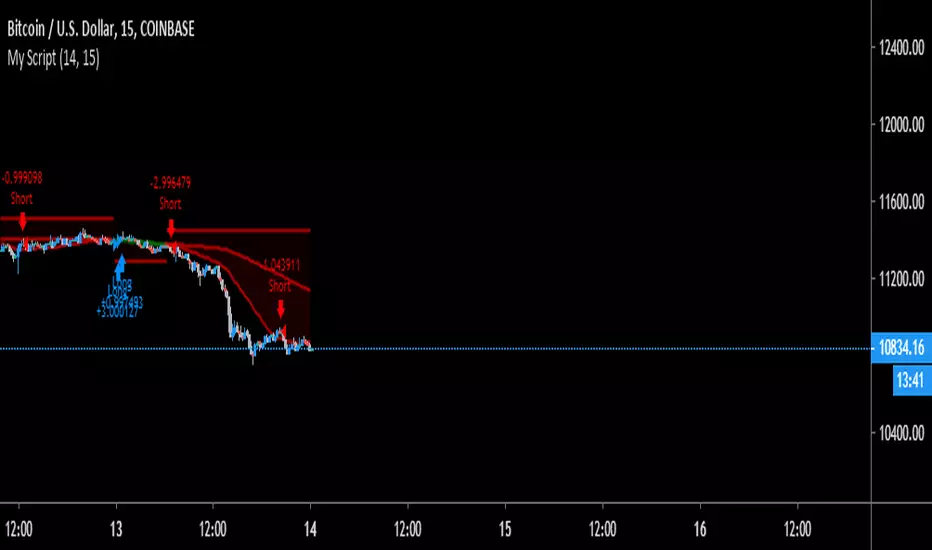
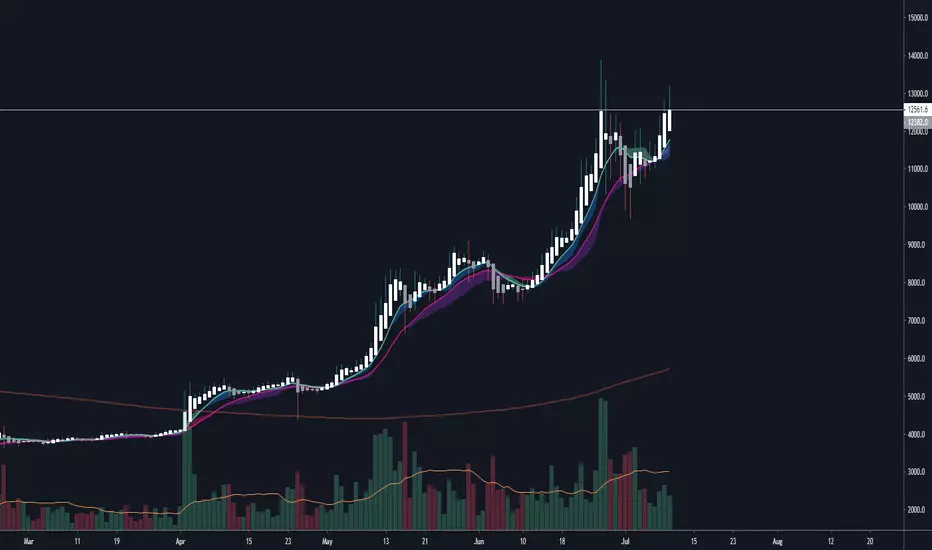
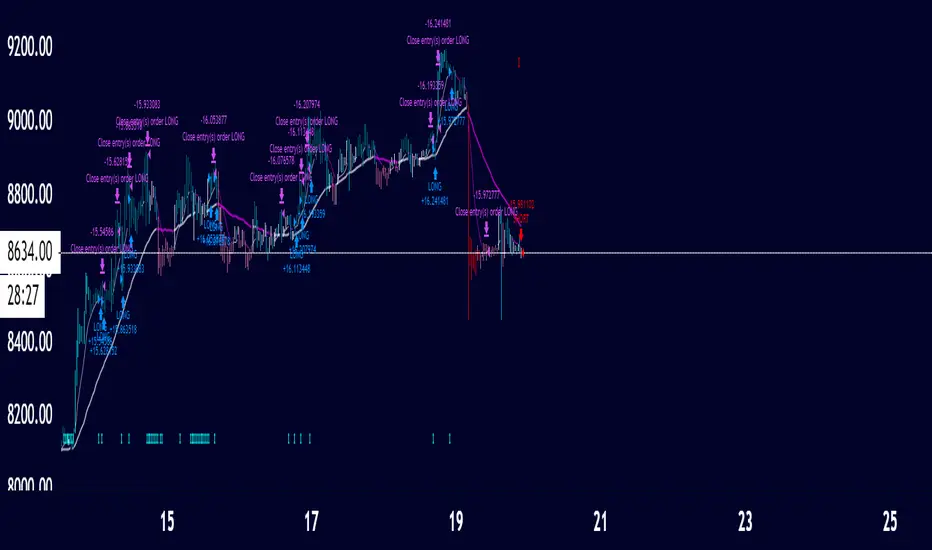
QuantCat 15M Crypto Trend StrategyQuantCat 15M Crypto Trend Strategy
This strategy will allow you to absolutely smash the Crypto/USD pairs. We have optimised this strategy to work best for the Crypto/USD pairs on the 15 minute time frame. There are 4 pairs that we optimised the strategy to work for. There are a few main steps are as follows to use the strategy in it's most efficient manner-
1. Pyramiding orders needs to be set to 2 for maximum efficiency of the strategy.
2. 15 Minute timeframe needs to be applied (obvious, we know)
3. Pairs we used to optimise and backtest the strategy should ideally be used when using the strategy-
BTC/USD
ETH/USD
LTC/USD
BCH/USD
We have a list of Visual and Technical features that are implemented into our strategy to make sure it is easy to use, consistent and giving it the highest chance of being profitable.
Visual Features
Colored candles- a visual to notification of an entry.
Stop-loss line- a horizontal red line to show the user where the stop-loss has been placed. Our testing proved a horizontal stop was more profitable than implementation of a trailing.
Price Bands- a dynamic price band to show the direction of the trend and support zones.
Technical Features
Trend Confirmation- Our algorithm fires entries only on trend confirmation and looks to trade the move for as long as it can, while also filtering out any false entries.
Aggressive and Conservative Entries- Two different types of entries have been incorporated in the strategy to maximise profit.
If you have discord alerts access, be sure to watch out in the discord for entries!
In den Scripts nach "crypto" suchen
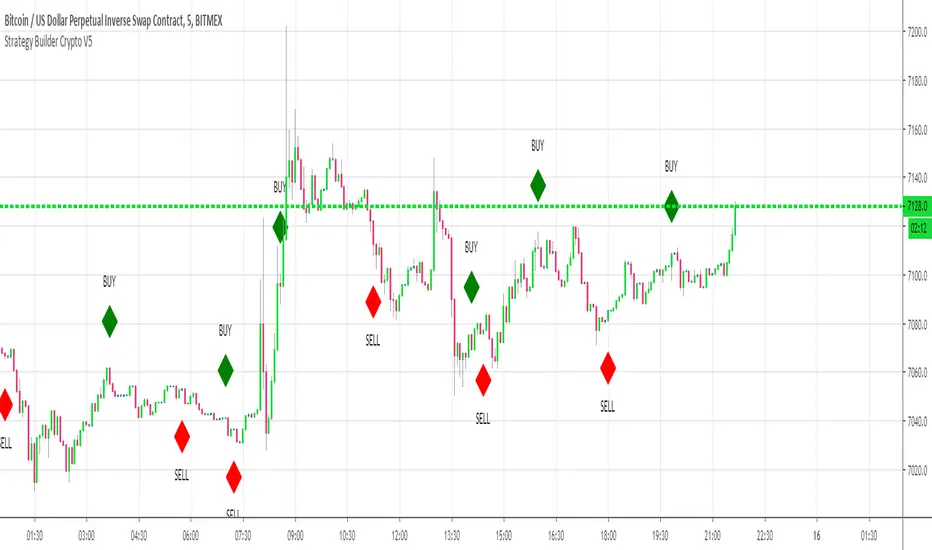
CS Buy/Sell Strategy (read the description)Get Buy/Sell signals and check their profitability in the Strategy Tester.
This script has been tested for the crypto space (Bitcoin, Ethereum, etc.) but works for other assets, as well.
I recommend to apply strategy tests on different time-frames (usually daily and 4hr work best) and go with the most profitable ones.
In the settings you have the ability to test the strategy using from - to dates to narrow down best profitable trade periods.
In order to add this strategy to your chart, click on "Add to favorite scripts" and in then, in your chart, go to Indicator and add it from your favorites.
If you have questions, please send me a message.
There is also a Long/Short focused script available with the ability to set alerts (requires an invite). If you want to add it. Just send me a message to get an invite:

CoinStudio Signals Full (read the description)CoinStudio Signals Full displays long and short, as well as reasonable targets and allows to set custom alerts based on them.
Possible targets are flagged as "C" for the most previously occurred signal. These targets indicate chances to sell before an expected reversal.
If the signals switch from let's say Short to Long and there are no targets between them, it either means the signal failed or the target is falling together with a new signal.
CoinstudioSignals work for any asset (crypto, stocks, gold , silver , etc.) and work for every time-frame.
However, daily and 4hr usually give the best results.
To add this script, please send me a message and ask for an invite!

CS Signals Lite (read the description)CoinStudio Signals Lite displays long and short entries.
Additionally, the Full version supports custom alerts based on the signals.
To get access to the full version and alerts, please message me for an invite.
The signals work for any asset (crypto, stocks, gold , silver , etc.).
In principle, the signals work for every time-frame but depending on the asset some work better than others.
However, daily and 4hr usually give the best results.

CS Signals Full (read the description)CoinStudio Signals Full displays long and short entries and allows to set custom alerts based on them.
The signals work for any asset (crypto, stocks, gold, silver, etc.).
In principle, the signals work for every time-frame but depending on the asset some work better than others.
However, daily and 4hr usually give the best results.
To enable this script, please head to our Discord and ask for an invite:
discord.gg

Bar RatioBar Ratio is an indicator tool that provides real-time likelihood of the current bar closing up or down (green or red).
Technical status, volatility and time are key elements in this indicator.
From the open of a bar, a ratio of 50% is assumed before changes from factors are considered.
The factors that change the likelihood of a bar closing up or down and their relative weight are listed below.
Micro-Trend observed over the last 20 bars - up to 2.5%
Macro-Trend observed over the last 70 bars - up to 2.5%
Current bar price against beginning of Micro-Trend - up to 2.5%
Combination of significant change above average volatility and move against direction of Micro-Trend - up to 2.5%
Combination of significant change above average volatility and move against direction of Macro-Trend - up to 2.5%
Previous bar direction up to 10 consecutive bars - up to 3.75%
Current status of bar (higher or lower) - up to 3.75%
Significance of change against average volatility - up to 5%
Time until bar close - up to 25%
Total: 100%
If all factors are synchronised, the likelihood of the bar closing up or down can be indicated at a probability of 100%.
While the practical ability for this to be used for trading is limited, the tool can be useful for choosing when it is safe to open a trade.
Time is a key element as the likelihood of the bar remaining at current status by the close of the bar is constantly increasing.
The accuracy of this tool is incredible and should be noted as it's primary trait.
You can find and use this indicator on any time-stamp or security such as Cryptocurrency, Forex, Stocks or Indices.
The Bar Ratio can be located by searching in your public indicator library at the top of your chart and adding it to your screen.

Directional Momentum Flux StrategyDirectional Momentum Flux (DMF) is a compound indicator designed to surface signals of projected change in directional momentum. The primary goal is to identify possible momentum inflection points and signal them before they happen, which is reached by applying a set of well-known high-level indicators (e.g. DEMA, RSIs, CCIs and VWAP), lower-level indicators (e.g. BOP, PPO and RMOMO), and some special sauce brewed in-house by yours truly.
This strategy is invite-only. Invitations are offered for a one-time fee of $250 payable in several cryptocurrencies (ETH, BTC, DASH, XMR or ZEC). Once you've got an invitation, you will automatically receive updates forever*.
DMF was designed to work across multiple asset classes. Extensive backtesting has been performed over multiple sample series (not just during the bull runs, for example) and against a randomized pool of assets. But don't take my word for it, I've included some time-based backtesting support tools to make it easy-peasy for you to validate the results yourself!
Under the hood, DMF is powered by numerous indicators, including:
✓ Double EMA & Composite SMA;
✓ Double RSI (fast & slow, variable);
✓ Composite StochRSI & VWAP (StochRSI+, two series);
✓ Composite Commodity Channel Index (CCI+, two series);
✓ Volume-Weighted Balance of Power (BOP itself was adapted from BOP_LB, kudos to LazyBear);
✓ Percentage Price Oscillator (PPO, split, two series);
✓ Range-adjusted Momentum Oscillator (RMOMO, my fancy MOM variant);
It crunches all that data and generates signals which are issued in two ways:
✓ Vertical Bands (or VBs) - Entry/Exit windows as vertical bands that remain "lit" (e.g. the background of a series of candles is semi-opaque white) while the top-level signals are showing sufficiently strong BUY signals. These windows are the primary entry/exit targets and can be relied upon with sufficient risk mitigation (e.g. a reasonable stop-loss or other scale-out exit mechanism). A VB followed immediately by an egg is as good as gold.
✓ Eggs - Entry/Exit validation signals that confirm the condition indicated by VBs. A lit VB without an egg in the same or next candle session is considered to be valid , but not safe (see above warning). Waiting for an egg can improve performance at the risk of missing the best possible entry point. Consider your risk tolerance and act accordingly.
Basic Instructions:
✓ Configure The Settings! The defaults are pretty good, but don't be scared to try variations. For example, by default SHORT positions are disabled. You might want to enable them if your risk tolerance allows them. (IMO there's gold on both ends of the rainbow. 🌈)
✓ Pay attention to the VBs. If you see a lit band being placed in an otherwise dark area, it's a projected inflection point. This is expected to be validated and confirmed in the same or immediately following period with an egg. You can enter a LONG position at this time.
✓ Pay attention to the eggs. If you see an egg, it's a confirmation that the VB changes in the same or immediately preceding candle period is valid. If you did not enter or exit your position at the point of the VB shift, now is the time to do so.
✓ Watch for the end of a VB period and be prepared to exit your position quickly as the next egg may be accompanied by a large directional momentum inflection.
Things to Note:
📉 - DMF is designed for day trading with aggressive position TTLs (15m was the upper bound during development and strategy testing). It appears to issue valid signals for other intervals, but it was not designed for >15m and YMMV. Don't go manually opening a LONG with no exit strategy and go to sleep... it probably won't work out to your benefit. You should be prepared to exit positions at any time. (Pro tip: automation is your friend!)
💸 - DMF indicator is not free from risk. As with all investment strategies, it is crucial to exercise caution and only trade with funds you are comfortable losing. DMF does not offer any form of guarantee or warranty, implied or otherwise. If you lose money, your house, your 401K... that's on you. (Pro tip: don't risk anything you're not ready to lose, because losses are part of the game and you WILL have them.)
🤔 - By using this indicator, you understand that any and all risks are the sole and complete responsibility of the end user (yeah, that's you). Don't use it if you're not 100% clear that you know exactly what you're doing. (Pro tip: always ask questions if you're feeling confused.)
⏱ - * Forever in this context means that, where room for improvement exists, I will improve it over time and you'll get all updates until I stop making them. (Pro tip: nobody lives forever.)

Hedging CryptocurrencyПри написании скрипта автор мотивировался статьей о хэджировании криптовалют . Для работы с данным скрипом необходима установить дневной таймфрейм.
Скрипт " Hedging Cryptocurrency ", по своей сути, является стохастическим осциллятором данных спрэда между ценой (годичной давности) на BTC и равноценным количестве выбранного альткоина. Стоит сразу заметить, что для корректного использования данного скрипта необходима выбирать инструмент вида XXX/USD (где XXX - выбранный альткоин, а USD - стабильный альткоин, привязанный к доллару). В настройках можно включать/выключать сигналы на покупку (зеленые точки) и продажу (красные точки) альткоина. Закрывать сделку можно, когда осциллятор перешагнет нулевую отметку. ВАЖНО, что для хэджирования криптовалют, при открытии сделки на альткоин, необходимо также открыть сделку и на BTC, но уже в обратном направлении. Кроме всего перечисленного сам осциллятор имеет градацию зеленых и красных оттенков, которые говорят об условной перекупленности и перепроданности соответственно. Добавлю, что индикатор чаще ошибается при низкой корреляции между инструментами, поэтому в такие моменты он начинает сигнализировать черными крестиками. В этих ситуациях скрипт не гарантирует ту точность, которую может предложить :-)
Само собой данный индикатор только инструмент, а его сигналы не являются абсолютно верными, поэтому с большим удовольствием почитаю в комментариях ваши предложения по его усовершенствованию.

Pump|Dump Tickerthis is just a study to investigate the pumps and dumps that have been happened in a crypto market and it should not be used as an indicator. this is also my very first Pine Script that I've written and I am sure it is not perfect. actually I am curious to know when (I mean the exact time of the day) most pumps and dumps happen as a self investigation. the method that is used to define pumps and dumps is not good (and I know that) but I will modify it for better result in next version.
to use this study, you should define whether you want to display pumps or dumps or both and also you should define percent of change (threshold).

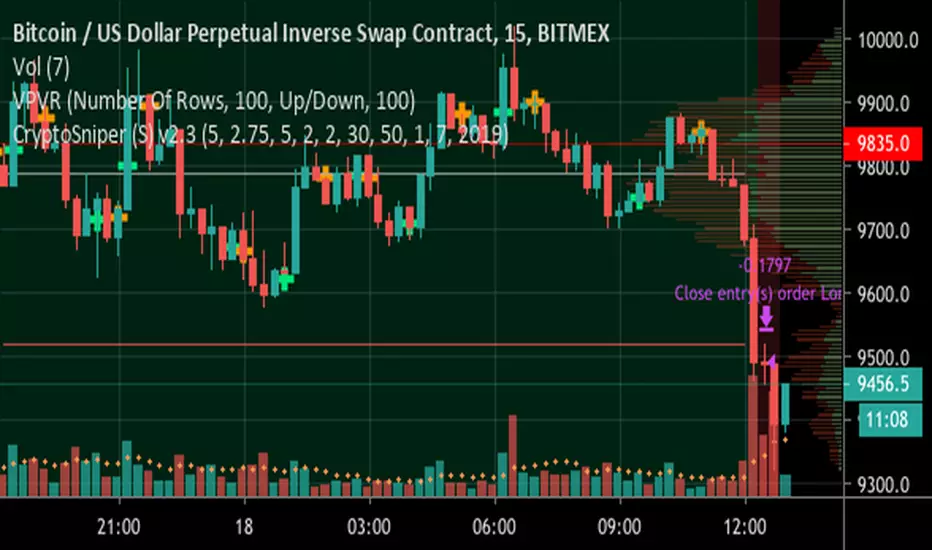
ck - CryptoSniper (Strategy) v2.1This strategy is radically different to the v1 script previously released.
It has ***NO REPAINTING*** - as such the algorithm had to change to remove it’s reliance on HMAs from future timeframes to establish trend, this is now accomplished with EMAs.
It is completely written in Pinescript v4.
It has integrated Stoploss and you can plot this & with the recommended Entry on the chart.
WARNING - This strategy has to be “tuned” to the instrument you are trading, for example, Bitcoin. The default settings work well for BTC/USD, XBT/USD on 15m chart timeframe but not for ETH/USD - it is possible the default settings will work with other crypto’s but I haven’t had time to test - if you find good settings PLEASE share them!
How to use:
1) Load up your favourite chart/instrument and select your favourite timeframe
2) Adjust the “signal” EMA and “baseline” EMA settings until you get the majority of uptrending moves highlighted with a green background and the majority of downtrending moves with a red background. The signal has to be faster (that is a lower number) than the baseline.
3) Adjust the “Sensitivity” - this will plot more green & orange Trigger points on the chart.
The strategy waits until in a trend, for example, a Long (green background) then waits for first green cross before opening a deal. It will Trigger a sell if the background turns red (downtrend) and a orange cross is printed.
4) Fine tuning:
A) Increase your profits by changing the Stoploss value - getting this right protects you from bad trades but also resets the indicator to provide another alert faster
B) You can increase the delay positions are opened or closed with the “Bar(s) offset to open position” and “Bar(s) offset to close position” settings. When you adjust these, 0 will buy/sell immediately when a Trigger cross is printed, 2 will wait until 2 bars/candles AFTER the Trigger cross prints to strat/close a position.
TIP: When adjusting indicator settings, load your chart and timeframe first.
Add the indicator/strategy (if you haven’t already).
Click the Strategy Tester tab at the bottom of the chart window so it is visible.
Open the strategy/indicator settings so you can see this wind AND the Strategy Tester display
Change a setting and click into a different setting input box, this will update the test results WITHOUT closing the settings window! This will save you a lot of time!
Write down any OK settings you find, you can come back later to fine tune them!
Please provide any feedback & let’s share the best settings for different crypto’s!
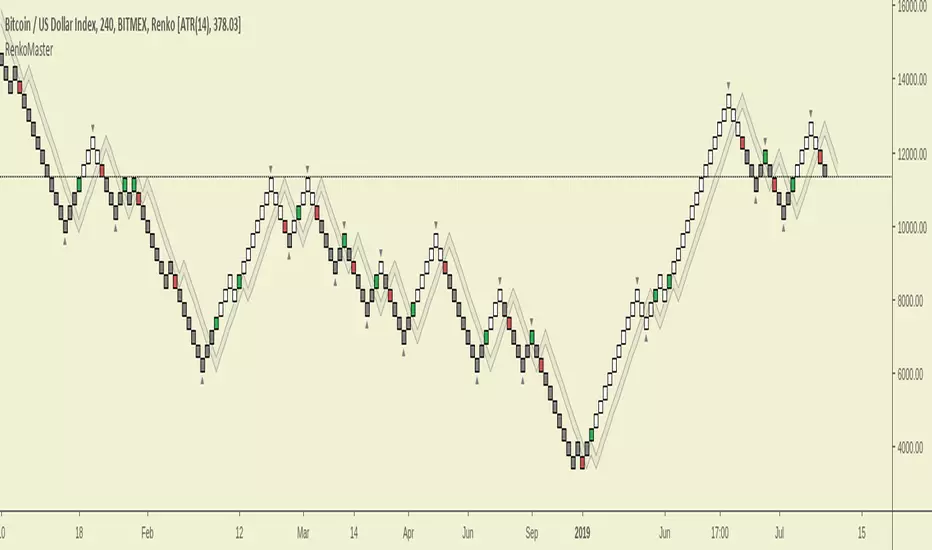
RenkoMasterRenkoMaster is a variant of our popular TrendMaster Script with adjusted parameters. It can be used to provide confluence when determining Renko entries and exits.
Setting Up The Indicator
After purchase, open the TradingView indicator library. Under the Invite-Only Scripts section, you will see RenkoMaster. Add it to your chart. Next, you must customise your theme settings to allow RenkoMaster to take over control of your candle colours. You can find a complete set-up tutorial on our website.
Candle Colours
By default, RenkoMaster will colour your candles in black and white. White candles indicate an uptrend in an asset and the candles will not change colour until the trend has reversed and a counter-trend signal has been printed. Black candles indicate a downtrend, they will remain black until a counter-trend long signal candle has been printed.
Signal candles
A signal candle is printed when the price of an asset closes above or below the moving average cloud and the medium term trend moving average. By requiring two criteria for a single candle to print we will see a drastic reduction in the number of false signals.
The RenkoMaster entry technique further reduces the likelihood of false entries. To enter a trade we do not buy the signal block immediately. Instead, we treat the signal block as an indication that a trend change is possible. We want to see confirmation of this trend before making an entry. To enter we place a pending order a few ticks above or below the high or low of the signal block. By doing this we only enter a trade when the asset has shown a continuation in the direction of the suggested trend change.
Our Story
Founded in 2018 by IchimokuScholar and C00kie, TrendMaster is a team that produces technical analysis indicators with an emphasis on simplicity and noise reduction. We support a large community with educational content, automated market scanners and mentoring in our private chat rooms. We produce technical analysis indicators geared primarily towards the emerging Cryptocurrency asset class. We provide educational material to assist trader development and host a large online trend following community. All of our products are designed to help traders distinguish relevant information from background noise. Our indicators encourage disciplined trade management to maximise the opportunity captured while minimising losses.
IchimokuScholar
IchimokuScholar – In 2017 I retired from a career in higher education to focus on Trading. I like to trade long term trends, focusing primarily on continuation setups. I am dedicated to sharing my knowledge of trading and take great pleasure in simplifying technical analysis for newer traders.
C00kie
I started trading crypto in 2017 and immediately started coding a bunch of tools to improve my quality of life. Some definitely worked out better than others. Like to trade the higher timeframes and drawing horizontal lines on charts. I am also pretty much obligated to like cookies.
kiska clouds backtest editionkiska clouds: crypto twitter's next cloud meme
Crypto is a fast-paced, highly-volatile asset, therefore, many traditional strategies are thrown out of the window when applied to cryptocurrency markets. In trading, there are only two things known for sure: price and volume . Price and volume data is then manipulated using various math equations in an effort to discover patterns and/or make predictions. kiska clouds are no different.
The kiska clouds are a simple crossover strategy. The clouds are different because of the unique averages being used and the embedded momentum indicator .
To use the clouds is simple:
When the green line crosses above the pink line, you buy/long.
When the green line crosses below the pink line, you sell/short.
The clouds are indicative of the trend's momentum. Using the power of math, the larger the cloud indicates a higher amount of buying/selling pressure. As the cloud thins, momentum is slowing, and the trend may be reversing.
At the time of testing, the strategy had a profitability of 54.55% accuracy with 1133.41% net profit. While I think this could be automated into a bot, adding a human element with stop losses and further analysis will significantly improve the accuracy/profitability.
This indicator is the backtest version of the kiska clouds (). For a trial or to purchase this indicator, send me a message on Twitter @moonkiska or here on TradingView. You will be granted a 2-3 day trial period to the backtesting strategy.

kiska cloudskiska clouds: crypto twitter's next cloud meme
Crypto is a fast-paced, highly-volatile asset, therefore, many traditional strategies are thrown out of the window when applied to cryptocurrency markets. In trading, there are only two things known for sure: price and volume. Price and volume data is then manipulated using various math equations in an effort to discover patterns and/or make predictions. kiska clouds are no different.
The kiska clouds are a simple crossover strategy. The clouds are different because of the unique averages being used and the embedded momentum indicator.
To use the clouds is simple:
When the green line crosses above the pink line, you buy/long.
When the green line crosses below the pink line, you sell/short.
The clouds are indicative of the trend's momentum. Using the power of math, the larger the cloud indicates a higher amount of buying/selling pressure. As the cloud thins, momentum is slowing, and the trend may be reversing.
At the time of testing, the strategy had a profitability of 54.55% accuracy with 1133.41% net profit. While I think this could be automated into a bot, adding a human element with stop losses and further analysis will significantly improve the accuracy/profitability.
This indicator is a "Pay What You Want" model. For a trial or to purchase this indicator, send me a message on Twitter @moonkiska or here on TradingView. You will be granted a 2-3 day trial period to the backtesting strategy.
Tips:
The higher the time frame, the more accurate the strategy.
Personally, I do not short above the 200MA. I do not long below the 200MA.
Coming Soon:
Support/Resistance
Trend Lines
TrendaidTrendaid
is exactly what the name says
an Aid to Trend
Use this strategy to understand when the trend may shift and then use it to stay in the trends longer
simple strat
Buy when it says BULL in BLUE
Short when it says BEAR in RED
you may close your orders when it says to in PURPLE but unneeded if you want
You can adjust the stop which affects the scripts performance
You may also change from a Long to a Short line but the standard has proven to be the best overall
Let Trendaid guide you to riches
this was primarily designed for #forex but can be used in any market including #crypto
get access by joining the #CCV trading family by visiting the link below
- Cheers
SatoshiHeavy Market analyst for CCV Trading
www.cryptocurrentlyvip.com
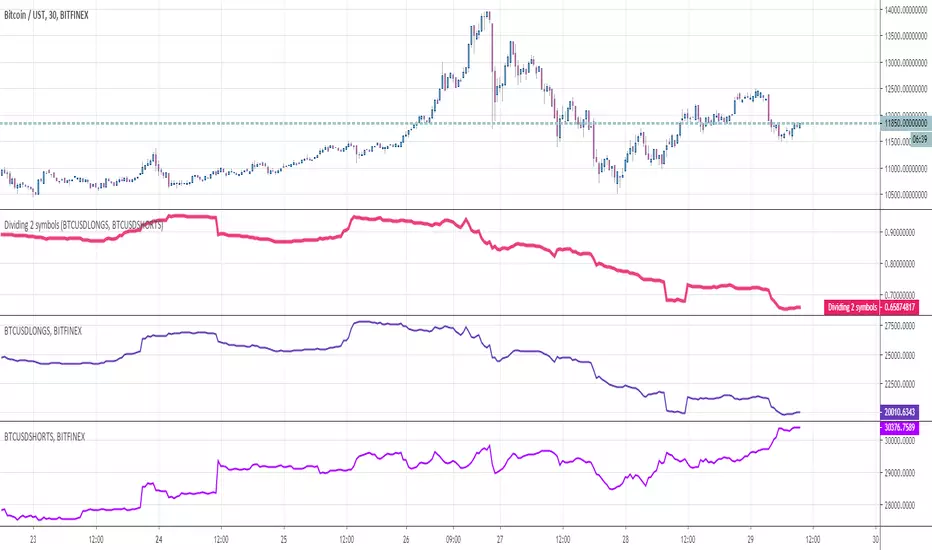
Dividing 2 symbolsHello Traders
This indicator is used to divide two assets between them. Why you would ask ?
For instance, in crypto trading, traders often look at the ratio Longs/Shorts or Shorts/Longs to figure out which side is leading the market and use this information as a powerful hedge for their next trade
Enjoy
Dave
TTPro CryptocurrencyImpulse v12// TTPro CryptocurrencyImpulse is a crypto strength meter that shows us which currencies are
// strong or weak on any chosen timeframe. Buying into strength and selling into weakness is the key.
// We have an advantage with this indicator in seeing strength and weakness at a glance and also
// in being able to spot reversal opportunities when the lines cross over.

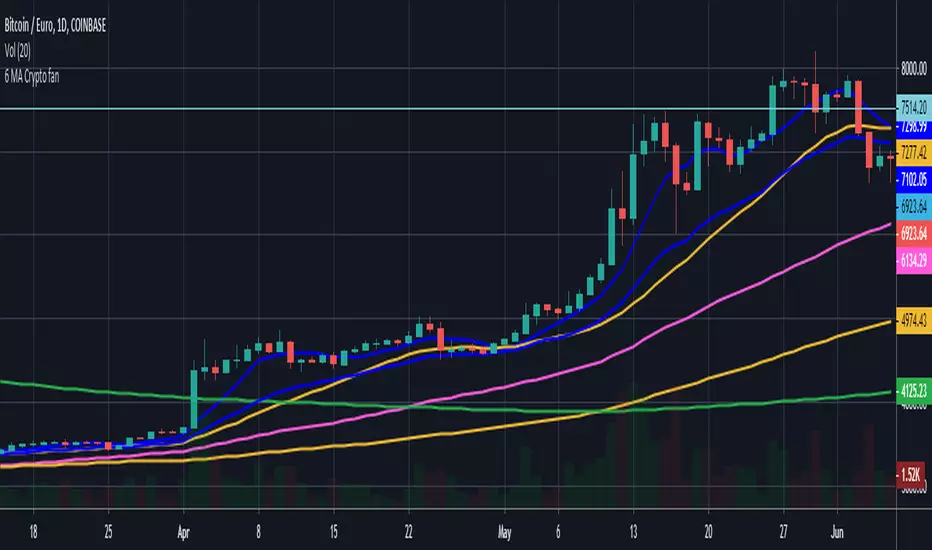
Krowns 10 PACK Combo (5 EMAs, 5 SMAs) - v2Version 2 - Krowns Crypto 10 pack moving average set - written by "Kick Back Time" also known as Mr.Scrogers Neighborhood
...after receiving a lot of likes from the first version I thought I would go ahead and put out the updated version that I've been using
There's a few things I've changed to make it easier to adapt to.
This set is very similar to what Krown uses - I rarely look at the 100 SMA, but I do like the 128 SMA, so I made it default over the 100...
It's all adjustable in values, colors, line thicknesses, etc... it's all good
Tweeks/Improvements:
1) now has a shorter overlay title so it takes up less space on the chart and is less distractive
2) the 30, 50 and 128 SMA's are now default pink which stand out well and are easier to associate as SMA's
Dollar Cost Average [lorencip]This indicator shows the return of a dollar cost average strategy.
The 4 values in the output are:
the amount of the investment
the number of items purchased for that symbol
the total value of the items purchased
the result of the investment in percentage
This first version works with cryptocurrencies and currencies, it's not accurate for stocks (it "purchases" decimals of a share/stock).
Lorenzo Cipriani


Asset Correlation Tool v3, improvedI found this useful tool among the indicators but it wasn't doing the correlation study correctly.
Everything in markets, with only a few exceptions, are rising in value over time and therefore trended to time. The simplest method I found is to use link relative or first difference detrending, before calculating a correlation between assets.
I also updated it to include more assets, to use the latest Cryptocap indices like BTC.D/ETH.D/TOTAL2 and the top 100 crypto index CIX100. I improved the colour schemes, too
Included in the source code are some other ideas like the FRED:M1 and FRED:M2 (only on daily charts), the Yuan/Yen/EUR/USD, etc. There's lots of scope for correlating unrelated markets.
I'll keep updating it as I use it to find truly correlated assets. Some kind of signal line of known correlations, to subtract from the baseline fuzz of market activity.
Any improvements are most welcome; I'm a novice at best at statistics and build on others' work.
- mabonyi
