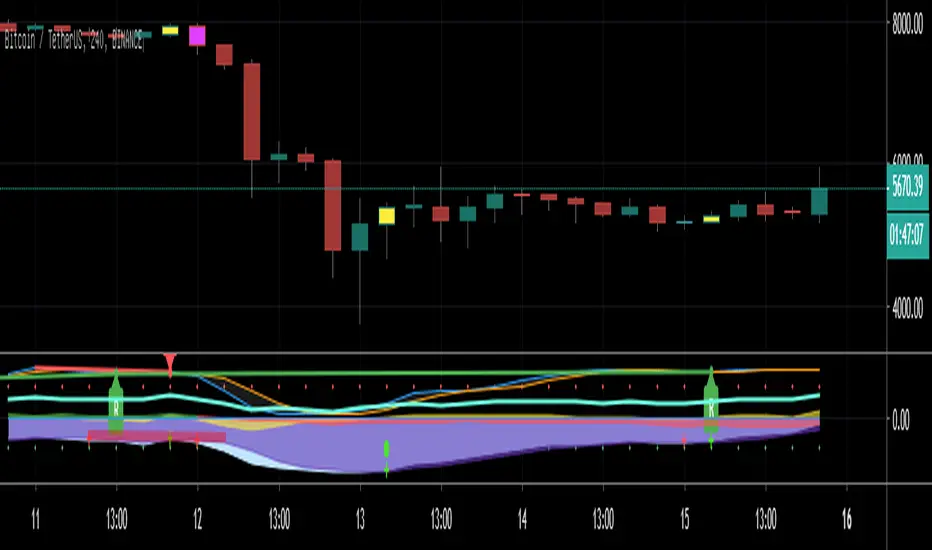
Noldo Blockchain Cryptocurrency Indicator
Hello, this script has the same logic as Noldo CFTC COT Forex Indicator :
And Noldo CFTC COT Commodities Indicator :
*
Script briefly calculates the period length between two signals of Pivot Reversal Strategy when new signal arrives and allows us to see relative Blockchain data and price changes of Major Cryptocurrencies over that automatic length.
This saves us from the hassle and time wasting of searching for a reference point.
Usage
This script works only on all Bitcoin / U.S Dollar pairs and futures.
It only works on 1W graphics.
ICOT data are pulled via Quandl
NOTE :
Since blockchain data is very votalile, 7-day ema values are adjusted to take into account.
Regards.
In den Scripts nach "crypto" suchen
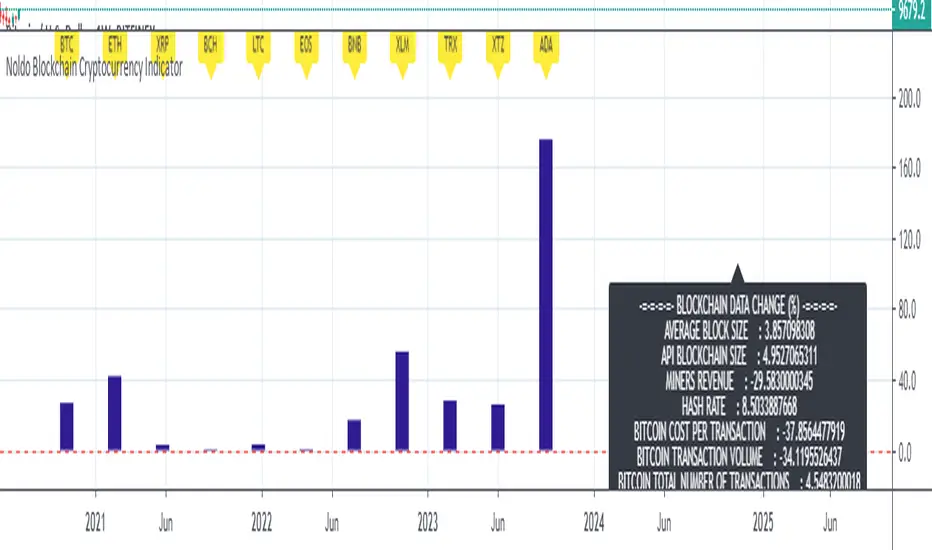
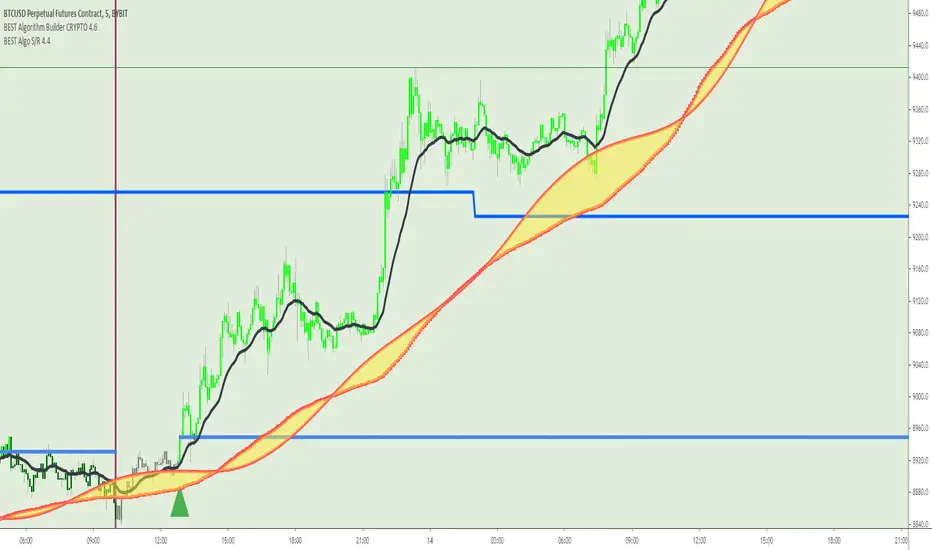
Laguerre Filters Crypto Scalping Tool This is an indicator designed to follow trends on the 15m/30m/1h Timeframe. It works best if you can recognise a larger trend into a direction and combining it then with for example longing the dip. Escpecially for crypto assets this can be used for scalping and if paired with S&R can be an especially powerful tool if paired correctly. Like it is shown here.
As soon as there is a flip to green for example with upwards momentum over the last period of time and no higher Timeframe Resistance ahead. On lower timeframes like the 15m and 30m this can be used for scalping and works especially well in Ranges, say for example a 100 Tick range. At the time of writing we heavily used this Indicator for scalping up and down the current bitcoin range and it worked suprisingly well.
One user was able to trade the EOSUSDT pump, chart shown here.
The cool thing is that the single filters can also be used as a Trailing Stop.
If interested please direct message us. Thank you !
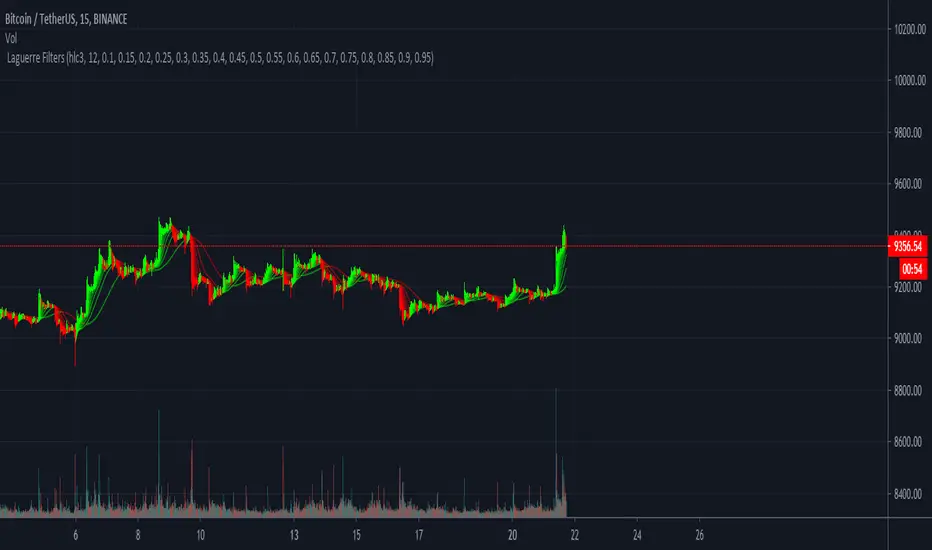
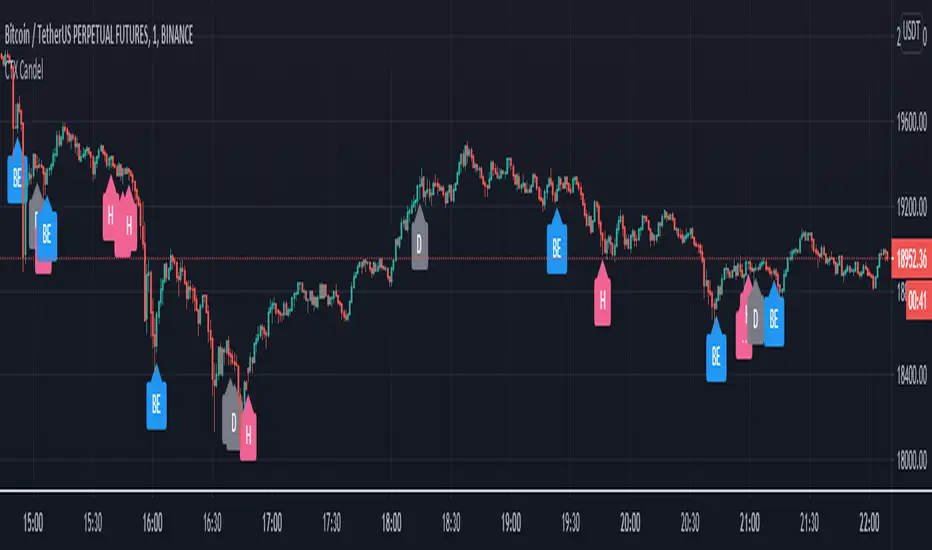
Crypto Trader X Candelstick PatternsCrypto Trader X Candelstick Patterns
this andicator contain all candelstick patterns
Bullish & Berash Engulf Candel, Doji & Dragonfly Doji Candel, Hammer Candel, Hanging Man Candel
inverted Hammer Candel, Shooting Star Candel, Marabuzo black & White Candel, Spinning top black & White candel
Abandoned Baby Bearish, Abandoned Baby Bullish, Gravestone Doji Candel, Harami Bearish Candel, Harami Bullish Candel
Kicking Bearish Candel, Kicking Bullish Candel, Long Lower Shadow Bullish Candel, Long Lower Shadow Bearish Candel
Morning Star, Three White Soldiers, Three Black Crows, Tri-Star Bearish & Bullish, Engulf bar color, Reversal bar , bar color
Cracking Cryptocurrency - IchimokuCracking Cryptocurrency Ichimoku
The Ichimoku Cloud is designed to measure both momentum and trend. This script is optimized for **Cryptocurrency** by default but the settings can easily be adjusted from the Input Window to trade on any asset.
The core of the Ichimoku Strategy can be broken down into two facets, depending on whether you prefer to trade short-term or long-term. The Ichimoku is a trending indicator by default, it will not catch bottoms or tops. It is a momentum indicator .
Features & Functions
Multiple Time Frames Feature: With this feature, you can view the Ichimoku of a different time frame than you are currently viewing. This is very useful for looking at daily support and resistance (Kumo, Chikou) but wishing to trade a different strategy (Price Action, Moving Averages, etc.) on a lower time frame.
Short-Term Strategy
Revolves around Tenkan and Kijun crosses. Should the Tenkan crossover the Kijun, that is a bullish indication, and a signal to buy or go long.
Conversely, should the Tenkan crossunder the Kijun that is a bearish indication, and a signal to sell or go short.
In the settings, you can choose to plot Tenkan/Kijun crosses. With this option selected, several things will occur when Tenkan/Kijun crosses happen.
1. The current bar will change colors depending on whether the signal is a buy or a sell. Buy = Aqua, Sell = Fuchsia
2. A dot will appear on the Tenkan. Buy = Green, Sell = Red
3. A label will appear above or below bar indicating the correct decision. Buy = Buy, Sell = Sell.
Long-Term Strategy
Revolves around price closing above or below the Kumo Cloud itself. Should price close above a bearish Kumo Cloud, that is a bullish indication, and a signal to buy or go long.
Conversely, should price close below a bullish Kumo Cloud, that is a bearish indication, and a signal to sell or go short.
In either case, it's important to understand what the cloud breaks are representing. They are representing a potential shift in the dominant trend. Ichimoku attempts to identify when that shift happens, so we can get on the side of the emerging trend.
In the settings, you can choose to plot Kumo Cloud Breaks. With this option selected, several things will occur when Kumo Cloud breaks happen.
1. The current bar will change colors depending on whether the signal was a buy or a sell. Buy = Aqua, Sell = Fuchsia
2. A label will appear above or below bar indicating the correct decision. Buy = Buy, Sell = Sell.
---
Please note, that the Kumo Cloud Breaks indicate stronger signals, and thus more weight should be given to them than TK Crosses. However, depending on what time frame you are trading on, Kumo Cloud breaks are a rarer occurrence than TK Crosses.
---
Additional Features
---
The Chikou (Lagging) Spam is run through a Zero Lag filter. The reason for this is aesthetic. The smoothing can be disabled in the input windows.
The purpose of the Chikou Span is to identify Support and Resistance.
If you have any questions, success or failure stories, or seek advice feel free to send me a private message here on Trading View. Trade safely.

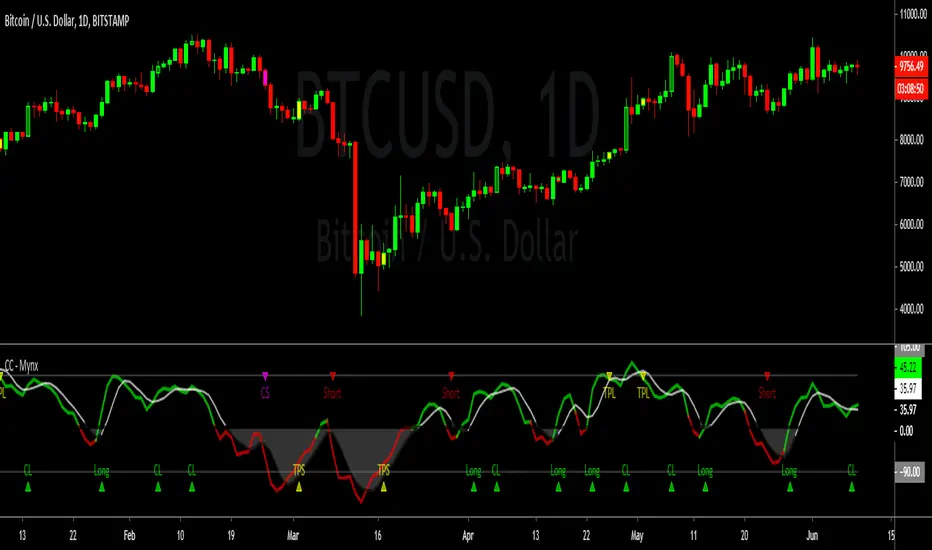
Cracking Cryptocurrency - MynxCracking Cryptocurrency - Mynx
Mynx is a powerful trend-following indicator which logic built in to facilitate nuanced aspects of PTP strategy. Continuation Trades, Early Exit Signals and Full Take Profit Signals are all built into Mynx. Mynx is designed to identify when the market is signaling that a trend is beginning as well as signalling when you may safely re-enter into a pre-existing trend. It also tells you where to exit prematurely to avoid significant capital loss on a losing trade, and when to take full profit in order to get out of a position at maximum profitability.
Should you have difficulty adding it you can search for 'Cracking' in the indicator window of your Trading View Platform, and it will appear along with the rest of our indicators.
As you will notice, Mynx is similar in nature to Time Transformation, in that it is both a Centered Oscillator and a Line Cross Indicator. This allows a wide range of possibilities which we will exploit to extract profit out of the market.
The most important line is the BPM or Mynx Line. This is going to be the thicker, brighter colored line on our indicator that will switch from green to red depending on the dominant trend. The color changing feature of this line will denote where our indicator is in relation to our zero line. If our BPM Line is green, then price is trading above our zero line, if red than it is trading below. Therefore we can quickly see what our last signal was, and whether our indicator is bullish or bearish depending upon the color of our BPM Line. If Green, we are in long territory, if red we are looking for shorts.
Our second area of importance in this indicator is our Noise Line and Area. This is the black or white line which will change color depending on where Noise is relative to our zero line. Black if above the zero line, meaning we are in long territory, and white if below, indicating we are in shorting territory. The area between the zero line and the Noise Line is shaded black or white as well, and denotes no-trade zones for us. If our BPM Line is within our Noise Area, we are not in a trade. We are only in a trade when our BPM Line is breaking away from Noise Line, either to the upside or the downside. When BPM curls back and re-enters our Noise Area, that is an indication to exit our position regardless of our Take Profits or Stop Losses.
Our Zero Line is indicated by a thick black line for easy of identification, which will be our primary signal generator when our BPM Line crosses above or below it, and our faint gray lines are going to be our Overbought and Oversold levels respectively. These will play a function in how we take profits.
Settings
Let's take a look at the settings of our Mynx Indicator.
The first field we will see is our BPM Source, how many beats per minute we want in our cycle length. The default is ten, and through back-testing I find this to be the optimum level.
Our Noise Filtration level corresponds to our Noise Line and Area. Again, I find the default settings as I have programmed them work best on all time frames, however you might find optimum signals by playing around with these settings. As in all things, nuance and experimentation is what excellence is borne of.
We can adjust our Oversold and Overbought Parameters, making it easier or harder for us to get a Full Take Profit Signal from this indicator. We can also adjust our Base Line. Keep in mind, our Base Line is going to be an Exponential Moving Average and here we can adjust the length of our desired Base Line.
To incorporate our Multi-Time Frame feature, below this section we can see that the default option will be to use a Base Line of the current time frame. If however, we want to trade on a Lower Time Frame and reference a base line of another time frame, we can simply un-check that box and input the desired Time Frame of the Base Line we wish to reference.
Now for the true appeal of Mynx in user friendliness, below this we can see that we have full control of the signals we want Mynx to generate for us. By default, we have enabled Mynx's best signals, Trending Signals. We can choose to plot Continuation Crosses and Reversals Within the Trend, both of which are trades we are allowed to take and I recommend taking in a proper PTP system. We can choose to use Mynx as a reversal indicator, to plot Raw Reversals against the trend, which I do not recommend enabling unless you want to by pass PTP entirely. We can choose to plot when Mynx gives us a Full Take Profit signal, a signal to take full profits on our position. We also have the option to plot for early exits. The Option for Sensitive Stop Loss is the same as early exits, and will plot an exit signal every time the BPM Line drifts back into the Noise Area. These are fairly easy to see upon bar closes, so I left it disabled by default. If you enable it you will get a visual signal to exit your position upon a bar close.
One final note, we can adjust the source upon which Mynx is basing her signals. By default, this value is hl2 , which I found in back-testing to be the most efficient with minimum draw down. However, there is a higher profit potential with HLC3 and OHLC4, but be warned that with that extra profit potential comes the risk of more draw down. The draw down settles out in the end, however there will be months where you drastically under perform Alpha, where as hl2 keeps you consistently outperforming the market at all times. This is a very personal choice, and I leave it upon you to make the right one.
In our Style Tab, we can adjust our Color Scheme to better accommodate the way that you trade. I have done my best to be very concise and detailed in labeling to make this task easy.
Strategy
Please let me know of your success stories with Mynx, as well as any features you think would be helpful to add. If you notice any errors within it, please notify me so I can fix them. I have back-tested this strategy many times in many different settings, and it consistently outperforms the market and generates Alpha. I now place it within your hands to achieve the same results. Trade Safely.
Cracking Cryptocurrency - QuadrigoCracking Cryptocurrency - Quadrigo
An objective method of determining an initial Take Profit and Stop Loss, based on true market volatility and not arbitrary price levels. This indicator gives the user a powerful range of input variation, from Average to Median True Range and a myriad permutations of smoothing and look back lengths, to build an objective value from which to measure profit and stop levels.
This indicator also automatically calculates a recommended position size based on our position sizing methodology. Simply input your capital amount and desired risk level. This indicator will display your optimum position size in USD or BTC, even giving you the flexibility to select your desired exchange for BTC/USD conversion calculations.
Features & Functions
Set custom multipliers for Take Profit and Stop Loss Levels.
Select between Average or Median True Range Calculations.
Select smoothing type and look back length for True Range.
Input custom True Range Level for dialing in precise measurements.
Position Size Calculator.
Aesthetically pleasing display of Take Profit and Stop Loss Levels.
Aesthetically pleasing dashboard display of all relevant trade information including Potential Loss, Distance to Stop Loss, and TR Percentage, among other data.
Indicator displays quantity of position to be removed at each take profit for convenient order setting flow.
---
Purpose
To give clear objective stop losses and take profit levels based off price volatility rather than arbitrary price levels, percentage points, ticks, pips, etc.

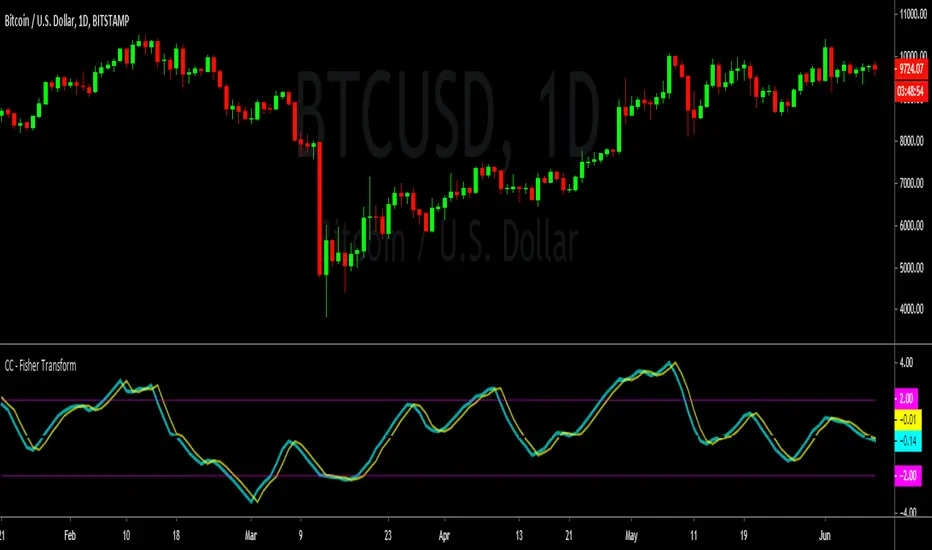
Cracking Cryptocurrency - Fisher TransformCracking Cryptocurrency - Fisher Transform
A modern spin on a classic. John Ehler's formulas helped transform a generation of traders from working with traditional indicators such as Stochastic and moving average filters to applying frequency and wave theory to their price chart analysis. There are few tools as powerful as Ehler's Fisher Transform , which transforms the behavior of price in a Gaussian Distribution, or a Normal Probability Distribution. This allows us to attain a bell curve of price, with our outliers clearly and objectively identifiable as well as accurately indicate trend direction by bisecting our wave into peaks and troughs.
Features & Functions
Simple and Clean. Only the data you want, no unnecessary information cluttering your work flow.
Adjustable Sources. Select which data source you want to compile your data from from an easy drop-down menu.
Adjustable Triggers. Standard versions of the Fisher have been unable to innovate on the Trigger Line, a vital part of utilizing this to generate trade signals and setups. In this version, choose and adjust your own Trigger and Smoothing Filter based on tried and true implementations.
Adjustable Thresholds. Most versions of the Fisher do not truly allow the customization of the algorithm to suit the asset you are analyzing. All thresholds in this version are fully adjustable to customize this indicator to work for you, not against you.
---
Purpose
To remain true to Ehler's original vision of the Fisher Transform while providing traders a functional and efficient indicator with modern innovations and conveniences.
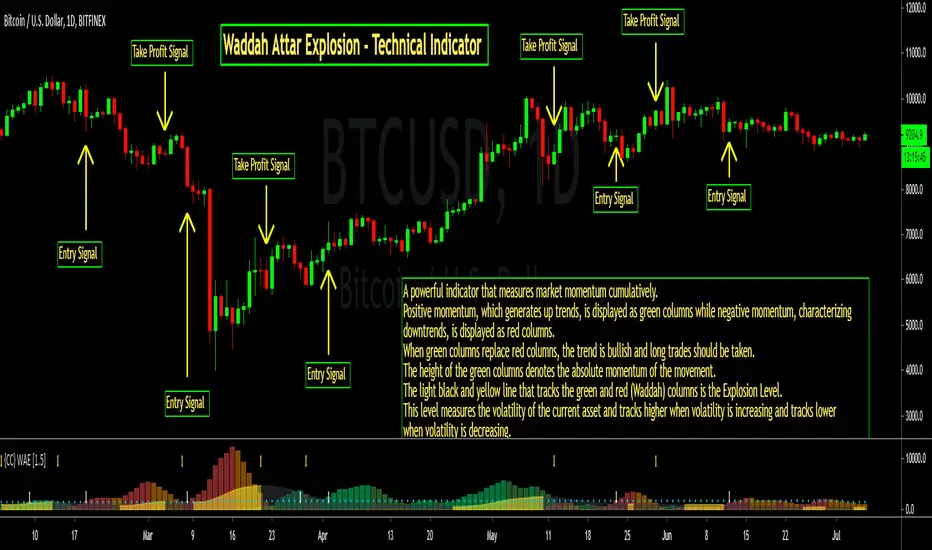
Cracking Cryptocurrency - Waddah Attar Explosion Cracking Cryptocurrency - Waddah Attar Explosion
An entry indicator that analyzes momentum and volume . This indicator is very sensitive and works very well on lower time frames for scalping, and higher time frames for confirming explosive movements or shifts in trend or rising directional momentum in the market.
This indicator can be used as an Initiator, Confirmer, or Vol. Filter. It's multiple components make it an extremely effective tool in any trader's tool belt.
Features & Functions
This indicator can be customized by adjusting the sensitivity levels, lengths, and multiplier. However, I find that the settings that I have made as default work very well. However, as with all indicators, nuance and customizing your settings to your asset class and time frame will yield greater results.
False Positive Filter - Enabling this, as it is by default, will dramatically change this indicator's sensitivity. This is designed to analyze long-term momentum and reduce the occurrence of "false positives". However, the trade off will be reduced reaction speed.
Entry Strategy - Print alerts and trading signals for many different permutations of entry strategies available with this indicator. Explosion Level Crossovers, Color Flips, Rising Explosion Level Cross, and Rising Explosion Level.
Exit Strategy - Print alerts and trading signals for many different permutations of exit strategies available with this indicator. Explosion Level Cross, Receding Delta, Color Flip, Falling Explosion Level.
Bar Coloring - This indicator colors the bars to indicate a buy or sell signal, as well as printing Up and Down arrows in the indicator pane itself. This can be disabled in the settings window.
Alerts - This indicator is programmed with Buy and Sell alerts, available from the Alerts Window.
---
Purpose
To identify likely turning points in the market, the existence of powerful momentum to confirm a directional bias, or the introduction of high volume or volatility into the market.
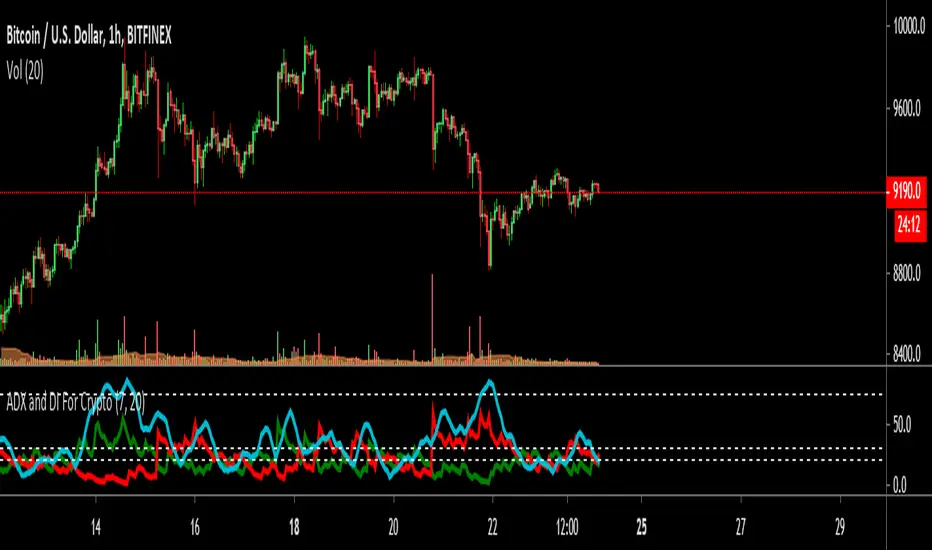
ADX and DI For Cryptocustomized version to add my favourite settings for crypto
Best time frame is daily followed by 4H
ADX Near 20 or less means trend is choppy and weak
ADX Cross over 30 means trend is starting to gain momentum
ADX Near 75 means momentum is near maximum, trend needs to rest for a while ( The area between 70~90 )
The MATRIX: Ultimate Crypto Position FinderThe Position Finder is a visual representation and additional feature of the "MATRIX Ultimate Crypto Position Strategy" and it should therefore be used alongside this script.
***You can find the main trading strategy script on our profile page***
-------------------------------------------------------------------------------
-The Position Finder is a tool that allows the user to see multiple triggers at the same time on a single chart of the "MATRIX Ultimate Crypto Position Strategy".
The Position Finder consists of 3 parts, namely an entry, a re-entry and an exit part (from top to bottom). Each of these three fields is made up of several green, black or red horizontal lines in which each line corresponds to a specific trigger.
-An entry or re-entry signal is valid once all individual triggers turn dark GREEN at the same time (for the top and middle matrix fields respectively). When this happens a bright GREEN vertical line is formed. The main trading strategy script will also print "Long Entry" label. While BLACK color indicates that a certain trigger is not valid. Yes, we know. It sounds very complicated, but once you understood it, we promise it will be the most simple and dare we say, an interesting tool to use.
-An exit signal is made once a single trigger turns RED. The main trading strategy script will also print a RED colored "Long Exit" label. While BLACK color indicates that the exit signal is not triggered.
-------------------------------------------------------------------------------
For those who are interested in the rationale of why a certain entry or exit signal was made a list with triggers can be found below. It contains the complete set of triggers for the entry, re-entry and exit signals from top to bottom.
Entry Trigger List:
1: Evaluation of short term trend: Ichimoku kinko hyo indicator, conversion line related to base line.
2: Evaluation of longer term trend: Ichimoku kinko hyo indicator, price related to the ichimoku cloud.
3: Confirmation of the longer term upward trend: Ichimoku kinko hyo indicator, lagging span related to ichimoku cloud.
4: Confirmation of short term upward trend: Ichimoku kinko hyo indicator, price related to conversion line and base line.
5: Evaluation of longer term trend projection: Ichimoku kinko hyo indicator, projected ichimoku cloud shape.
6: Confirmation of short term trend: Ichimoku kinko hyo indicator, lagging span related to the price.
7: Confirmation of short term trend: Ichimoku kinko hyo indicator, lagging span related to the price (alternative method).
8: Confirmation of the longer term trend: Ichimoku kinko hyo indicator, lagging span related to ichimoku cloud (alternative method).
9: Confirmation of the longer term trend: Moving averages.
10: Confirmation of sufficient momentum: Macd indicator.
11: Evaluation of overbought or oversold conditions in the price: RSI indicator.
12: Evaluation of price equilibrium: Ichimoku kinko hyo indicator, price related to ichimoku cloud , conversion line, base line.
13: Confirmation of general trend: Vortex indicator.
14: Evaluation of price equilibrium: Ichimoku kinko hyo indicator, price related to ichimoku cloud , conversion line, base line (alternative method).
15: Evaluation of volatility: Choppiness index indicator.
16: Evaluation of volume: Volume indicator.
Re-Entry Trigger List:
1: Confirmation of short term upward trend: Ichimoku kinko hyo indicator, price related to conversion line and base line.
2: Evaluation of short term trend: Ichimoku kinko hyo indicator, conversion line related to base line.
3: Confirmation of the longer term upward trend: Ichimoku kinko hyo indicator, conversion line and base line related to the ichimoku cloud .
4: Confirmation of sufficient momentum: Macd indicator.
5: Confirmation of sufficient momentum: Macd indicator (alternative method).
6: Evaluation of overbought or oversold conditions in the price: RSI indicator.
7: Confirmation of sufficient momentum: Macd indicator (alternative method).
8: Confirmation of general trend: Vortex indicator.
9: Confirmation of the longer term upward trend: Ichimoku kinko hyo indicator, price related to the ichimoku cloud .
10: Evaluation of bullish/bearish territory.
Exit Trigger List:
1: Confirmation of short term trend reversal: Ichimoku kinko hyo indicator, conversion line related to base line.
2: Confirmation of neutral territory: Ichimoku kinko hyo indicator, price related to the ichimoku cloud .
3: Confirmation of bearish territory: Ichimoku kinko hyo indicator, price related to the ichimoku cloud .
4: Evaluation of extremely overbought conditions in the price: RSI indicator.
5: Confirmation of bearish divergence signals.
-------------------------------------------------------------------------------
Reminder: Use this trading strategy at your own risk and trade responsibly. We are not responsible for any financial loss using this strategy.
***The script is invite-only, message us to get script access***

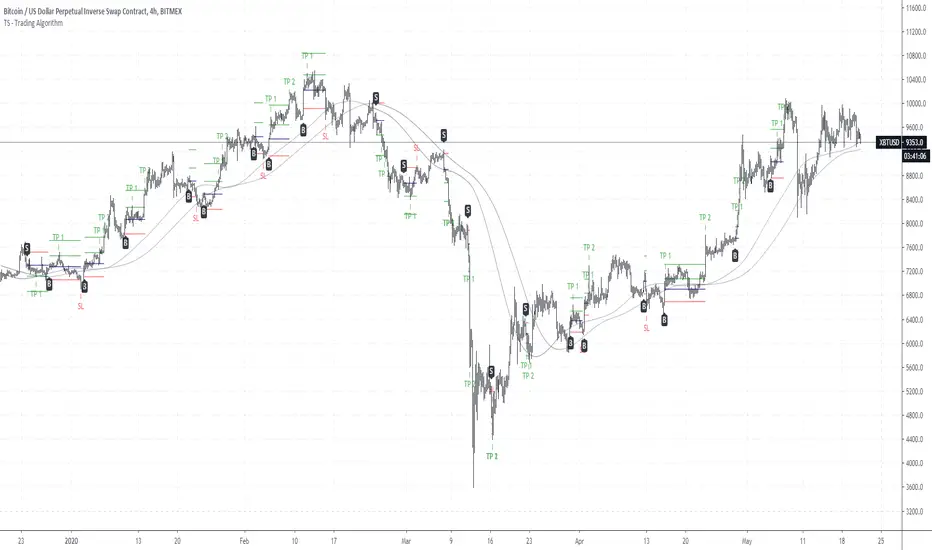
TS - Trading Algorithm Strategy - Crypto, Forex & StocksWhat does the TS - Algorithm do?
-- Plots trend following, high probability signals.
-- These signals do not repaint and can be used confidently to enter or exit a trade.
What markets can this indicator be used on?
-- Forex
-- Stocks
-- Commodities
-- Cryptocurrencies
What time-frames can this indicator be used on?
-- This indicator can be used on 1m, 3m , 5m, 10m, 15m, 30m, 1hr, 2hr, 3hr, 4hr, 6hr, 8hr, 12hr, Daily, Weekly, Bi-Weekly and Monthly time-frames.
-- This is a trend following algorithm, so low as there is good volume , volatility and price history of an asset, the model can perform.
Does this indicator repaint?
-- No
Premium Tradespot Script - Trial access and Information
-- Trial access offered
-- PM me directly to request trial access to the scripts or for more information.

TS - Trading Algorithm - Crypto, Forex & StocksWhat does the TS - Algorithm do?
-- Plots trend following, high probability signals.
-- These signals do not repaint and can be used confidently to enter or exit a trade.
What markets can this indicator be used on?
-- Forex
-- Stocks
-- Commodities
-- Cryptocurrencies
What time-frames can this indicator be used on?
-- This indicator can be used on 1m, 3m , 5m, 10m, 15m, 30m, 1hr, 2hr, 3hr, 4hr, 6hr, 8hr, 12hr, Daily, Weekly, Bi-Weekly and Monthly time-frames.
-- This is a trend following algorithm, so low as there is good volume , volatility and price history of an asset, the model can perform.
Does this indicator repaint?
-- No
Premium Tradespot Script - Trial access and Information
-- Trial access offered
-- PM me directly to request trial access to the scripts or for more information.
Chonky Initial Balance (crypto)Plots the Initial Balance for crypto assets.
I use it for XBTUSD specifically.
The Initial Balance range is an area watched by Market/Volume Profile traders.
The idea behind it is that participants will start the day with a premeditated bias towards the market, and this is the first glimpse into how the rest of the day may unfold.
Access: DM me and I will consider granting access

BEST Algorithm Builder CRYPTOHello traders 👋
I. 💎 SCRIPTS ACCESS AND TRIALS 💎
1. Every trial request access has to be done through my website.
2. My website URL is in this script signature at the very bottom (you'll have to scroll down a bit and going past the long description) and in my profile status available here: Daveatt
3. Many video tutorials explaining clearly how all our indicators work are available on your website > guides section and on our Discord forum.
4. You can also contact me directly for more information regarding the trading method included in the indicator or how to access it
II. Forewords
Algorithm trading has THE ambitious goal to reduce the number of decisions we have to make when trading.
It's so much easier to get a signal whenever all indicators are converging rather than monitoring each one individually.
Even better when that convergence has been found by experienced quant traders - so that our subscribers only worry about managing their trades according to our trading method.
We don't only provide scripts. They're based on our trading method we've built over years across many asset classes (including cryptocurrencies)
Feel free to check us out for more information (links in my profile or signature below)
This indicator is for the Intraday CRYPTO traders looking for fixed entries based on a trading method designed by 2 experienced traders.
It's a variation of our Algorithm Builder with a custom method for intraday trading - can be coupled with the UNIVERSAL Algo Builder also for swing positions.
We designed this framework for CRYPTO/USD and CRYPTO/CRYPTO pairing (ex: LTC/BTC, XRP/ETH, ...)
Made for crypto with enough trading volume (big and mid-caps)
ETH/BTC
XRP/ETH
EOS/USD
It includes :
- our proprietary method with fixed entries
- a hard exit system (built-in stop-loss)
- 🔔 Compatible with dynamic alerts 🔔
Dynamic alerts are bringing automated trading to a whole new level. The third-party solutions capturing TradingView alerts are able to use them.
- (optional) we let the users decide to use or not our built-in Trade Manager.
Regardless of the Trade Manager is used or not, one must mandatory exit, once a vertical hard exit bar appears.
- the Algorithmic Supports and Resistances used as safeguards and take profit zones.
Final words
We made it as simple as we could (to be honest it's a very simple system for the end-user) - even with several hundreds of calculations in the indicator.
Please hit me up for any questions/feedback/comments
Become the BEST trader that you deserve to be
Dave
[astropark] Crypto Swing Trading [alarms]Dear Followers,
today a Swing Trading Strategy , runnable on a bot , which works great from 30m timeframe and above. Best suggested timeframes are 1h and 4h.
If you are a scalper, you will love suggested entries for fast profit. You can run it from 1 minute timeframe if you are used to scalp trading and close each trade whenever you fell happy (a proper trailing stop strategy is suggested anyway).
This indicator can trigger till 5 or 20 buy or sell signals in a row before reverting (it changes greatly depending on timeframe you use), so use a proper money management .
This script will let you set alarms whenever a Buy or a Sell signal is drawn on chart. This way you can set all notifications you may need in order to be alerted on each triggered signal.
The backtesting-strategy version of this script can be found here below or by searching for "Crypto Swing Trading" and then choosing the "strategy" version.
Strategy results are calculated on the timeframe from January 2018 to now, so on about 2 years, using 10000$ as initial capital and working at 3x leverage (very safe leverage!).
This is not the "Holy Grail", so use a proper risk management strategy.
This is a premium indicator , so send me a private message in order to get access to this script.

[astropark] Crypto Swing Trading [strategy]Dear Followers,
today a Swing Trading Strategy , runnable on a bot , which works great from 30m timeframe and above. Best suggested timeframes are 1h and 4h.
If you are a scalper, you will love suggested entries for fast profit. You can run it from 1 minute timeframe if you are used to scalp trading and close each trade whenever you fell happy (a proper trailing stop strategy is suggested anyway).
This strategy can trigger till 5 or 20 buy or sell signals in a row before reverting (it changes greatly depending on timeframe you use), so use a proper money management .
Strategy results are calculated on the timeframe from January 2018 to now, so on about 2 years, using 10000$ as initial capital and working at 3x leverage (very safe leverage!).
This is not the "Holy Grail", so use a proper risk management strategy.
This script will let you backtest this script.
The alarms version of this indicator, which will let you set all notifications you may need in order to be alerted on each triggered signals, can be found by searching for "Crypto Swing Trading" and then choosing the "alarms" version.
This is a premium indicator , so send me a private message in order to get access to this script.

Full Range Trading Strategy with DCA - Crypto, Forex, Stocks
Introduction
This is a Pine 4 range trading strategy. It has a twin study with several alerts. The design intent is to produce a commercial grade signal generator that can be adapted to any symbol and interval. Ideally, the script is reliable enough to be the basis of an automated trading system web-hooked to a server with API access to crypto, forex and stock brokerages. The strategy can be run in three different modes: long, short and bidirectional.
As a range trading strategy, the behavior of the script is to buy on weakness and sell on strength. As such trade orders are placed in a counter direction to price pressure. What you will see on the chart is a short position on peaks and a long position on valleys. Just to be clear, the range as well as trends are merely illusions as the chart only receives prices. However, this script attempts to calculate pivot points from the price stream. Rising pivots are shorts and falling pivots are longs. I refer to pivots as a vertex in this script which adds structural components to the chart formation. When trading in “Ping Pong” mode long and short positions are intermingled continuously as long as there exists a detectable vertex. Unfortunately, this can work against your backtest profitability on long duration trends where prices continue in a single direction without pullback. I have designed various features in the script to compensate for this event. A well configured script should perform in a range bound market and minimize losses in a trend. I also have a trend following version of this script for those not interested in trading the range. Please be aware these are two types of traders. You should know who you are.
This script employs a DCA feature which enables users to experiment with loss recovery techniques. This is an advanced feature which can increase the order size on new trades in response to stopped out or winning streak trades. The script keeps track of debt incurred from losing trades. When the debt is recovered the order size returns to the base amount specified in the TV properties tab. The inputs for this feature include a limiter to prevent your account from depleting capital during runaway markets. This implementation of DCA does not use pyramid levels. Only the order size on subsequent new trades are affected. Pyramids on the other hand increase the size of open positions. If you are interested in seeing pyramids in action please see the trend version of this script which features both DCA and pyramids. While DCA is a popular feature in crypto trading, it can make you a “bag” holder if your not careful. In other markets, especially margin trading, you’ll need a well funded account and much trading experience to manage this feature safely.
Consecutive loss limit can be set to report a breach of the threshold value. Every stop hit beyond this limit will be reported on a version 4 label above the bar where the stop is hit. Use the location of the labels along with the summary report tally to improve the adaptability of system. Don’t simply fit the chart. A good trading system should adapt to ever changing market conditions. On the study version the consecutive loss limit can be used to halt live trading on the broker side (managed manually).
Design
This script uses twelve indicators on a single time frame. The original trading algorithms are a port from a much larger program on another trading platform. I’ve converted some of the statistical functions to use standard indicators available on TradingView. The setups make heavy use of the Hull Moving Average in conjunction with EMAs that form the Bill Williams Alligator as described in his book “New Trading Dimensions” Chapter 3. Lag between the Hull and the EMAs form the basis of the entry and exit points. The vertices are calculated using one of five featured indicators. Each indicator is actually a composite of calculations which produce a distinct mean. This mathematical distinction enables the script to be useful on various instruments which belong to entirely different markets. In other words, at least one of these indicators should be able generate pivots on an arbitrarily selected instrument. Try each one to find the best fit.
The entire script is around 1800 lines of Pine code which is the maximum incidental size given the TradingView limits: local scopes, run-time duration and compile time. I’ve been working on this script for nearly two years and have tested it on various instruments stocks, forex and crypto. It performs well on higher liquidity markets that have at least a year of historical data. Although the script can be implemented on any interval, it has been optimized for small time frames down to 5 minutes. The 10 minute BTC/USD produces around 500 trades in 2 ½ months. The 1 hour BTC/USD produces around 1300 trades in 1 ½ years. Originally, this script contained both range trading and trend following logic but had to be broken into separate scripts due to the aforementioned limitations.
Inputs to the script use cone centric measurements in effort to avoid exposing adjustments to the various internal indicators. The goal was to keep the inputs relevant to the actual trade entry and exit locations as opposed to a series of MA input values and the like. As a result the strategy exposes over 50 inputs grouped into long or short sections. Inputs are available for the usual minimum profit and stop-loss as well as safeguards, trade frequency, DCA, modes, presets, reports and lots of calibrations. The inputs are numerous, I’m aware. Unfortunately, at this time, TradingView does not offer any other method to get data in the script. The usual initialization files such as cnf, cfg, ini, json and xml files are currently unsupported.
Example configurations for various instruments along with a detailed PDF user manual is available.
Indicator Repainting And Anomalies
Indicator repainting is an industry wide problem which mainly occurs when you mix backtest data with real-time data. It doesn't matter which platform you use some form of this condition will manifest itself on your chart over time. The critical aspect being whether live trades on your broker’s account continue to match your TradingView study.
Tackling this repainting issue has been a major project goal of this script. Based on my experience with Pine, most of the problems stem from TradingView’s implementation of multiple interval access. Whereas most platform provide a separate bar series for each interval requested, the Pine language interleaves higher time frames with the primary chart interval. The problem is exacerbated by allowing a look-ahead parameter to the Security function. The goal of my repaint prevention is simply to ensure that my signal trading bias remains consistent between the strategy, study and broker. That being said this is what I’ve done address this issue in this script:
1. This script uses only 1 time frame. The chart interval.
2. Every entry and exit condition is evaluated on closed bars only.
3. No security functions are called to avoid a look-ahead possibility.
4. Every contributing factor specified in the TradingView wiki regarding this issue has been addressed.
5. I’ve run a 10 minute chart live for a week and compared it to the same chart periodically reloaded. The two charts were highly correlated with no instances of completely opposite real-time signals.
The study does indeed bring up the TV warning dialog. The only reason for this is because the script uses an EMA indicator which according to TradingView is due to “peculiarities of the algorithm”.
One issue that comes up when comparing the strategy with the study is that the strategy trades show on the chart one bar later than the study. This problem is due to the fact that “strategy.entry()” and “strategy_exit()” do not execute on the same bar called. The study, on the other hand, has no such limitation since there are no position routines.
Please be aware that the data source matters. Cryptocurrency has no central tick repository so each exchange supplies TradingView its feed. Even though it is the same symbol the quality of the data and subsequently the bars that are supplied to the chart varies with the exchange. This script will absolutely produce different results on different data feeds of the same symbol. Be sure to backtest this script on the same data you intend to receive alerts for. Any example settings I share with you will always have the exchange name used to generate the test results.
Usage
The following steps provide a very brief set of instructions that will get you started but will most certainly not produce the best backtest. A trading system that you are willing to risk your hard earned capital will require a well crafted configuration that involves time, expertise and clearly defined goals. As previously mentioned, I have several example configs that I use for my own trading that I can share with you along with a PDF which describes each input in detail. To get hands on experience in setting up your own symbol from scratch please follow the steps below.
The input dialog box contains over 50 inputs separated into five sections. Each section is identified as such with a makeshift separator input. There are three main areas that must to be configured: long side, short side and settings that apply to both. The rest of the inputs apply to DCA, reporting and calibrations. The following steps address these three main areas only. You will need to get your backtest in the black before moving on to the more advanced features.
Step 1. Setup the Base currency and order size in the properties tab.
Step 2. Select the calculation presets in the Instrument Type field.
Step 3. Select “No Trade” in the Trading Mode field.
Step 4. Select the Histogram indicator from Section 2. You will be experimenting with different ones so it doesn’t matter which one you try first.
Step 5. Turn on Show Markers in Section 2.
Step 6. Go to the chart and checkout where the markers show up. Blue is up and red is down. Long trades show up along the red markers and short trades on the blue.
Step 7. Make adjustments to “Base To Vertex” and “Vertex To Base” net change and roc in Section 3. Use these fields to move the markers to where you want trades to be.
Step 8. Try a different indicator from Section 2 and repeat Step 7 until you find the best match for this instrument on this interval. This step is complete when the Vertex settings and indicator combination produce the most favorable results.
Step 9. Go to Section 3 and enable “Apply Red Base To Base Margin”.
Step 10. Go to Section 4 and enable “Apply Blue Base To Base Margin”.
Step 11. Go to Section 2 and adjust “Minimum Base To Base Blue” and “Minimum Base To Base Red”. Observe the chart and note where the markers move relative to each other. Markers further apart will produce less trades but will reduce cutoffs in “Ping Pong” mode.
Step 12. Return to Section 3 and 4 and turn off “Base To Base Margin” which was enabled in steps 9 and 10.
Step 13. Turn off Show Markers in Section 2.
Step 14. Put in your Minimum Profit and Stop Loss in the first section. This is in pips or currency basis points (chart right side scale). Percentage is not currently supported. This is a fixed value minimum profit and stop loss. Also note that the profit is taken as a conditional exit on a market order not a fixed limit. The actual profit taken will almost always be greater than the amount specified. The stop loss, on the other hand, is indeed a hard number which is executed by the TradingView broker simulator when the threshold is breached. On the study version, the stop is executed at the close of the bar.
Step 15. Return to step 3 and select a Trading Mode (Long, Short, BiDir, Ping Pong). If you are planning to trade bidirectionally its best to configure long first then short. Combine them with “BiDir” or “Ping Pong” after setting up both sides of the trade individually. The difference between “BiDir” and “Ping Pong” is that “Ping Pong” uses position reversal and can cut off opposing trades less than the specified minimum profit. As a result “Ping Pong” mode produces the greatest number of trades.
Step 16. Take a look at the chart. Trades should be showing along the markers plotted earlier.
Step 17. Make adjustments to the Vertex fields in Section 2 until the TradingView performance report is showing a profit. This includes the “Minimum Base To Base” fields. If a profit cannot be achieved move on to Step 18.
Step 18. Improve the backtest profitability by adjusting the “Long Entry Net Change” and “Long Entry ROC” in Section 3.
Step 19. Improve the backtest profitability by adjusting the “Short Entry Net Change” and “Short Entry ROC” in Section 4.
Step 20. Improve the backtest profitability by adjusting the “Sparse Long Delta” in Section 3.
Step 21. Improve the backtest profitability by adjusting the “Chase Long Delta” in Section 3.
Step 22. Improve the backtest profitability by adjusting the “Long Adherence Delta” in Section 3. This field requires the “Adhere to Rising Trend” checkbox to be enabled.
Step 23. Try each checkbox in Section 3 and see if it improves the backtest profitability. The “Caution Lackluster Longs” checkbox only works when “Long Caution Mode” is enabled.
Step 24. Improve the backtest profitability by adjusting the “Sparse Short Delta” in Section 4.
Step 25. Improve the backtest profitability by adjusting the “Chase Short Delta” in Section 4.
Step 26. Improve the backtest profitability by adjusting the “Short Adherence Delta” in Section 4. This field requires the “Adhere to Falling Trend” checkbox to be enabled.
Step 27. Try each checkbox in Section 4 and see if it improves the backtest profitability. The “Caution Lackluster Shorts” checkbox only works when “Short Caution Mode” is enabled.
Step 28. Enable the reporting conditions in Section 5. Look for long runs of consecutive losses or high debt sequences. These are indications that your trading system cannot withstand sudden changes in market sentiment.
Step 29. Examine the chart and see that trades are being placed in accordance with your desired trading goals. This is an important step. If your desired model requires multiple trades per day then you should be seeing hundreds of trades on the chart. Alternatively, you may be looking to trade fewer steep peaks and deep valleys in which case you should see trades at major turning points. Don’t simply settle for what the backtest serves you. Work your configuration until the system aligns with your desired model. Try changing indicators and even intervals if you cannot reach your simulation goals. Generally speaking, the histogram and Candle indicators produce the most trades. The Macro indicator captures the tallest peaks and valleys.
Step 30. Apply the backtest settings to the study version and perform forward testing.
This script is open for beta testing. After successful beta test it will become a commercial application available by subscription only. I’ve invested quite a lot of time and effort into making this the best possible signal generator for all of the instruments I intend to trade. I certainly welcome any suggestions for improvements. Thank you all in advance.

CS Trading Bot Study - Crypto EditionWhat is this Study about?
The CS Trading Bot Study is for getting Open Long (Buy) and Close Long signals (Sell) that you can use to get alerts in various ways (Webhooks, Emails, etc).
The Study is very profitable for a vast amount of Crypto assets and the algorithm behind is not overfitted.
How to use it?
Make sure to start your research and find your favorite Crypto assets using the corresponding strategy:
The research process is very important as you can see beforehand how well the alerts for this Study would perform.
Make sure to read the Strategy's description, as well!
After you found your Crypto assets of interest using the corresponding Strategy...
Open a new chart for each asset and add the Study from your favorite indicators.
Click on the alert symbol on your chart and from "Condition" choose the "CS Bot" Strategy.
Then below choose "CS Bot Buy Alert" and "CS Bot Sell Alert" (each separate alerts).
Under "options" check "Once per bar" (very important) .
Pick your desired way of getting the alerts (app, popup, email, webhook).
The webhooks for setting alerts are very interesting as you can forward your signals to your own trading bot or simply wait until my trading bot is available (currently in development)
Since I develop myself, rest assured it will be available soon. Look out for comments below as soon as it is available!
How to access?
If you are interested to get access to the complete package, please don't hesitate to send me a private message for a quote.
The amount of concurrent users using the package (=licenses) is limited to max. 500 a month (more we cannot manually handle has Tradingview has no automation for this yet).
Access to the bot package is based on a monthly basis. If you get access, you will asked in person at the end of the month if you want to continue or not.
The monthly fee depends on the demand, but for as long as you continue using the package your initial price stays the same!

CS Trading Bot Strategy - Crypto EditionWhat is this strategy about?
The CS Trading Bot Strategy is for researching the most lucrative Crypto assets to be selected for in the corresponding Study (that actually generates alerts/signals).
The Strategy is very profitable for a vast amount of Crypto assets and the algorithm behind is not overfitted.
How to use it?
As a rule of thumb, the best time-frames are the 4h, 3h, 2h and 1h (sometimes 30M and 45M).
For many high profile/volume assets such as BTC, ETH and XRP the Daily is very profitable, as well. Weekly and Monthly time-frames should be avoided.
It is not recommended to apply this strategy to new assets with only a few weeks of history. I recommend a history of at least 6 months and 5 trades in the Strategy stats.
In the Strategy settings, you can adjust the time-span to see how the Strategy performs in certain conditions like bear-markets (see for example 4H on BTCUSDT from Jan 2018 - March 2019).
What to look for on researching?
If you are researching, make sure to look for these metrics in the Strategy overview:
Linear equity growth (especially over a larger period of time)
Low drawdown
Profitability above 50%
Average gain per trade of 5%
A satisfying profit for your selected time-span
Min. 5 trades, better 10
Min. 6 Months time-span
As a head-start, I suggest to research on the following assets, so you get a feeling about what to look for based on the list above:
POLONIEX:BTCUSDT
POLONIEX:ETHUSDT
POLONIEX:XRPUSDT
Why Poloniex? Because it has a long history for these assets...
Once you determined your favorite assets, you are ready to add the corresponding Study and within, set alerts for them.
Here the Webhooks are very interesting as you can forward your signals to your own trading bot or simply wait until my trading bot is available (currently in development)
Since I develop myself, rest assured it will be available soon. Look out for comments below as soon as it is available!
The bot is a commercial package including:
This Strategy for finding the best assets
The Study for setting alerts based on the best assets (webhooks, emails, popups, etc)
Access to our automated trading bot (separate download, as soon as available)
How to access?
If you are interested to get access to the complete package, please don't hesitate to send me a private message for a quote.
The amount of concurrent users using the package (=licenses) is limited to max. 500 a month (more we cannot manually handle has Tradingview has no automation for this yet).
Access to the bot package is based on a monthly basis. If you get access, you will asked in person at the end of the month if you want to continue or not.

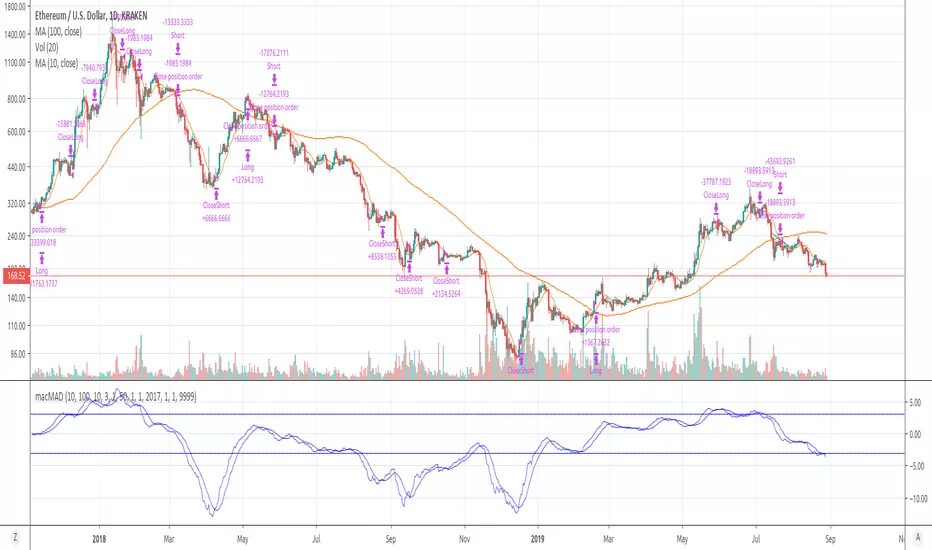
[macMAD] Free crypto strategy that just works How to actually make money on crypto?
Not complicating your strategy (it causes overfitting)
Trade long term (price movement behaves less random on larger scales)
Contact me and I'll help you automate this strategy!
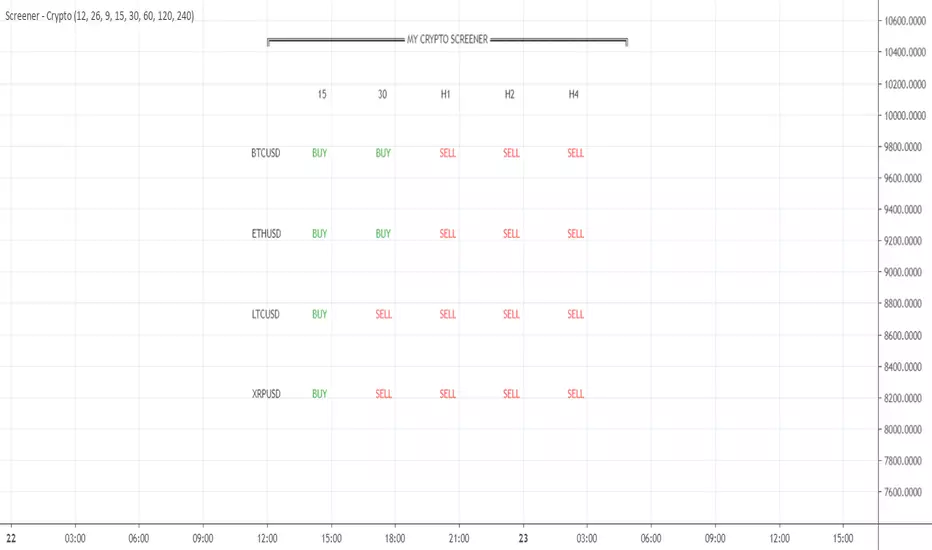
Your CRYPTO Screener - MACD 0 LAG editionHello traders
What's good?
1 - Quick introduction
This script is to demonstrate a proof-of-concept - showing you again what you thought wasn't possible might become (with some tricks) in the realm of possibles !!!.
I get requests for people who want a custom screener because the native TradingView Stocks/Forex/Crypto screeners don't allow to plug external indicators. (example: www.tradingview.com
This is entirely true and I have also good news for you, we can hack the system one more time. As Hackerman would say, "IT"S HACKING TIME !!!" (ref : KUNG FURY . (#geek #reference #done #for #today)
What if you could build your own personalized screener based on your custom indicator? "No Dave stop smoking, that's not possible, go back to eating your baguette". Say no more, let me present you my new script called YOUR CRYPTO Screener (MACD 0 LAG)
2 - What is a MACD ZERO LAG?
We'll all agree this indicator is NOT in the TradingView screeners so I'm not cheating here :)
A MACD ZERO LAG is a MACD that .... suspens.... wait for it.... DOES NOT lag.
The traditional MACD is based on exponential moving averages and as moving averages are lagging, then the MACD is lagging also. I'll spare you all the maths behind the MACD ZERO LAG but in short, this is a way more reactive indicator than the traditional MACD
I shared before the version that I personally use for my own trading : MACD 0 LAG nTREND coloring
3 - Crypto Screener specifications
If I could do a screener as complete as the native one, this would be wonderful but ... we cannot and this is due to technical reasons. To call indicators from different timeframes, I have to use the security function. And we're limited to 40 security calls per indicator.
That explains why I selected 4 crypto assets and 5 timeframes and the MACD zero lag output for each asset/timeframe - which gives a total of 4 * 5 * 2 = 40
You'll be able to select from the interface the 5 timeframes that you want for your screener
In this script, you'll get a :
- BUY whenever the MACD ZERO LAG for your asset/timeframe is green.
- SELL whenever the MACD ZERO LAG for your asset/timeframe is red.
4 - Can you hack it even more?
If you want to add other timeframes or assets, you can either, change the code or add the indicator on another chart.
I made the source code generic enough so that you can update it yourself easily
Example:
Chart 1 will list BTCUSD, ETHUSD, LTCUSD, and XRPUSD in m5/m15/m30/H1/H4 and Chart2 could list BTCUSD, ETHUSD, LTCUSD and XRPUSD in H6/H8/H12/Daily, etc...
Once again the sky (and your computer RAM capacity) is the limit
5 - Can you super hack it even more?
1/ This script is only a proof-of-concept that you can build your own custom screener. Imagine having the Algorithm Builder and being able to connect it in a single click to a custom screener using your own configuration :)
How coooooooooooooooool would that be!!!
This screener version will be available on my website in a few weeks along with all the tools I'm spamming you about since the beginning of July (#shameless #self-advertising)
2/ For a nicer scripter, let's keep in mind that TradingView just enabled Webhooks this week. This will allow my company to offer custom screeners design and hosted on your own website. Those screeners will be for sure nicer than the indicator version
That's it for today and for this week
I won't even touch the laptop this weekend and will enjoy life a bit
Love you all
Dave
____________________________________________________________
Be sure to hit the thumbs up. Building those indicators take a lot of time and likes are always rewarding for me :) (tips are accepted too)
- If you want to suggest some indicators that I can develop and share with the community, please use my personal TRELLO board
- I'm an officially approved PineEditor/LUA/MT4 approved mentor on codementor. You can request a coaching with me if you want and I'll teach you how to build kick-ass indicators and strategies
Jump on a 1 to 1 coaching with me
- You can also hire for a custom dev of your indicator/strategy/bot/chrome extension/python
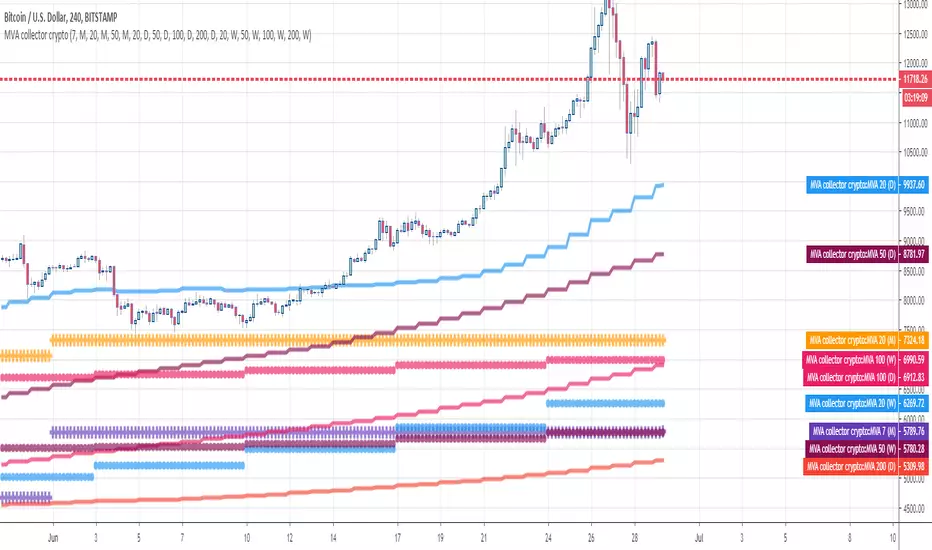
MVA collector cryptoHello Traders
This indicator draw multiple Simple Moving Averages multi-timeframes at once
I use it to define take profit zones for my crypto trading
Hope you'll like it
Enjoy
Dave
Gravity Swing Oscillator V1 - optimized for CryptoGravity Swing Oscillator V1 - optimized for Crypto
- Top & Bottoms
- Buy / Sell Signals on colorchanging LED Dots
- can show danger Price Dop Zones on Bars