Strategy Myth-Busting #10 - InsideBar+EMA - [MYN]This is part of a new series we are calling "Strategy Myth-Busting" where we take open public manual trading strategies and automate them. The goal is to not only validate the authenticity of the claims but to provide an automated version for traders who wish to trade autonomously.
Our 10th one we are automating is the " 75% Win Rate High Profit Inside Bar Trading Strategy - What If You ... " strategy from " Trade Pro " who claims to have backtested this manually and achieved 11,063% profit with a 75% winrate over 100 trades. I was unable to emulate these results consistently accommodating for slippage and commission but even so, the results look promising. I was only able to achieve this win-rate with some multiple take profit staggering. Even so the markdown is above where I would normally consider comfortable (>20%).
If you know of or have a strategy you want to see myth-busted or just have an idea for one, please feel free to message me.
This strategy uses a combination of 2 open-source public indicators:
Inside Bar Ind/Alert by CMA
EMA (built-in)
Trading Rules
4 hour candles
Stop Loss at EMA Line with TP Target 1.5x the risk
Long Entry when these conditions are true
inside bar and bullish
Bar close's above 50 ema
Price action rises above high of inside bar .
Short Entry when these conditions are true
inside bar and bearish
Bar close below 50 ema
Price action falls below low of inside bar
In den Scripts nach "bar" suchen

No Supply/Demand barsThe VSA (Volume Spread Analysis) definition for No Demand and No supply is as follows:
No Demand (no buyers-potential short position):
The Volume within the candle formation again has to be lower than the volume of the previous 2 candles.
The candle has to close bullish (green body) and the next candle has to close bearish.
There has to be some sort of rejection (pin or wick) at the high of the candle.
If the candle closed at the top it would not be a no demand candle.
No Supply (no sellers-potential long position):
The Volume within the candle formation has to be lower than the volume of the previous 2 candles.
The candle has to close bearish (red body) and the next candle has to close bullish.
There has to be some sort of rejection (pin or wick) at the low of the candle.
If the candle closed at the bottom it would not be a no supply candle.
Simple indicator, to show No Supply bars and No Demand bars:
No Supply bars = No S in green color
Do Demand bars = No D in red color
If No Supply/Demand bars is Outside bars, it will shown as No S/D Outside with the same color. In special case, if it's a Engufling pairs, it's will shown as Engul Up/Down with the same color.
You can chose option Filter volumes to confirm the second bar's volume higher prev bar's volume

Fancy Bars v.02.07Hello Lads,
this is the mandatory description to not get this indicator banned by tradingview. :-)
So what you can basically see are different types of colored candles and some weird signs below and above the candles.
In this picture you can see all features that the indicator is providing at the moment of the relase. More to come soon anon.
As first we got different color settings for different candles.
There are two different types of color candles.
Casual Extensions of the source you have chosen in the settings are either green or red by default.
If the market extends a little more, the bars are being colored either blue or purple.
These candles work well to identifiy local exhaustion points after a rallye to the up or the down side. But you can also take them as an entry.
For Example:
A green or blue extension appears after a significant drop in price. Candles like these are usually a first sign of a local bottom to form or a bounce to appear.
In order to view green and blue bars at the opposite, you can take them as an exit for your long after a rally, because the market tends to be exhausted afterwards.
It works the same way for the red and purple bars as you can see here. I hope the screenshot can make that clear aswell. :-)
So on the screenshots you can see aswell many different signs below and above the candles.
Candles with an "F" below or above the candle are showing you that the Fisher Transform indicator has made a turnover.
So this basically means that if there is a green "F" below a bar the value of the Fischer Oscillator is smaller then - 3 and the fast line is crossing the slow line, which is bullish.
If you see a "F" above a candle, this means that the slow line is crossing the fast line and the value of the fisher transform is greater then 3.
If you see an "H" above or below the candle this means that the Indicator "Hull Suite by InSilico" is turning over.
If the "H" is red and above the candle it´s a bearish sign, if it´s green and below the candle, it is a bullish sign.
Well as next we have these white colored "X" appearing form time to time.
Well X stands basically for EXIT.
We have calculated the difference from the current price to a selectable EMA / MA and if the percentage difference in market is bigger then the selected value in the menu, the market will simply print an "X" where you can exit your long or short position.
We recommand to use this function, espacially as all other functions aswell, only for scalping purposes, to catch a possible reversion of the price.
Here you can see the menu at it´s full beauty. You can select every mode and adjust your settings for your personal preferences.
gyazo.com
gyazo.com
You can even chose different modes for the extension bars, which are currently being tested. If you got some feedback, please let us know!
The "Vanilla" mode of the extension bars takes the volume from the current chart that you are looking at. So this mode basically works for all in TradingView existing markets where chart provides you volume.
The second mode aggregates Spot and Perpetual Volume from the biggest exchanges. We recommand to use this and the other modes (except vanilla ofc) only for BTC and ETH.
Furthermore we took the provided Open Interest from Binance to calculate the bars. It is as all the other things aswell highly experimental and hasn´t been tested a lot yet.
Last but not least, we calculated from the given Open Interest by Binance a CVD for BTC and ETH, which expansions are also being plotted as the previous explained candles.
gyazo.com
You can also change the length and the type of the AVG that is being calculated for the bar coloring. As well as for the Exit Bars and the Hull Suite.
gyazo.com
gyazo.com
gyazo.com
For this Project we have used Public Source Code by @InSilico for the HullSuite and ressources by Tradingview for the Fisher Turnover feature.

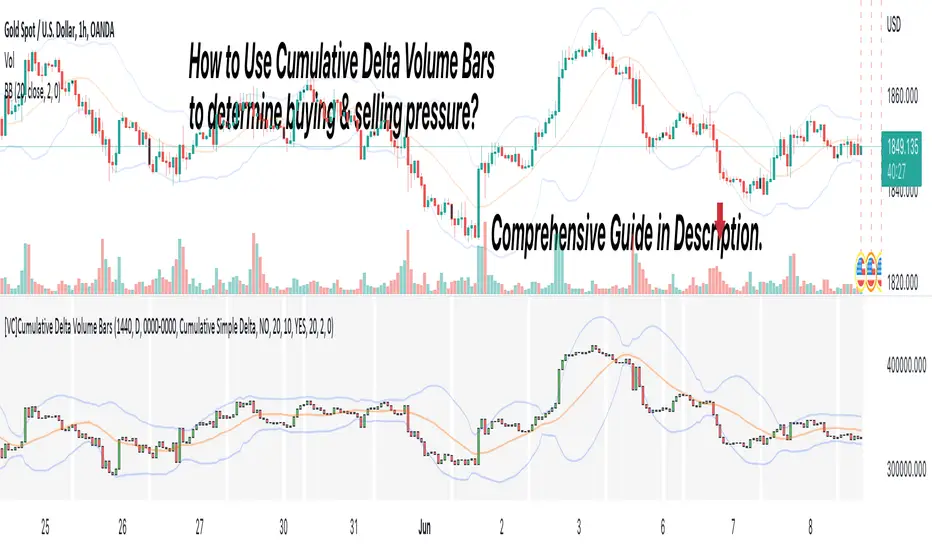
[VC] Cumulative Delta Volume BarsLet's first learn what is Delta & How to Use Cumulative Delta Volume Bars?
Cumulative Delta Volume Bars is one of the leading indicators that you can use when trading order flow. It gives you an instant snapshot of the buying and selling pressure in a market.
After reading the detailed description of "Cumulative Delta Volume Bars," you will understand how volume delta provides a critical edge by allowing you to spot significant potential reversals in the market. You will also learn to use this Cumulative Delta indicator in depth. (including rest session usability features)
What is Delta Volume?
Delta Volume is the difference between Buying and Selling Power. Delta Volume is calculated by taking the difference between the volume traded at the offer price and the volume traded at the bid price. (in simple words, the difference between buying pressure & selling pressure)
If delta volume is more than zero, you have more buying pressure than selling & vice versa, and if delta volume is less than zero, you have more selling pressure than buying.
In Order-Flow Analysis , traders used Cumulative Delta to measure the relationship between the Buying & Selling pressure Vs Price.
Cumulative delta volume takes the delta values for every bar and successively adds them together to provide a graph, as seen below visually.
Let me demonstrate by giving examples of how cumulative Delta can help measure the buying or selling pressure relative to the price move.
★ Trading Absorption & Exhaustion concepts with Delta
See the chart below & try to analyze the next possible move on the basses on the analysis mentioned on the chart.
➽➽ If you said Short, you were correct. ✅
Till Point A , both price & cumulative were aligned. (means there were no imbalances between Delta & Price).
But on Point B , the Cumulative Delta broke the previous resistance clearly and moved even further away from the resistance level, but the Price couldn't break the last resistance. It interprets that buyers applied a lot of buying pressure but no result. (Aggressive buying pressure absorbed by Passive sellers)
Due to this vast effort or failed attempt, buyers were exhausted and had no more strength to pull the Price up. That's why the Price reversed from Point B . See below image
★ Cumulative Delta Volume Bars is helpful when determining buying or selling pressure at different key price levels, such as swing highs or lows.
Let's recap on swing highs and swing lows.
➽ A swing high (S.H) is formed when the high reaches higher than the price action around it. Once the Price moves above a prior swing high and begins to retrace, a new swing high is formed.
➽ A swing low (S.L) is formed when the low reaches lower than price action around it. Once the Price moves below a prior swing low and begins to retrace, a new swing low is formed.
➽ When the Price makes higher highs and higher lows, a market is considered an uptrend.
➽ When the Price is making lower lows followed by lower highs, a market is considered a downtrend.
When evaluating Delta, it's beneficial to compare delta values at swing lows or swing highs to determine the amount of selling or buying pressure and how the market reacts.
The actual Power of Delta is revealed when we use it to determine the market's reaction to powerful buying or selling. We want to see if the market has reacted as we would expect or not.
In the above Example, you will notice that every time price breaks a swing, Delta does as well.
It makes sense as it takes selling pressure to break a swing low or buying pressure to break a swing high. In simple words, we can say that there is no anomaly between delta direction & price direction.
In simple words (No Absorption or Exhaustion)
But what's occurring when this isn't the case, and we have divergence between Price and Delta? Let's analyze it with real examples.
★ Understanding Delta Divergence.
(Lack of Harmony in Buying/Selling Pressure & Price Move)
Notice how the Price breaks out of the previous resistance level on the above chart, but the Delta didn't yet reach even close to its last resistance level. It's a clear divergence between Price and Delta. Buyers may be slightly exhausted at the previous resistance level, and Price & Delta may retrace slightly. But in a broader view, it reflects a strong bullish signal.
See the above chart & see when and why the Price moved. I hope it will help you understand the underlying relation & story between Price & Delta.
Cumulative Delta & Trade Management
Delta will help you spot significant reversals, but it can also be used to help manage your open trade. You want to see a high correlation between Delta and Price when in a long or short position.
Suppose you're short while the Price is breaking a new low. You want to see Delta breaking low if sellers aren't interested in selling at the recent lows, represented by Delta not breaking lows. The probability of a short term reversal or a significant retrace increases.
When in a position, always be on the lookout for exhaustion and absorption, signalling a reversal potential.
What Includes in V.C Cumulative Delta Volume Bars Indicator
Inputs & Settings
Reset accumulation on new session:
Allows you to rest accumulation at the start of each session (you may choose your customized starting & ending time as well by enabling ''Customize Rest Session Time''
Start/End of Session & During Session:
Allows you to show/hide & choose the background color & separator of each session
''Customize Rest Session Time''
When this setting is enabled, your customized given time will be applied, which can be set from the below box. Note: set your time in minutes. For Example, if you want to reset the session after every hour, you need to put 60. If you're going to reset after every 8 hours, you need to put 480. Additionally, your chart time frame must be lower than your customized rest time.
Reset Each Minutes:
Allows you to put your desired rest time in minutes. For Example, for 1 hour 60, for 8 hours 480. (8x60)
Reset Each:
Allows you to choose rest time from the drop-down menu. Note: To apply this setting, don't enable the ''CUSTOMIZE RESET SESSION TIME''.
Select Session:
Allows you to set customized starting & ending times of the session instead of the exchange's default time. For Example, the exchange reset time is 20:00, but if you want 22:00, first, you need to set your chart time as an exchange from the right bottom of the chart, and then you need to put 22:00 22:00 in both fields. Note: Put the same starting & ending time. In simple words, it should not be greater than or less than 24 hours.
Type:
It allows you to select Delta type. (there are two delta types you can choose from, 1st Simple Delta, 2nd Delta % or Volume Weighted Delta)
Candle Colors:
Allows you to change the color of candles.
Envelope Indicator:
Allows you to apply to Envelop Indicator on the delta candle. (all default settings of the Envelop Indicator can be customized as well)
See the below chart with Envelop applied to Delta Candles & Price Candles. (can be used to measure the Delta & Price movement at the micro-level)
Bollinger Bands Indicator:
Allows you to apply to Bollinger Bands Indicator on the delta candle. (all default settings of the Bollinger Bands Indicator can be customized as well)
See the below chart with Bollinger Bands applied to Delta Candles & Price Candles. (can be used to measure the Delta & Price movement at the micro-level)
Start/End of Session on Chart
Allows you to change the first & last candle of the session.
Style Settings:
Allows you to control all the visual settings of delta candles, Envelop & Bollinger bands.
-------------------------------------------------
➽Conclusion:
Cumulative Volume Delta Bars is one of the leading indicators you can include as an order flow trader in your arsenal. It gives you an inside look at buying and selling pressure and how the market reacts.
But Keep in mind, in trading & technical analysis, nothing is 100% certain. No indicator can give you a 100% success rate. There is no holy grail in the financial market. As a trader, with the help of technical & fundamental indicators, our goal is to find an edge over the market. A simple definition of an edge is: Anything that adds a few points to the winning side of an equation builds an edge that lasts a lifetime. A trading edge defines your technical or strategic advantage in the highly competitive market environment. Traders can establish multiple edges by starting with popular strategies and customizing rules to lower the risk of getting trapped with the emotional crowd.
Disclaimer Note:
V.C Cumulative Delta Volume Bars It is purely Volume, Delta, Demand & Supply imbalance and comparative analysis based tool. Before applying this Indicator to your study, you should know about Volume, Delta & Spread, Demand & Supply, and Aggressive & Passive behaviour of buyers/sellers.
Some basic understanding of Sir Richerd Wyckoff's Theory can also be helpful.
RedK Momentum Bars (RedK Mo_Bars)Momentum Bars (Mo_Bars) offers a different way to visualize (relative) momentum - and uses some simple TA concepts to provide a different perspective into how we read momentum changes and incorporate that in our trading.
The idea here (and the script itself) is really super simple, and is (very loosely) inspired by Elder's Impulse System (EIS) - then evolved to leverage some other concepts, and to become less cluttering and "easier to read".
The construction of the Mo_Bars
---------------------------------------------
The base concept utilizes 3 moving average lines :
the first line is a relatively fast MA with a short length - acts as the main price tracking line
the second line is slightly slower than the main line - 2 to 3 bars longer length - and will by default use the open value as source - this works better to identify when the closing price starts to move faster than the open (as in, bars more frequently close higher than they open) - this line acts as the signal line - there's an added setting for an additional delay that utilizes regular WMA smoothing - the delay acts to magnify the relative displacement between the 2 MAs
for both these MA's, i choose to use the RSS MA (Lazy Line) - other MA types can be used, but the reason i used that MA type specifically is that it moves "gracefully" - and 2 Lazy Lines moving together minimizes whipsaws from small price swings - i tested with other MA types and found that the RSS has an advantage there.
the third line is a much slower MA (length 5 to 6 x the fast line) - and acts as a filter or a baseline. When we're above that line, we should favor long positions - we're in bull territory. When we're below that line we favor short positions, and we're in bear territory. Adjust this line as it suits your trading style and time frame.
(I choose to use WMA as the MA type for the filter line .. and there's a good reason for that - which i'll skip for now - but in future versions, we can add other selectable MA types. )
Using Mo_Bars
----------------------------
at a very broad level, we can use Mo_Bars similar to how we use a MACD - both are centered and unrestricted oscillators - note the difference that Mo_Bars is based on 3 MA's rather than 2.
the Mo_Bar bar length reflects the distance between the main MA and the signal MA - plotted relative to the baseline (filter line) - that means that the length of the bar represents the relative momentum between the 2 MA's - The Mo_Bars are then colored in a way that reflects increase or decrease in the value of that momentum (the visual here may have been inspired by another indicator recently published by one of our esteemed wizards - it worked perfectly - so due credits here :)
-- in simple terms, if the main MA is below the signal MA, the bar is red - and when the main MA is above the signal MA, the bar is green - a white bar usually shows up when there's a detected change of relative momentum direction (note that this is not the same as the trend direction - and that's what helps show and exploit convergence and divergence - similar to a MACD)
* in the chart above, i noted few examples of how visualizing relative momentum in this way exposes areas of chop (Mo_Bars above zero but are in red or moving down, or when Mo_Bars are below zero and green or moving up) - convergence / divergence with price - and how this can act to expose the possibility of potential changes in price action or trend.
* there's so much more to play around with this setup - and maybe if there's enough interest there can be future dedicated posts on how utilize or even to evolve it further - there's a lot of potential here, to add more filters (maybe volume based), alerts, signals...etc - so let's see the interest :)
Here's the detailed (top chart) setup that Mo_Bars is based on -- The settings for the MA's on the price charts have been matched / sync'ed with the Mo_Bars settings on the lower panel to demonstrate how the script works and how it translate the MA action on the price chart to what we see below.
As always, please play around with the indicator to get used to how it works - use it in tandem with other indicators to get proper confirmations and adjust settings to suit your own trading style, time frame, and instruments
Feedback and thoughts are always welcome --- good luck!

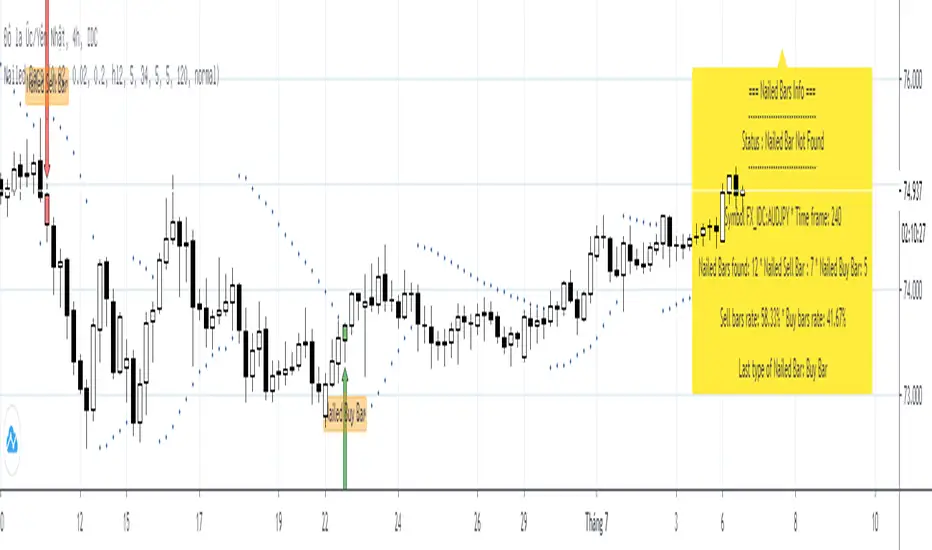
Nailed BarsNailed bars was introduced by Joy22 in an article "Pip Nailer Trading System" submit on forexstrategiesresources on 06/01/2012
Rule of Nailed Bars is below:
1. Nailed Sell Bar:
* PSAR appears above the bar
* The Awesome Oscillator (AO) turns red
* The Accelerator Oscillator (AC) turns red
2. Nailed Buy Bar:
* PSAR appears below the bar
* The Awesome Oscillator (AO) turns green
* The Accelerator Oscillator (AC) turns green
=== About this indicator: Nailed Bars ===
This indicator is detecting all nailed bars was appeared on chart and display infomations in a panel. So traders who are using "Pip Nailer Trading System" can easily control the trade.
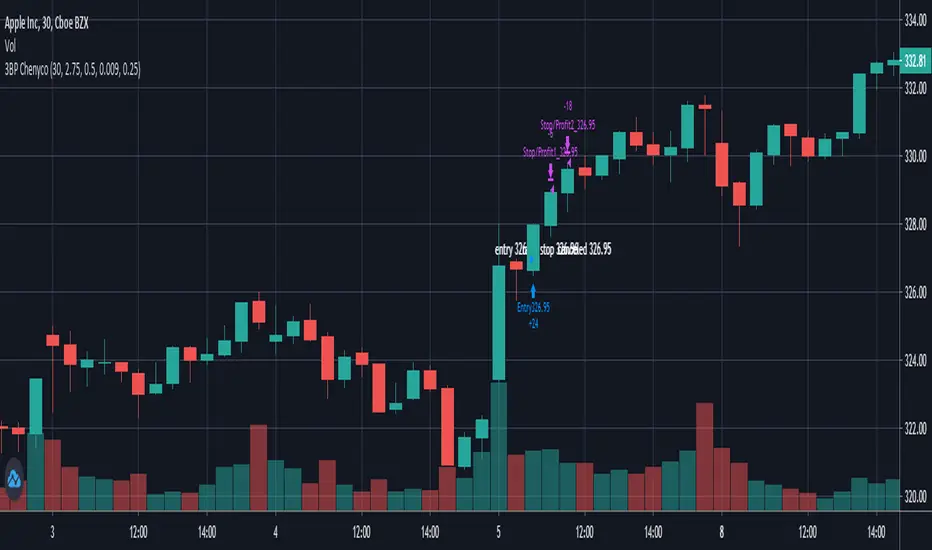
3 bar play partial1 1:1, take all 2:1 By ChenycoThis script is trying to find 3 Bar Play pattern and take profit of 2:1 with option to partial at 1:1.
The pattern has a weighted first bar and then a smaller bar with relative equally high. The first entry should be by the next bar only.
Parameters:
* Default strategy parameters, including initial capital and commissions.
* Risk Unit $ - The risk unit per trade in currency.
* Weighted Bar ATR Ratio - the ratio between the weighted bar true range to the ATR.
* Small Bar Ratio - The ratio between the smaller bar true range to weighted bar.
* Equal Price Ratio - The ratio of acceptable price change in compare to the stock price.
* Partial Qty Ratio - The ratio of the first partial equity.
Good luck!
Chen.
Security() Correction - Realtime vs. Historical BarsProblem
Pine's implementation of the security() function behaves differently in realtime vs. historical bars. Specifically, for historical bars, calling security() for a time frame (TF) larger/slower than the current chart's TF will return information about the last completed bar of the higher TF. However, for realtime bars (i.e. if you allow the chart to continue to plot in realtime), security() returns information about the presently in-progress bar of the higher TF. Clearly, this leads to discontinuity that is arbitrarily dependent upon when the user last loaded or refreshed the chart.
Solution
Fortunately, after understanding the problem, solving it is trivial: use security() normally for historical bars, but switch to explicitly requesting prior candle bars once the indicator is operating on realtime bars. I leave the source open here for any to use as they see fit. For testing, I include an input to allow switching back and forth between standard and corrected behavior.
Figure 1 displays the standard behavior we see in security() calls, and Figure 2 displays the behavior after my correction:
Figure 1: Typical security() behavior in Pine
Figure 2: Corrected security() behavior, forcing historical and realtime bars to refer to the same higher TF bar offset.
I publish this mostly as a reminder to myself, so I will not forget and then have to figure it out again next time it comes up in my scripting.
V21: Initial release.

CM_EMA Trend Bars + 9/21/34CM_EMA Trend Bars + 9/21/34 is a trend-following momentum indicator designed to clearly visualise market direction and strength using a triple Exponential Moving Average structure.
The indicator combines 9, 21, and 34 EMA calculations to colour price bars based on trend alignment. When faster EMAs are stacked above slower EMAs, bars highlight bullish momentum. When faster EMAs are stacked below slower EMAs, bars reflect bearish momentum. This makes trend conditions instantly readable without cluttering the chart.
By focusing on EMA structure rather than lagging signals, CM_EMA Trend Bars helps traders:
Identify high-probability trend conditions
Stay aligned with momentum
Filter out low-quality countertrend trades
Avoid chop and indecision zones
The colour-coded bars act as a trend confirmation tool, not an entry system on their own. It pairs especially well with price action, support and resistance, ORB strategies, ICT concepts, or higher-timeframe bias.
Best used for:
Trend confirmation
Bias filtering
Trade management and hold decisions
Scalping, day trading, and intraday swing trading
Key features:
Triple EMA logic using 9 / 21 / 34
Clean, non-repainting bar colouring
Works across all markets and timeframes
Minimal lag compared to single moving average tools

Hybrid Trend-Following Inside Bar BreakoutHybrid Trend-Following Inside Bar Breakout Strategy
The Hybrid Trend-Following Inside Bar Breakout Strategy is a rule-based trading system designed to capture strong directional moves while controlling risk during uncertain market conditions. It combines trend-following, price action, and volatility-based risk management into a single robust framework.
Core Concept
The strategy trades inside bar breakouts only in the direction of the dominant market trend. Inside bars represent periods of consolidation, and when price breaks out of this consolidation in a trending market, it often leads to impulsive moves with favorable risk–reward characteristics.
Key Components
1. Trend Filter
Uses 50 EMA and 200 EMA to define the market trend.
Bullish bias: 50 EMA above 200 EMA
Bearish bias: 50 EMA below 200 EMA
This filter prevents counter-trend trades and improves trade quality.
2. Volatility Filter
Compares fast ATR (14) with slow ATR (50).
Trades are taken only when volatility is expanding or above a minimum threshold.
This avoids low-volatility, choppy market conditions.
3. Inside Bar Breakout
An inside bar forms when the current candle’s high is lower than the previous candle’s high and the low is higher than the previous candle’s low.
A trade is triggered only when price breaks above or below the inside bar range in the direction of the trend.
4. Candle Quality Filter
Requires a minimum body-to-range ratio, ensuring that the breakout candle has strong momentum and is not driven by weak wicks.
Risk Management & Trade Management
Stop Loss (SL)
Placed using ATR-based dynamic stops, adapting to current market volatility.
Prevents tight stops in volatile conditions and wide stops in calm markets.
Partial Profit Taking
50% of the position is exited at 1.5R, locking in profits early.
This reduces psychological pressure and improves equity stability.
Trailing Stop
After partial profit is taken, the remaining position is managed with an ATR-based trailing stop.
Allows the strategy to capture large trend moves while protecting gains.
Cooldown Mechanism
After a losing trade, the system enters a cooldown period and skips a fixed number of bars.
This helps avoid revenge trading and overtrading during unfavorable market phases.
Why This Strategy Works
Trades only high-probability breakouts in trending markets
Adapts automatically to changing volatility
Combines price action precision with systematic risk control
Designed for consistent performance over long historical periods

3-Bar Inversion Pattern (Entry & Invalidation Levels)Very simple 3-bar inversion pattern looking for a bar that extends in the previous bar's direction, bar 2 having a body no bigger than 50% of bar 1's. and Bar 3 having a body close beyond the open of bar 1. Invalidation is set to the highest point of the 3 par pattern.

Yash RSI Bars - timeframe alartOnly bar coloring - No extra plots or lines
✅ Custom timeframe - Colors bars based on RSI from your selected timeframe
✅ White bars - When RSI is above overbought level (default 70)
✅ Yellow bars - When RSI is below oversold level (default 30)
✅ No color - When RSI is in neutral zone
✅ Overbought → Normal - Alert fires when white bars stop and RSI falls back below 70
✅ Oversold → Normal - Alert fires when yellow bars stop and RSI rises back above 30
✅ No alert on entry - Only alerts when bars return to normal/no color
Add the indicator to your chart
Click the bell icon ⏰ on the indicator
Select which alerts you want:
"RSI: Overbought to Normal"
"RSI: Oversold to Normal"
Choose: Notify, Email, SMS, or Webhook

Reversal 2 Bar + W%R🇺🇸 English Description
Reversal 2 Bar + W%R is a clean and powerful price-action indicator designed to detect momentum-based reversal signals by combining multi-bar structure with Williams %R exhaustion zones.
🔍 Core Logic
A reversal signal is triggered when:
Bullish Reversal
The current candle closes above the highest price of the previous 2 candles,
AND Williams %R entered Oversold (≤ OS level) within the last N bars (user-defined window).
Bearish Reversal
The current candle closes below the lowest price of the previous 2 candles,
AND Williams %R entered Overbought (≥ OB level) within the last N bars.
This approach captures real momentum shifts rather than simple wick touches and gives “credit” to signals shortly after the market hits OB/OS zones — ideal for traders who want price-action confirmation after exhaustion.
🎯 Why It Works
Confirms trend exhaustion using W%R OB/OS
Confirms breakout strength using 2-Bar structure
Avoids weak signals by requiring close-based confirmation
The user-defined window (5–10 bars) allows flexibility for different volatility environments
📈 What You Get
Clear bullish/bearish reversal markers (REV↑ / REV↓)
Auto-colored candles for quick trend bias
Optional W%R filtering
Alerts for automated trading or notifications
This indicator is ideal for scalpers, day traders, and swing traders who rely on clean PA signals + strong exhaustion confirmation.
============================================================================
🇹🇭 คำอธิบายภาษาไทย
Reversal 2 Bar + W%R คืออินดิเคเตอร์ Price Action แบบเรียบง่ายแต่ทรงพลัง ที่ออกแบบมาเพื่อหา “สัญญาณกลับตัวที่มีโมเมนตัมจริง” โดยใช้โครงสร้างแท่งเทียน 2 แท่งร่วมกับโซน Overbought/Oversold ของ Williams %R
🔍 หลักการทำงาน
อินดิเคเตอร์จะให้สัญญาณกลับตัวเมื่อ:
ขาขึ้น (Bullish Reversal)
แท่งปัจจุบัน ปิดสูงกว่า high ของ 2 แท่งก่อนหน้า
และ Williams %R เคยเข้าโซน Oversold ภายในช่วง N แท่งล่าสุด (ตั้งค่าได้)
ขาลง (Bearish Reversal)
แท่งปัจจุบัน ปิดต่ำกว่า low ของ 2 แท่งก่อนหน้า
และ Williams %R เคยเข้าโซน Overbought ภายในช่วง N แท่งล่าสุด
วิธีนี้ทำให้สัญญาณกลับตัว “มีความหมาย” กว่าแค่โดนไส้แทง เพราะใช้การปิดทะลุระดับราคา พร้อมยืนยันว่าโมเมนตัมฝั่งตรงข้ามเริ่มหมดแรงจากการเข้าโซน OB/OS แล้ว
🎯 จุดเด่น
ใช้ W%R ช่วยยืนยันว่าเกิด “ภาวะหมดแรง” จริง
ใช้โครงสร้าง 2 Bar เพื่อยืนยัน “การเบรกโครงสร้าง”
เน้นสัญญาณคุณภาพสูงด้วยเงื่อนไข close-based
มีหน้าต่างให้เครดิต 5–10 แท่งหลังเข้าโซน เพื่อไม่ให้สัญญาณกลับตัวหลุดโอกาส
📈 สิ่งที่อินดี้แสดงให้คุณ
จุดกลับตัว REV↑ / REV↓ ชัดเจน
ระบายสีแท่งเพื่อบอก bias
แจ้งเตือน (Alert) ตั้งค่าได้
เลือกเปิด/ปิดการใช้ W%R filter ได้
เหมาะกับเทรดเดอร์ทุกรูปแบบที่ต้องการสัญญาณกลับตัวที่แม่นยำ เข้าใจง่าย และไม่รกจอ

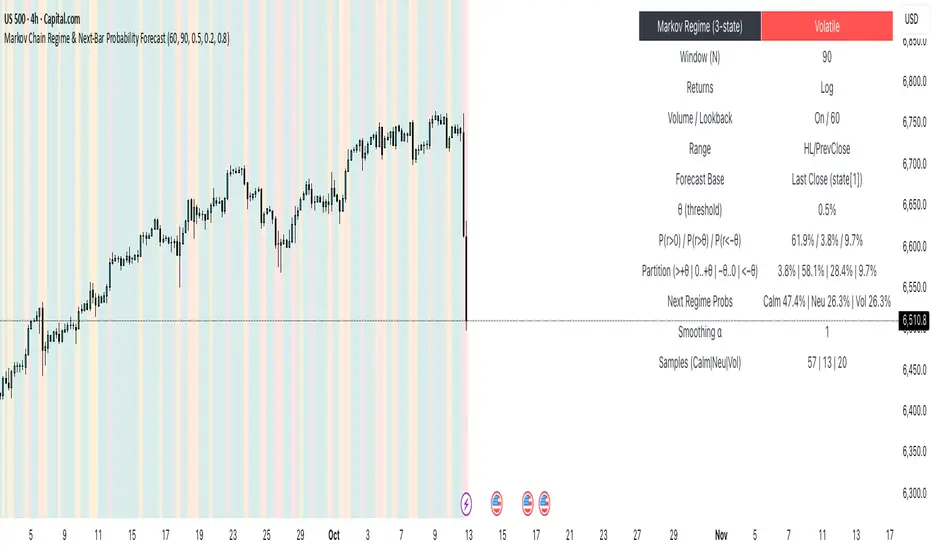
Markov Chain Regime & Next‑Bar Probability Forecast✨ What it is
A regime-aware, math-driven panel that forecasts the odds for the very next candle. It shows:
• P(next r > 0)
• P(next r > +θ)
• P(next r < −θ)
• A 4-bucket split of next-bar outcomes (>+θ | 0..+θ | −θ..0 | <−θ)
• Next-regime probabilities: Calm | Neutral | Volatile
🧠 Why the math is strong
• Markov regimes: Markets cluster in volatility “moods.” We learn a 3-state regime S∈{Calm, Neutral, Volatile} with a transition matrix A, where A = P(Sₜ₊₁=j | Sₜ=i).
• Condition on the future state: We estimate event odds given the next regime j—
q_pos(j)=P(rₜ₊₁>0 | Sₜ₊₁=j), q_gt(j)=P(rₜ₊₁>+θ | Sₜ₊₁=j), q_lt(j)=P(rₜ₊₁<−θ | Sₜ₊₁=j)—
and mix them with transitions from the current (or frozen) state sNow:
P(event) = Σⱼ A · q(event | j).
This mixture-of-regimes view (HMM-style one-step prediction) ties next-bar outcomes to where volatility is likely headed.
• Statistical hygiene: Laplace/Beta smoothing, minimum-sample gating, and unconditional fallbacks keep estimates stable. Heavy computations run on confirmed bars; “Freeze at close” avoids intrabar flicker.
📊 What each value means
• Regime label & background: 🟩 Calm, 🟧 Neutral, 🟥 Volatile — quick read of market context.
• P(next r > 0): Directional tilt for the very next bar.
• P(next r > +θ): Odds of an outsized positive move beyond θ.
• P(next r < −θ): Odds of an outsized negative move beyond −θ.
• Partition row: Distributes next-bar probability across four intuitive buckets; they ≈ sum to 100%.
• Next Regime Probs: Likelihood of switching to Calm/Neutral/Volatile on the next bar (row of A for the current/frozen state).
• Samples row: How many next-bar samples support each next-state estimate (a confidence cue).
• Smoothing α: The Laplace prior used to stabilize binary event rates.
⚙️ Inputs you control
• Returns: Log (default) or %
• Include Volume (z-score) + lookback
• Include Range (HL/PrevClose)
• Rolling window N (transitions & estimates)
• θ as percent (e.g., 0.5%)
• Freeze forecast at last close (recommended)
• Display toggles (plots, partition, samples)
🎯 How to use it
• Volatility awareness & sizing: Rising P(next regime = Volatile) → consider smaller size, wider stops, or skipping marginal entries.
• Breakout preparation: Elevated P(next r > +θ) highlights environments where range expansion is more likely; pair with your setup/trigger.
• Defense for mean-reversion: If P(next r < −θ) lifts while you’re late long (or P(next r > +θ) lifts while late short), tighten risk or wait for better context.
• Calibration tip: Start θ near your market’s typical bar size; adjust until “>+θ” flags truly meaningful moves for your timeframe.
📝 Method notes & limits
Activity features (|r|, volume z, range) are standardized; only positive z’s feed the composite activity score. Estimates adapt to instrument/timeframe; rare regimes or small windows increase variance (hence smoothing, sample gating, fallbacks). This is a context/forecast tool, not a standalone signal—combine with your entry/exit rules and risk management.
🧩 Strategies too
We also develop full strategy versions that use these probabilities for entries, filters, and position sizing. Like this publication if you’d like us to release the strategy edition next.
⚠️ Disclaimer
Educational use only. Not financial advice. Markets involve risk. Past performance does not guarantee future results.
3-6-9 Bars Time [promuckaj]3-6-9 BARS TIME
This indicator will mark bars that is "validated" by time analysis regarding Tesla numbers 3-6-9.
There is two types of calculation:
-HH + mm
-mm only
The math behind calculation is by combining the digits inside the current bars time on 1min timeframe.
For example if actual time is 06:48, by using HH+mm the result will be 0+6+4+8 = 18 = 1+8 = 9. If for the same time we use just minutes then the result will be 4+8 = 12 = 1 + 2 = 3. This means that on the same bar we have 3 and 9, so this bar will be marked out.
This could be useful as a confirmation tool for potential „Smart Money reversals“ entries and exits of your trades.
Options:
-Option to set custom labels (labels only, text only or none of them), with two desired colors, custom size and position of labels, to be above or below the bars.
-Option to activate bars color instead of using labels.
-There is set of sessions and macros, so you can define two master macro times, for example one for a London session and one for a NY session, or whatever you prefer.
Inside those master macro times there is option to use also small macros (by default xx:45 – xx:15) that is a part of two master macros. If macro sessions are in use then indicator will mark only bars that is a part of respective macro times.
Example:
The whole idea, to use this indicator, is as a additional confluence to your trade ideas. With that in mind here is one simple example where we have couple of confluences and want to anticipate entry at a specific time as our final trigger after we got already multiple previous confirmation on the chart and assets we want to trade.

Reversed Large Bars Strategy with Williams %RThis strategy script is ideal for volatile assets such as Natural Gas (NATGAS) or Crude Oil (WTI/Brent), which often exhibit strong price movements with high volume.
How It Works:
The strategy identifies short-term reversals after two consecutive large candles with significant volume, under specific conditions. It is based on the assumption that after strong directional moves, a temporary price exhaustion or reversal may occur.
Logic Breakdown:
Large Bar Detection:
A bar is considered “large” if its range (high – low) is significantly higher than the average (by a configurable percentage) and is accompanied by a spike in volume.
Two Consecutive Large Bars:
Entry is only considered when two large bars appear back-to-back — this strengthens the momentum signal.
Candle Type Filter:
For short entries: Two consecutive large bullish bars followed by a bullish candle → implies overextension upwards.
For long entries: Two consecutive large bearish bars followed by a bearish candle → implies overextension downwards.
Williams %R Filter:
The Williams %R oscillator adds confirmation based on overbought/oversold conditions:
Longs are allowed when %R is below the oversold level.
Shorts are allowed when %R is above the overbought level.
Ratio Logic:
A running percentage of bullish vs bearish large bars is tracked over a rolling period. This ensures entries are filtered based on broader context and trend dominance.
Stop Loss / Take Profit / Breakeven:
Each trade includes configurable SL/TP, and optional breakeven logic:
If unrealized profit exceeds a set percentage, SL is moved to entry (optionally with a buffer).

Volume bar range# Volume Bar Range (VBR) Indicator
## Overview
The Volume Bar Range indicator identifies key support and resistance levels based on high-volume price bars. It creates a visual range that represents significant price levels where the market has shown strong interest through volume confirmation.
## Features
### Visual Range Display
- **Blue/Aqua Area**: Shows the price range of the highest volume bar within the lookback period
- **Dynamic Color**: The fill color changes to indicate whether the range is stable (aqua) or newly updated (white)
- **Boundary Lines**: Invisible white lines mark the upper and lower boundaries of the range
### Trading Signals
- **BUY Signal**: Blue upward arrow appears when price breaks above the resistance level with volume confirmation
- **SELL Signal**: Black downward arrow appears when price breaks below the support level with volume confirmation
## How to Use
### Setup
1. Apply the indicator to any chart
2. The indicator automatically identifies the highest volume bar in the last 55 periods
3. The price range of this high-volume bar becomes your support/resistance zone
### Trading Strategy
- **Range Trading**: Trade within the identified support/resistance range
- **Breakout Trading**: Enter positions when price breaks above resistance (BUY) or below support (SELL)
- **Volume Confirmation**: Only take signals when current volume exceeds the 21-period average
### Signal Interpretation
- **BUY Signal**: Price closes above the resistance level with above-average volume
- **SELL Signal**: Price closes below the support level with above-average volume
- **No Signal**: Price remains within the range or volume is insufficient
## Key Parameters
- **Lookback Period**: 55 bars (automatically identifies the highest volume bar)
- **Volume MA**: 21-period simple moving average for volume confirmation
- **Signal Size**: Tiny markers to avoid chart clutter
## Best Practices
- Use on multiple timeframes for confirmation
- Combine with other technical indicators for stronger signals
- Pay attention to the color changes in the range area
- Consider market context and overall trend direction
## Ideal Markets
- Works well on liquid markets with consistent volume patterns
- Effective on stocks, forex, and crypto markets
- Best suited for swing trading and medium-term analysis
This indicator is particularly useful for traders who rely on volume analysis and want to identify key price levels where the market has shown significant interest.

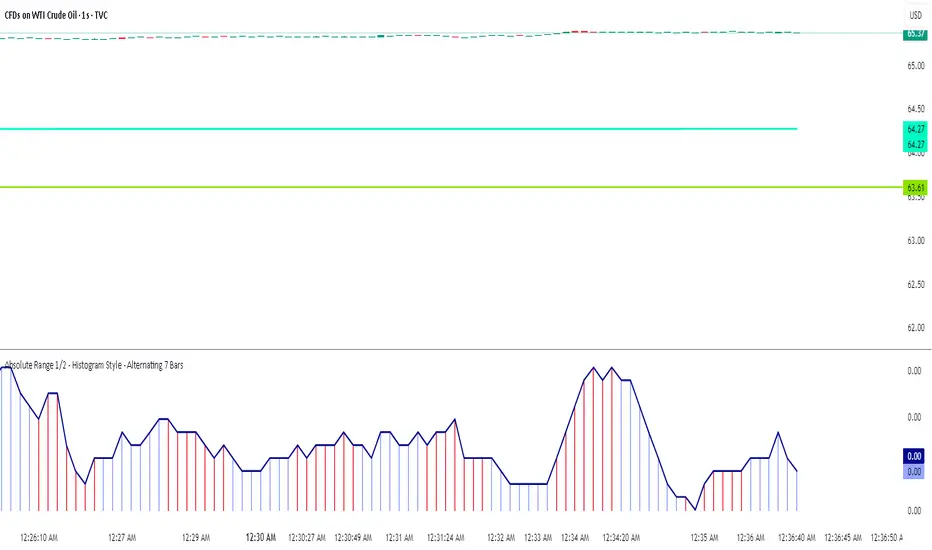
Absolute Range 1/2 - Histogram Style - Alternating 7 BarsAbsolute Range 1/2 - Histogram Style with Alternating 7-Bar Colors
This indicator calculates the 9-period simple moving average of the daily range (high minus low) and plots half of this value as a histogram and a line for easy visual tracking of range volatility.
To enhance readability, the histogram bars alternate colors every 7 bars — grouping the bars in blocks of seven with distinct colors. This makes it easier to observe range patterns and changes over time.
Features:
Smooths range data using SMA(9)
Plots half the average range as histogram bars and a line overlay
Alternates histogram bar colors every 7 bars dynamically
Clean, minimalistic design suitable for identifying volatility trends
Candle % High/Low Bar + HL Order + MA by Barty&PitPapcioWhat does the indicator show?
The "Candle % High/Low Bar + HL Order + MA by Barty&PitPapcio" indicator displays the percentage deviation of each candle’s high and low relative to its open price. The zero line represents the candle’s open — bars above zero show upward movement from the open (to high), bars below zero show downward movement (to low).
Additionally, the indicator plots a dot above or below each bar indicating which came first during the candle — the high or the low — based on data from a lower timeframe two steps below the current chart (for example, on a 1-hour chart it uses 15-minute data).
Finally, the indicator calculates and plots a user-selectable moving average (EMA, SMA, or WMA) of these "first high or low" signals, helping identify trends whether the first move is more often upwards or downwards.
Where do the data come from?
Percentage values are calculated directly from the current chart’s candles:
highPerc=(High−Open)/Open×100%,
lowPerc=(Low−Open)/Open×100%
The timing of the first high or low for each candle is retrieved from a lower timeframe, stepping down two levels from the current timeframe (e.g. from 1H to 15 min), providing better precision in detecting the order of highs and lows that may be blurred on higher timeframes.
Additional features:
Full customization of colors for bars, dots, zero line, grid, and thicknesses.
Background grid with adjustable scale and style.
Safety checks for missing lower timeframe data.
A moving average smoothing the sequence of first high/low signals to reveal directional tendencies.
Suggested strategy for technical analysis support
Identify dominant candle direction: If the dot often appears above the bar (first high), it indicates buying pressure; if below (first low), selling pressure dominates.
Use percentage deviations: Large percent bars indicate heightened volatility and potential reversal points.
Moving average on order signals: The EMA of high/low first signals smooths the noise, showing the dominant trend in the sequence of price moves, useful for filtering other signals.
Combine with other tools: This indicator can act as a directional filter on multiple timeframes, synergizing well with momentum indicators, RSI, or support/resistance levels to confirm move strength.
Lots of love, Bartosz

Strong Trend Bars (ATR-based)This is a ChatGPT pinescript meant as an indicator for detecting strength in the market. The primary function I use it for is to decide which bars to trail a stop loss beneath.
💥 Explanation of adjustable inputs:
Bull Close Threshold (default 0.6):
If set to 0.6, bull bars must close above 60% of bar height → low + 0.6 * barHeight
Bear Close Threshold (default 0.6):
If set to 0.6, bear bars must close below 40% of bar height → high - 0.6 * barHeight
This lets you experiment with tighter or looser filters. For example:
0.7 → only bars closing near the extremes will light up
0.5 → about midpoint
0.8 → very demanding, “almost full body” bars

4 Bar Momentum Reversal strategy█ STRATEGY DESCRIPTION
The "4 Bar Momentum Reversal Strategy" is a mean-reversion strategy designed to identify price reversals following a sustained downward move. It enters a long position when a reversal condition is met and exits when the price shows strength by exceeding the previous bar's high. This strategy is optimized for indices and stocks on the daily timeframe.
█ WHAT IS THE REFERENCE CLOSE?
The Reference Close is the closing price from X bars ago, where X is determined by the Lookback period. Think of it as a moving benchmark that helps the strategy assess whether prices are trending upwards or downwards relative to past performance. For example, if the Lookback is set to 4, the Reference Close is the closing price 4 bars ago (`close `).
█ SIGNAL GENERATION
1. LONG ENTRY
A Buy Signal is triggered when:
The close price has been lower than the Reference Close for at least `Buy Threshold` consecutive bars. This indicates a sustained downward move, suggesting a potential reversal.
The signal occurs within the specified time window (between `Start Time` and `End Time`).
2. EXIT CONDITION
A Sell Signal is generated when the current closing price exceeds the high of the previous bar (`close > high `). This indicates that the price has shown strength, potentially confirming the reversal and prompting the strategy to exit the position.
█ ADDITIONAL SETTINGS
Buy Threshold: The number of consecutive bearish bars needed to trigger a Buy Signal. Default is 4.
Lookback: The number of bars ago used to calculate the Reference Close. Default is 4.
Start Time and End Time: The time window during which the strategy is allowed to execute trades.
█ PERFORMANCE OVERVIEW
This strategy is designed for trending markets with frequent reversals.
It performs best in volatile conditions where price movements are significant.
Backtesting results should be analysed to optimize the Buy Threshold and Lookback parameters for specific instruments.

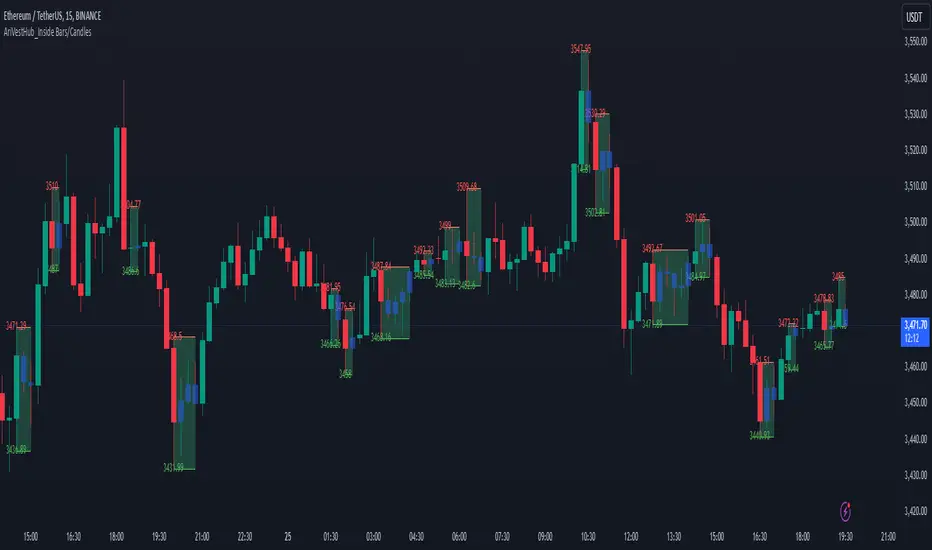
AriVestHub_Inside Bars/Candles
Introduction:
This script identifies and marks inside bars on your TradingView charts. An inside bar pattern is a two-bar candlestick pattern where the second bar is entirely within the range of the first bar. This pattern often signals consolidation and can indicate a potential breakout or trend continuation.
Trading Signals:
Inside bars can indicate potential trading signals. Traders often watch for breakouts above or below the inside bar to identify potential entry points.
Customization:
You can customize the colors, styles, and labels to suit your preferences.
Conclusion
This script is a useful tool for traders looking to identify inside bar patterns on their TradingView charts. By highlighting these patterns, traders can make more informed trading decisions based on potential market consolidations and breakouts.
High Volume BarsThis indicator highlights the highest volume bullish and bearish bars within a specified lookback period. It provides a visual representation of significant volume activity, which can be useful for identifying potential trend reversals or continuations.
Key Features:
Customizable lookback period to find highest volume bars
Lime-colored bars for bullish (up) volume
Fuchsia-colored bars for bearish (down) volume
Filled areas between high and low of highest volume bars
Easy-to-read visual cues for volume analysis
The indicator scans the specified number of previous bars to identify the highest volume bullish and bearish bars. It then colors these bars and draws filled areas to make them stand out on the chart. This can help traders quickly spot areas of significant buying or selling pressure.
Use this indicator to:
Identify potential support and resistance levels
Spot volume-based trend reversals
Confirm breakouts or breakdowns
Enhance your volume analysis in conjunction with price action
Adjust the lookback period to fine-tune the indicator's sensitivity to recent volume activity. A longer lookback period will identify more significant volume events, while a shorter period will be more responsive to recent changes.
Note: This indicator is best used in combination with other technical analysis tools and should not be relied upon solely for making trading decisions.