ATR without paranormal barsWhat Is the Average True Range (ATR)?
The average true range (ATR) is a technical analysis indicator, introduced by market technician J. Welles Wilder Jr. in his book New Concepts in Technical Trading Systems, that measures market volatility by decomposing the entire range of an asset price for that period.
Problems of the classic ATR indicator
The indicator does not show the true volatility of the instrument, at the moments of its strong acceleration or deceleration.
For example, after a strong increase in the volatility of an instrument, with smoothing enabled, the indicator value lags a lot and shows high values, while in fact the volatility has returned to its previous values.
A statistically sharp acceleration or deceleration in volatility ends as quickly as it began.
Due to the problem of data lag, the value of the ATP indicator value information is greatly reduced. The more we increase the smoothing period, the more the indicator value will lag.
The solution to the problem with a sharp temporary change in volatility is to exclude from the calculation the values of the sizes of bars whose size deviates strongly from the average value, such bars are called paranormal.
Examples of paranormal bars
Paranormal bars occur when there is a sharp acceleration or deceleration of the instrument's volatility.
This is characterized by the size of the bars, which are much smaller or larger than their average value in the next period of time.
Comparison of the ATR indicator and ATR_WPB
Comparison of the classic ATP indicator (top) and the ATP indicator calculated without taking into account paranormal bars (bottom).
The example shows that where sharp changes in the instrument's volatility are temporary, they do not affect the value of the ATR_WPB indicator.
Work example
Red - ATR_WPB indicator
Gray - True range
Blue - Momentum (MTM) is a simple leading momentum indicator
How is it calculated
Gray - True range
True Range (TR), which is defined as the greatest of the following:
* Current High less the current Low
* Current High less the previous Close (absolute value)
* Current Low less the previous Close (absolute value)
TrueRange = max {High-Low ; High - Close_previous ; Close_previous-Low}
Blue - Momentum (MTM) is a simple leading momentum indicator
Momentum (MTM) is simply calculated by subtracting the previous price close from the latest price close using the formula:
Momentum = Latest close - Specified close
where the specified period is any previous price close specified by the trader. The result is plotted as an unbound oscillator that oscillates above and below a center line, namely the zero line.
Red - ATR_WPB indicator
Mean value for N bars from a sample that excludes paranormal bars.
How to use
The value of the ATR_WPB indicator can be used to calculate the parameters of a trade, for example, to calculate the amount of risk (stop) per trade, taking 10%-15% of ATR_WPB as the amount of risk.
If we take the ATR_WPB value on the daily chart, we can assume how far the instrument can travel in a day, because the TrueRange value will always tend to the ATR_WPB value.
If the value of Momentum is significantly less than ATR_WPB, then we can conclude that the instrument has sufficient margin of movement, since the value of Momentum will tend to catch up with the value of ATR_WPB.
If the Momentum value is greater than ATR_WPB, then it is worth recognizing that the instrument has already exhausted the energy of its movement, since statistically the Momentum value rarely exceeds the ATR_WPB value.
In den Scripts nach "bar" suchen

candle countsmall script for count bar ...it count bar from open of day till end of day ...
in lower time its deleting candle count because of tradingview label limit 50
. bar counting it help me to teach trader bar by bar ...some of bar in all world chart are very important ..in al brook sir book and his website he marked many imortant bar no
for reference al brook sir said about bar counting method
the highest probability trade was the one that I said. When bar 62 was happening, I said, “Traders are buying,” you know, “I’m buying, it’s going up,” right? So 62 is the highest probability trade, but that does not mean it’s the easiest trade. It just means the probability that we’re going to get some kind of a measured move out of 62 is very high, probably 70 percent.
thanks to stack overflow that code is ans there
in this script many people help me thanks to @HappyBaby86 and @Kjaerbye#7503
sorry my english is not good.my native language is Hindi ..

Renko Bar ChangeI realized it's not in the TV Library so I think it's mandatory to add.
If you wish to access and use for yourself contact me - I reply on Average in less than 4 hours on a 60 day period.
---
Renko Bar Change Indicator Documentation:
Renko Parameters:
Set Box Size either via ATR or your own Float-Value after choosing the correct Renko Style-Option.
Both Renko Style Options are self-explanatory.
Alerts and Plots:
1) Green arrow visualizing a green Renko bar after a red Renko bar
2) Red arrow visualizing a red Renko bar after a green Renko bar
3) Alert for green Renko Bar after red Renko Bar
4) Alert for red Renko Bar after green Renko Bar

(JS)DMI BarsAlright - so this is my own version of John Carter's "10x Bars"... I have done multiple things that are different from his version so they are slightly different..
So first of all the main indicator is based off of the ADX and the DMI;
For those who aren't familiar with it, Directional Movement is what you'd pull up under "built-in's" from the indicators tab (if you want to check it out).
The standard interpretation of this however, is when the ADX is above 20 that suggests the trend is strong, whereas under 20 suggests it is weak.
Also, when the D+ is above the D- that suggests a bullish trend, and D- above D+ suggests a bearish trend.
These bars take away the need to have it at the bottom of your screen, and places the data on the bars on your chart instead.
=========================================================================================================================================
So here's what the colors stand for -
Yellow - The ADX is under 20, no strength in trend
Shades of green occur when the ADX is above 20 and there's a bullish trend (D+ higher than D-)
Bright Green (Lime) - Bullish trend, D+ above 30
Green - Bullish Trend
Yellow Green - Bullish trend, D+ below 15
Shades of red occur when the ADX is above 20 and there's a bearish trend (D- higher than D+)
Bright Red - Bearish trend, D- above 30
Red - Bearish Trend
Orange - Bearish trend, D- below 15
=========================================================================================================================================
I have also added multiple time frame labels (label script used is the one created by Ricardo Santos)
These labels are color coded the same as the bars/candles, and they appear off to the right of your screen using every built in time increment from TradingView.
The purpose is to show you in real time, and on any chart resolution, what the current trend is on every individual time frame.
So using just one single chart you'll see your current resolutions candles, but also on the labels you'll see:
1 Minute
3 Minute
5 Minute
15 Minute
30 Minute
45 Minute
1 Hour
2 Hour
3 Hour
4 Hour
Daily
Weekly
Monthly
There is an input I added that allows you to adjust where your labels appear on the side of your screen as well!
=========================================================================================================================================
Now onto the volume spike portion of the indicator. This will plot a blue dot under each bar that has a spike in volume which meets your specified criteria.
I have 500% as the default setting.
What that means is that this indicator looks back and gets the 50 bar volume average and then applies dots where volume is 500% above average.
=========================================================================================================================================
Now finally, the reversal arrows. This is another simple to understand concept that I first read in John Carter's book "Mastering the Trade" that he calls "HOLP/LOHP".
I have added the ability to change the look back period you'd like the indicator to watch for highs and lows on.
What that stands for is 'High of Low Period' and 'Low of High Period', and it is used like this-
Whenever a bar makes a new high the indicator watches the low on that highest bar. Then when a bar afterwards makes a lower low then the one on the high bar,
a reversal arrow is given. Apply this same concept in the other direction in for the highs on the lowest bars.
=========================================================================================================================================
Now, I didn't want to make a "set" or have a bunch of different indicators out there that are all intended for the same package, so I took the time to put them together,
and if there's a part of it you don't care for they can easily be turned off in the settings.
Enjoy!

Sri - 26 Volume Bar: D/W/M with SMA 20📊 Sri – 26 Volume Bar (D / W / M)
Enhanced Volume Visibility with Buy–Sell Range & MA
Sri – 26 Volume Bar is a visual-first, multi-timeframe volume analysis tool created to solve a common TradingView limitation:
Traditional volume (including free built-in volume) becomes visually compressed, unreadable, or unusable when combined with other indicators or panels.
This script reconstructs and re-displays volume in a clean, scalable, and directional format, making volume clearly visible even in indicator-heavy layouts.
🔹 Why this indicator exists (Problem → Solution)
❌ Problem with traditional volume
Built-in volume bars:
Become too small when multiple indicators are applied
Lose relative clarity across timeframes
Do not show buy vs sell participation
Are hard to interpret when scaling is shared with other plots
✅ Solution provided by this script
Volume is redrawn independently using object-based rendering
Bars are scaled relative to recent volume, not chart height
Display is forward-projected, avoiding overlap with price or indicators
Buy and Sell volume ranges are visually separated
Result: Clear, readable volume analysis even in complex chart setups
🔹 Core Features & Originality
1️⃣ Multi-Timeframe Volume Reconstruction (D / W / M)
Volume is fetched from Daily, Weekly, or Monthly timeframes using request.security()
Timeframe selection:
Auto – adapts to chart timeframe
Manual – fixed D / W / M
Enables higher-timeframe volume insight on any chart
2️⃣ Buy–Sell Volume Range Visualization
Each volume bar is split into Buy and Sell ranges
Calculated using candle anatomy:
Buy volume → (Close − Low)
Sell volume → (High − Close)
Helps identify:
Accumulation vs distribution
Demand vs supply imbalance
Participation strength within each bar
This goes beyond standard volume by showing where volume occurred, not just how much.
3️⃣ Enhanced Visibility vs Free Traditional Volume
Volume bars:
Maintain consistent height and clarity
Are independent of other indicators
Remain readable even when many scripts are active
Ideal for traders who:
Use multiple indicators
Trade from clean layouts
Rely on volume confirmation but dislike clutter
4️⃣ Volume Moving Average (Optional Confirmation)
SMA or EMA applied to higher-timeframe volume
Helps identify:
Volume expansion
Volume contraction
Breakout or exhaustion conditions
🔹 How to use this indicator
Best use cases:
Confirm breakouts using higher-TF volume strength
Spot accumulation before price expansion
Detect weak moves with low participation
Improve volume readability on crowded charts
Suggested setup:
Intraday charts → Auto (Daily volume)
Swing trading → Weekly volume
Positional analysis → Monthly volume
⚠️ Important Notes
This is not a buy/sell signal indicator
Buy/Sell volume is an estimated range, intended for comparative analysis
Designed as a confirmation and context tool, not a standalone system
🔒 Why the source is protected
This script uses:
Custom multi-TF array handling
Object-based volume rendering
Dynamic scaling independent of chart compression
Forward-projection logic for clean visualization
While the concept and usage are fully explained, the implementation is protected to preserve originality.
✅ Summary
Sri – 26 Volume Bar transforms traditional volume into a clear, scalable, directional tool, solving the visibility limitations of standard volume — especially when multiple indicators are used.

ALMA v1 ATR Bands With Trend BarsALMA v1 ATR Bands With Trend Bars is a trend-context overlay indicator designed to visualize price structure, momentum direction, and volatility expansion directly on the chart.
It combines the Arnaud Legoux Moving Average (ALMA) with ATR-based dynamic bands and a dual-momentum bar-coloring model, providing a clear visual framework for interpreting trend conditions without compressing market behavior into a single decision output.
Conceptual Architecture
The indicator is built around three complementary layers, each serving a distinct analytical role:
1. ALMA Trend Curve
The core trend line is computed using the Arnaud Legoux Moving Average, which emphasizes responsiveness while maintaining smoothness through controlled offset and sigma parameters.
An optional adaptive filter suppresses minor fluctuations, allowing the curve to focus on structural price movement rather than short-term noise.
Color changes in the ALMA line reflect directional slope state, not trading actions.
2. ATR Volatility Bands
ATR-based bands are calculated around the filtered ALMA curve:
The bands expand and contract dynamically with volatility.
They provide a contextual envelope that helps visualize price dispersion relative to the underlying trend.
These bands are intended as a volatility reference, not fixed support or resistance levels.
3. Trend Bars (Momentum State Layer)
Price candles are recolored using a dual-CCI momentum model:
A fast and a slow CCI operate together to classify momentum agreement.
When both momentum measures align, bars reflect directional bias.
When momentum disagrees, bars shift to a neutral state.
This layer highlights momentum consistency, not execution timing.
Trend State Visualization:
Discrete visual markers may appear when the slope direction of the ALMA curve changes.
These markers indicate structural trend transitions based on confirmed bar closes and do not repaint.
They are intended to support visual interpretation of trend evolution, not to automate decisions.
Reliability:
No repainting: all states, colors, and markers are confirmed on bar close.
Consistent behavior across instruments and timeframes.
Designed for stable visual output during live market conditions.
Customization Options:
ALMA length, offset, sigma, and optional shift.
Adaptive filtering sensitivity.
ATR period and deviation multiplier.
Momentum sensitivity modes for bar coloring.
Fully customizable color palette.
Optional alerts for structural trend changes.

Inside and Outside Bar@55Explanation
Definition of Inside Bar:
Loose Definition: The high and low of the current candlestick are both within the high and low range of the previous candlestick.
Strict Definition: One extreme value (either high or low) of the current candlestick is equal to that of the previous candlestick, while the other extreme value falls within the range of the previous candlestick.
Definition of Outside Bar:
Loose Definition: The high of the current candlestick is higher than that of the previous candlestick, and the low of the current candlestick is lower than that of the previous candlestick.
Strict Definition: One extreme value (either high or low) of the current candlestick is equal to that of the previous candlestick, while the other extreme value breaks through the range of the previous candlestick.
plotshape Function: If an inside bar or outside bar is detected, the letter i (for inside bar) or o (for outside bar) will be displayed above the corresponding candlestick.
Parameters:
tightInside: When this toggle is enabled, the definition of an inside bar will be more strict, meaning one extreme value equals that of the previous candlestick and the other extreme value stays within the range of the previous candlestick.
tightOutside: When this toggle is enabled, the definition of an outside bar will be more strict, meaning one extreme value equals that of the previous candlestick and the other extreme value breaks through the range of the previous candlestick.

Actionable Signals: Hammers, Shooters, and Inside Bars#TheStrat Actionable Signals
This indicator automatically detects hammers, shooters, and inside bars, which are key reversal and continuation patterns that can signal actionable trading opportunities. These 'Actionable Signals' are based on #TheStrat methodology developed by Rob Smith.
This indicator allows you to use a 'Classic' hammer/shooter definition as well as to customize hammer/shooter candle proportions to your liking.
Pattern Types
Classic Hammer/Shooter - Traditional pin bar pattern featuring a small body (≤30% of range) positioned at the extreme with a long dominant wick (3x+ body ratio). The most widely recognized reversal signal.
Custom Hammer/Shooter - Fully adjustable pattern parameters allowing you to fine-tune detection criteria for your specific trading strategy and timeframe preferences.
Paddle - Strong momentum bar with a large body (up to 85%) closing within 5% of the extreme. Identifies continuation moves with conviction. Color-validated (green hammers, red shooters).
Rejection - Wick-dominant pattern showing price rejection at extremes. Features moderate body (≤60%) with strong rejection wick (≥40%). Color-agnostic for flexibility.
Inside Bar - Bar contained entirely within the previous bar's range, signaling consolidation and potential breakout setups.
Key Features
Multi-Pattern Detection: Enable multiple pattern types simultaneously to capture different market structures
Pivot Validation: Optional swing high/low requirement ensures patterns occur at meaningful inflection points
Session Filtering: Restrict signals to specific trading sessions across multiple timezones
Visual Clarity: Color-coded markers distinguish between pattern types (customize via Style settings)
Testing Panel: Built-in debugging tool displays detailed bar analysis for fine-tuning detection parameters
How to Use
Default Settings: Start with Classic, Paddle, and Rejection patterns enabled for balanced signal generation
Pivot Filter: Keep "Require Swing High/Low" enabled to focus on patterns at key support/resistance levels
Customization: Adjust pattern strictness parameters based on your timeframe and trading style
Colors: Modify marker colors and styles through the Style tab for optimal chart visibility
Testing Panel: Enable to see why patterns are or aren't triggering on specific bars
Please share any issues you encounter, it will help improve the script for everyone!
Note: This indicator displays historical patterns and should be used as part of a comprehensive trading strategy. Past performance does not guarantee future results.

ATR + Today's H/L Circles + MA Type + Bar Count### ATR + Today's H/L Circles + MA Type + Bar Count
This indicator combines multiple intraday analysis tools into one compact and efficient display. It provides traders with real-time volatility metrics, daily high/low visual cues, configurable moving averages, and per-day bar counting for improved situational awareness.
**Features:**
1. **Average True Range (ATR) Monitor**
- Displays both ATR (price units) and ATR in tick equivalents directly in the status line.
- Supports multiple smoothing methods: RMA, SMA, EMA, and WMA.
- Allows customization of tick size to match non-standard instruments.
2. **Intraday High/Low Markers**
- Automatically detects the highest and lowest points of the current trading day.
- Marks these levels with subtle circular labels that update dynamically as new highs or lows form.
3. **Configurable Moving Average (MA)**
- User-selectable type (RMA, SMA, EMA, or WMA) and period.
- Fully customizable color and line width to match chart style.
- Designed to provide flexibility across trend-following strategies.
4. **Per-Day Bar Counter**
- Resets automatically at the start of each trading day.
- Highlights the first bar with a distinct color and allows user-defined interval labels (e.g., every 5 bars).
- Helps intraday traders gauge time and price development within daily sessions.
5. **Compact ATR Panel**
- Optional floating table displaying current or historical ATR values (configurable number of bars ago).
- Supports four corner positions with adjustable decimal precision.
- Updates automatically on the last bar for efficient chart performance.
**Use Cases:**
Ideal for day traders and scalpers who rely on intraday volatility awareness, bar-based rhythm, and trend confirmation. The indicator is designed to be unobtrusive yet information-rich, offering a holistic intraday view without cluttering the chart.

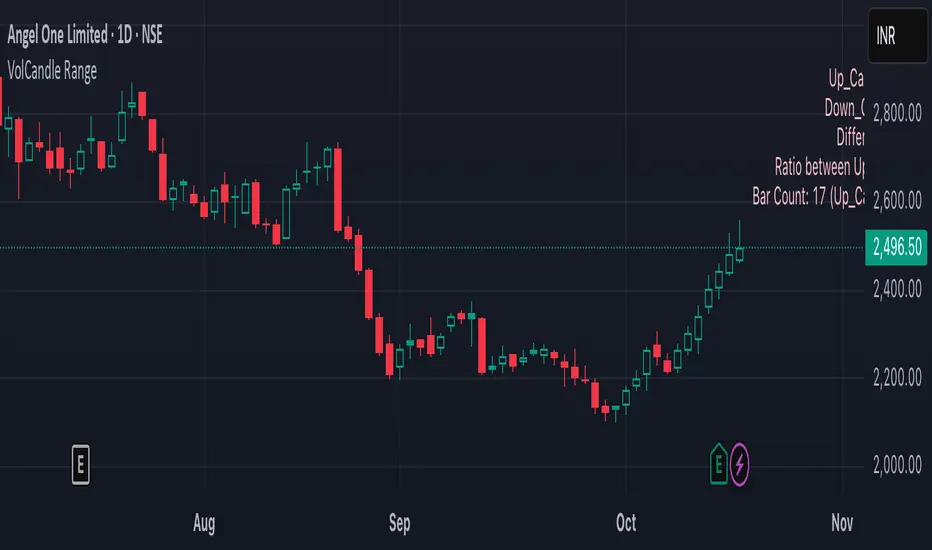
VolCandle_Start_End BarsThe “VolCandle_Start_End Bars” Pine Script is a custom TradingView indicator designed to calculate and display volume-based candle statistics between two user-defined time points. It visually summarizes trading activity across a specific date range by comparing up-candle and down-candle volumes.
Functionality
The script allows users to select a start and end bar (dates) using the input fields “Select starting Bar” and “Select ending Bar.” It then examines all candles within this range to calculate:
Total volume for up candles (candles where the close is higher than the previous candle).
Total volume for down candles (candles where the close is lower than the previous candle).
Difference and ratio between up and down volumes.
Count of up and down candles within the period.
Calculation Logic
A loop checks each bar's closing price and compares it with the previous one.
For every matching bar within the chosen time range:
If the close increases → its volume is added to up volume.
If the close decreases → its volume is added to down volume.
The process continues for up to 1000 historical bars, counting each bar type and accumulating total volumes.
Display and Labeling
The script calculates an appropriate label position using recent highs and lows, then dynamically creates a label on the chart showing:
Up_Candles volume
Down_Candles volume
Volume difference and ratio
Total bar count with up/down candle counts
The text is displayed in a soft pink tone using the label.new() function for visual clarity.
Utility
This indicator helps traders easily analyze buying vs. selling volume pressure across custom time intervals. It is particularly useful for comparing sentiment in specific trading phases (for example, before and after a consolidation or breakout).
All computations are done locally on the chart — the indicator does not place trades or alter candles.
In short, this script provides a compact visual and statistical summary of market volume distribution between rising and falling candles in a chosen date window, offering insight into the dominant market force during that time range.
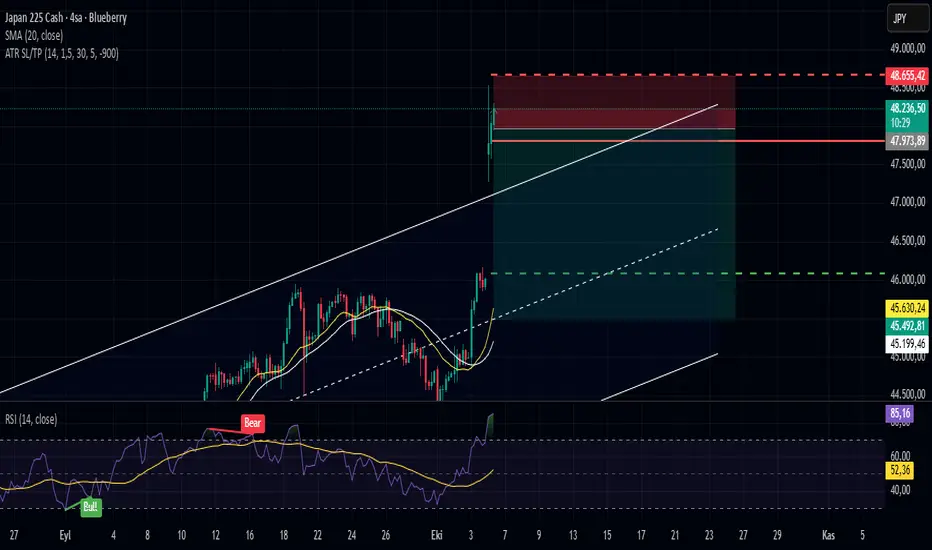
ATR-Based Stop Loss & TP (Last Bar Only, Styled, Dynamic RR)ATR-Based SL/TP (Last Bar Only, Styled, Dynamic RR)
This indicator calculates SL and TP levels based on the 30-bar Average True Range (ATR) and displays them as horizontal lines on the chart.
Features:
- Separate SL and TP lines for Long and Short positions.
- Long SL: red solid line
- Long TP: green solid line
- Short SL: red dashed line
- Short TP: green dashed line
- Lines extend to the right, based on the last bar only.
- Labels are displayed to the right of the lines and remain fixed.
- Risk:Reward ratio (R:R) is adjustable via input.
Inputs:
- ATR Length: period used for ATR calculation
- ATR Multiplier: ATR multiplier for SL/TP distance
- Bars for Average ATR: number of bars to calculate average ATR (default: 30)
- Risk:Reward: desired R:R ratio
- Label Right Offset Bars: number of bars to shift the label to the right for better visibility
Usage: Visualizes SL and TP levels for the last bar only. Lines and labels update automatically with each new bar.
1300 BarThe "1300 Bar" indicator is a simple yet effective tool designed to highlight the 1:00 PM EDT (New York time) bar on your chart with a yellow background. This helps traders and analysts easily identify this key intraday mark for strategic analysis or decision-making.
Key Features:
Time-Specific Highlighting: Targets the 13:00 EDT bar using the America/New_York timezone, ensuring accuracy regardless of your chart's display timezone. Focuses solely on coloring the bar yellow, providing a clear visual cue without additional overlays. Works on any symbol and timeframe, though best viewed on 1-minute to 30-minute charts for precise 13:00 EDT alignment.
How to Use:
Add the "1300 Bar" indicator to your chart. The 13:00 EDT bar will be highlighted yellow automatically. Scroll to historical data (e.g., 1:00 PM EDT on prior trading days) to see the highlighted bar.
Notes:
The indicator uses the America/New_York timezone, automatically adjusting for Daylight Saving Time (e.g., UTC-4 in EDT as of now). For best results, apply to a low timeframe (e.g., 1-min to 30-min) to ensure a bar exists at 13:00 EDT. No additional customization options are included, keeping the focus on the yellow bar highlight. Ideal for day traders or analysts who need a straightforward way to mark the 1:00 PM EDT period on their charts!

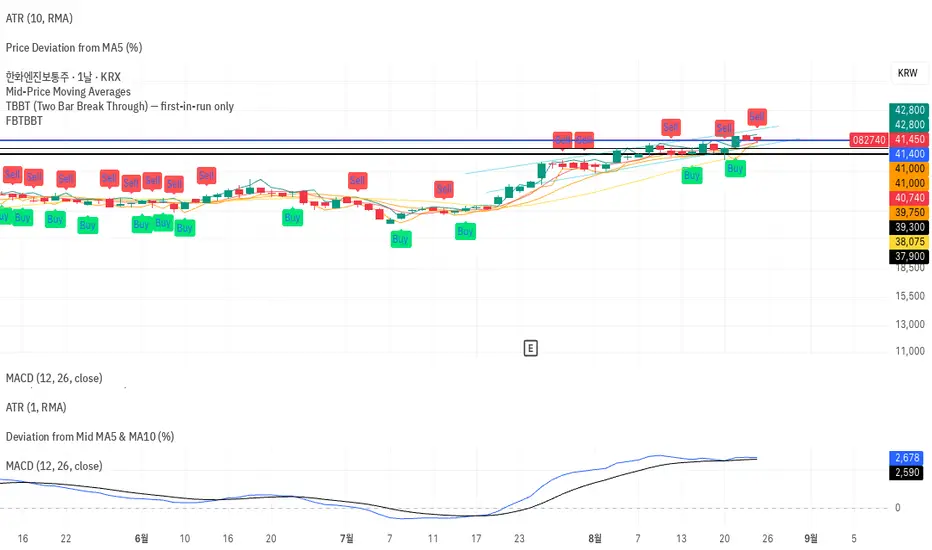
FBTBBT (Filtered Black Two Bar Break Through)📘 FBTBBT (Filtered Black Two Bar Break Through)
Overview
FBTBBT is a filtered breakout indicator based on the classical Two Bar Break Through (TBBT) concept.
It generates Buy and Sell signals when price breaks above or below the previous bar’s high/low, but only displays the **first signal in a run** to avoid noise and duplicates.
- Buy Signal → Break above previous high
- Sell Signal → Break below previous low
- Filtered → Only the first signal in a consecutive streak is shown
---
Key Features
1. Filtered Signals
• Avoids repeated identical signals.
• Example: 3 consecutive bars breaking the previous low → only the first bar shows a Sell signal.
2. Confirmation Options
• Real-Time Mode: signals appear intrabar as soon as the breakout happens.
• Close Confirmation: signals appear only after bar close beyond previous high/low (reduces repainting).
3. Visual Aids
• Green “Buy” labels below breakout bars.
• Red “Sell” labels above breakout bars.
• Optional lines for previous bar’s high/low levels.
4. Alerts
• Alerts trigger only on the first filtered signal in each run.
• Messages specify breakout above (Buy) or below (Sell).
---
How to Use
• Add FBTBBT to your TradingView chart.
• Choose Real-Time or Close-Confirmed signals depending on your style.
• Focus on the **first breakout signal**; ignore duplicates until the opposite side appears.
• Combine with trend filters, volume, or higher timeframe context for stronger accuracy.
---
👉 In short:
**FBTBBT = Clean, filtered breakout signals with no noise.**
Perfect for traders who want **precise first-bar breakouts** while avoiding repeated alerts.
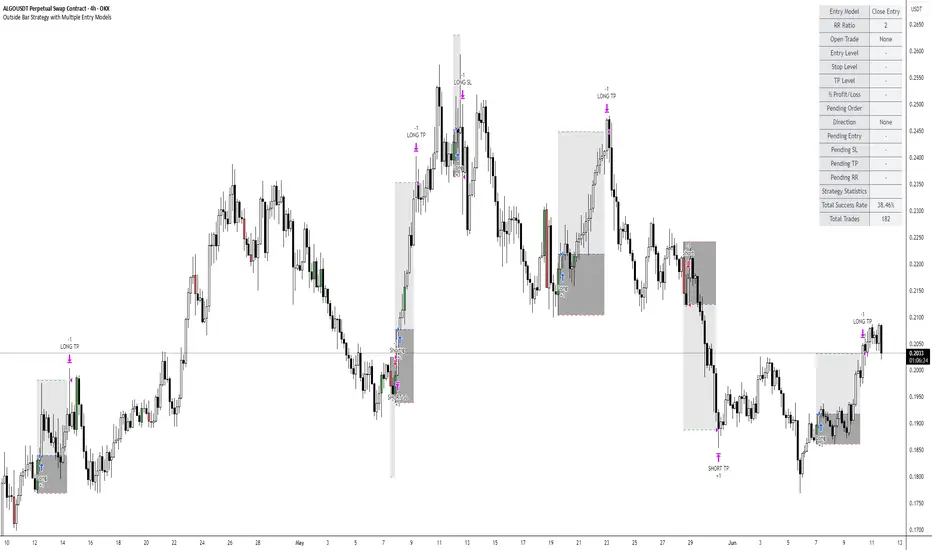
Outside Bar Strategy with Multiple Entry ModelsOutside Bar Strategy with Multiple Entry Models
This Pine Script strategy implements a versatile trading system based on the Outside Bar pattern, offering three distinct entry models: Close Entry, High/Low Entry, and Midpoint Entry. Designed for traders seeking flexibility, the strategy includes customizable risk/reward ratios, an optional EMA trend filter, and enhanced visualization with line fills.
Key Features:
Entry Models:
Close Entry: Enters a long position when the current candle closes above the high of the previous outside bullish bar . For short, it enters when the candle closes below the low of the previous outside bearish bar.
High/Low Entry: Enters a long position when the price crosses above the high of the previous outside bullish bar . For short, it enters when the price crosses below the low of the previous outside bearish bar .
Midpoint Entry: Places a limit order at the midpoint of the previous outside bar, entering when the price reaches this level.
EMA Trend Filter: Optionally filters signals based on the alignment of EMAs (7 > 25 > 99 > 200 for long, 7 < 25 < 99 < 200 for short). Can be toggled via the Use EMA Filter input.
Risk/Reward Management: Configurable risk/reward ratio (default 2.0) with stop-loss set at the low/high of the outside bar and take-profit calculated based on the bar's range multiplied by the ratio.
Visualization:
Lines for entry, stop-loss, and take-profit levels (dashed for active trades, solid for pending Midpoint Entry orders).
Line fills: Red between entry and stop-loss, green between entry and take-profit.
Previous lines and fills persist on the chart for historical reference (line deletion disabled).
Pending limit orders for Midpoint Entry extend dynamically to the right until triggered or canceled.
Information Table: Displays real-time trade details (entry model, RR ratio, open trade status, entry/stop/take-profit levels, profit/loss percentage) and strategy statistics (success rate, total trades). For Midpoint Entry, pending order details are shown.
Inputs:
Entry Model: Choose between Close Entry, High/Low Entry, or Midpoint Entry (default: Close Entry).
Risk/Reward Ratio: Set the RR ratio (default: 2.0, step: 0.5).
Use EMA Filter: Enable/disable the EMA trend filter (default: true).
Line Colors and Style: Customize colors for entry, stop-loss, and take-profit lines, and select line style (solid or dashed).
Table Settings: Adjust table text color, size (small/normal/large), and position (right top/middle/bottom).
Disclaimer: This strategy is for educational purposes only. Backtest thoroughly and use at your own risk. Past performance is not indicative of future results.
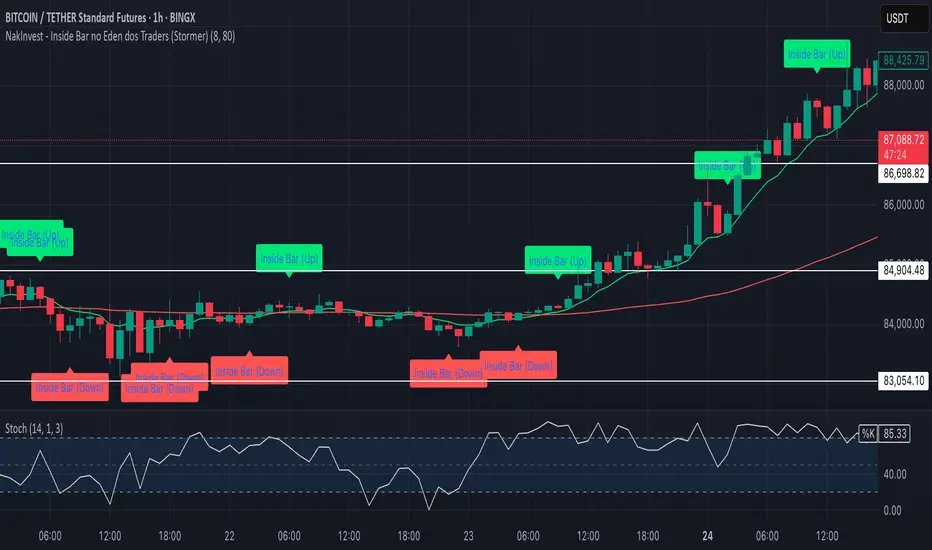
NakInvest - Inside Bar no Eden dos Traders (Stormer)📌 NakInvest - Inside Bar Detector (Éden dos Traders Enhanced Detection)
This indicator is designed to identify Inside Bars that occur during strong trending conditions, following the popular Éden dos Traders strategy by Stormer, famous brazilian trader. It uses the relationship between two EMAs (Short EMA & Long EMA) to determine whether the market is in a bullish or bearish trend, and highlights Inside Bars that meet specific criteria.
⸻
🔍 What This Indicator Does:
1. EMA-Based Trend Detection:
• Identifies Uptrends when the Short EMA is above the Long EMA.
• Identifies Downtrends when the Short EMA is below the Long EMA.
2. Inside Bar Detection:
• An Inside Bar is detected when the entire candle (body & wicks) is contained within the body of the previous candle.
• This pattern suggests consolidation and potential breakouts, especially when found within a strong trend.
3. Debug Mode for Transparency:
• When enabled, provides visual markers to indicate when the conditions for trend detection and Inside Bars are met.
• Helps traders understand why certain candles are detected and others are not.
⸻
📈 How to Use:
• Apply this indicator to any market and timeframe, but it’s most effective on higher timeframes (H1, H4, Daily).
• Ideal for traders looking for trend-continuation setups or reversal signals after periods of consolidation.
• Combine this indicator with other tools (e.g., Volume Analysis, Price Action Patterns) for greater accuracy.
⸻
⚙️ Indicator Settings:
1. Short EMA Length: The period for the fast-moving average (default: 8).
2. Long EMA Length: The period for the slow-moving average (default: 80).
3. Enable Debug Mode: Toggle visibility of debug markers to better understand condition logic.
⸻
📢 Alerts:
This script includes labels for:
• IB (Up): Inside Bar detected during an uptrend.
• IB (Down): Inside Bar detected during a downtrend.
⸻
📌 Disclaimer:
This indicator is intended for educational purposes only and is not financial advice. Always perform your own research and consult with a financial professional before making any trading decisions.
Price to Bar Ratio - Scale / Scales / ScalingPrice to Bar Ratio - Scaling
The Price to Bar Ratio - Scaling indicator for TradingView is designed for traders who utilize Gann-based techniques, Michael Jenkins methodologies, or geometric market analysis. It calculates the relationship between price movement and time (bars), providing a bar-to-price ratio that traders can use to align their charts with structured scaling methods.
Key Features:
• Geometry-Based Scaling – Designed for traders using market geometry, time/price balancing, or cycle analysis.
• Automatic Ratio Calculation – Computes a bar-to-price ratio based on price movement and time.
• Square & Rectangle Modes – Provides different scaling approaches to suit various analytical methods.
• Balanced Chart Structure – Helps maintain a proportional relationship between price and time.
• Customizable Inputs – Adjustable parameters for flexibility across different markets, assets, and timeframes.
How to Use:
1. Apply the Price to Bar Ratio - Scaling indicator to your TradingView chart.
2. Enable Magnet Mode in TradingView to help anchor points snap accurately to price levels.
3. Manually select your range using the four anchor points to define the area for calculation.
4. The indicator will generate a table displaying the calculated bar-to-price ratio.
5. Copy the recommended value from the table.
6. Open the chart settings in TradingView.
7. Locate the "Lock Price to Bar Ratio" input field.
8. Paste the copied ratio value into the input field and apply the changes.
9. Due to TradingView's limitations on the magnet option for anchor points, it is recommended to add a new instance of the indicator rather than dragging the anchor points to a new range. This prevents unwanted snapping behavior and ensures accurate recalculations.
Will be adding more formulas in the future.
Indicator in use:

Date Display with Bar Counter and EMA===== ENGLISH DESCRIPTION =====
OVERVIEW:
This is a multi-function indicator that combines three useful tools in one script:
1. Date Display - Shows current date and symbol information in a customizable table
2. Bar Counter - Displays sequential bar numbers at specified intervals
3. EMA (Exponential Moving Average) - Plots an EMA line with customizable settings
FEATURES:
1. DATE DISPLAY:
- Shows date in full format (e.g., "Mon ∙ January 1, 2023") or short format (e.g., "Mon ∙ 01.01.23")
- Option to show/hide day of week
- Option to show/hide symbol and timeframe information
- Customizable table position (top/middle/bottom, left/center/right)
- Automatic color adjustment based on chart background
2. BAR COUNTER:
- Displays sequential bar numbers below price bars
- Customizable display frequency (every X bars)
- Special handling for Hong Kong futures (resets at market open)
- Different reset logic based on timeframe (daily, weekly, monthly)
- Customizable text size and color
3. EMA INDICATOR:
- Customizable period length (default: 20)
- Option to use different timeframe for calculation
- Option to wait for timeframe close for more stable signals
- Customizable line color
USAGE INSTRUCTIONS:
- After adding the indicator to your chart, customize settings in the "Format" panel
- The Date Display table will appear at your chosen position on the chart
- Bar numbers will appear below price bars at your specified frequency
- The EMA line will be plotted on the chart with your chosen settings
- Colors automatically adjust to light/dark chart themes
===== 中文说明 =====
概述:
这是一个多功能指标,将三个实用工具合并为一个脚本:
1. 日期显示 - 在可自定义的表格中显示当前日期和交易品种信息
2. K线计数器 - 按指定间隔显示K线序号
3. EMA指数移动平均线 - 绘制可自定义设置的EMA线
功能特点:
1. 日期显示:
- 支持完整格式(如"Mon ∙ January 1, 2023")或简短格式(如"Mon ∙ 01.01.23")
- 可选择显示/隐藏星期几
- 可选择显示/隐藏交易品种和时间周期信息
- 可自定义表格位置(顶部/中部/底部,左侧/中间/右侧)
- 根据图表背景自动调整颜色
2. K线计数器:
- 在价格K线下方显示序号
- 可自定义显示频率(每X根K线)
- 对香港期货有特殊处理(在开市时重置)
- 根据时间周期(日线、周线、月线)使用不同的重置逻辑
- 可自定义文字大小和颜色
3. EMA指标:
- 可自定义周期长度(默认:20)
- 可选择使用不同的时间周期进行计算
- 可选择等待时间周期结束以获得更稳定的信号
- 可自定义线条颜色
使用说明:
- 将指标添加到图表后,在"格式"面板中自定义设置
- 日期显示表格将出现在您选择的图表位置
- K线序号将按您指定的频率显示在价格K线下方
- EMA线将根据您选择的设置绘制在图表上
- 颜色会根据浅色/深色图表主题自动调整
*/

Internal Bar StrengthShort Description:
This indicator calculates the Internal Bar Strength (IBS) for each bar, which measures the close price’s relative position within that bar’s high-low range, and then optionally smooths that value with a selected moving average.
What Does It Measure?
Internal Bar Strength (IBS):
The IBS formula is (close-low)/(high-low)
. This ratio indicates where the closing price lies within a bar’s trading range:
A value near 0 means the close is near the bar’s low.
A value near 1 means the close is near the bar’s high.
A value of 0.5 means the close is exactly in the middle of the bar’s range.
Smoothing (Moving Averages):
You can choose to smooth the IBS value with one of five different moving average types: RMA, SMA, EMA, WMA, or VWMA. The default length for smoothing is 10, but this can be adjusted for more or less sensitivity.
Key Features
Multiple MA Options:
RMA: Also known as the Wilder’s moving average, it reacts slightly slower to changes than EMA.
SMA: Simple moving average, straightforward average of the last n values.
EMA: Exponential moving average, places more weight on recent data.
WMA: Weighted moving average, linear weighting from oldest to newest data.
VWMA: Volume-weighted moving average, weights price by trading volume.
Color Coding:
Green when IBS is greater than 0.5.
Red when IBS is less than or equal to 0.5.

Consecutive Bars Above/Below EMA Buy the Dip Strategy█ STRATEGY DESCRIPTION
The "Consecutive Bars Above/Below EMA Buy the Dip Strategy" is a mean-reversion strategy designed to identify potential buying opportunities when the price dips below a moving average for a specified number of consecutive bars. It enters a long position when the dip condition is met and exits when the price shows strength by exceeding the previous bar's high. This strategy is suitable for use on various timeframes.
█ WHAT IS THE MOVING AVERAGE?
The strategy uses either a Simple Moving Average (SMA) or an Exponential Moving Average (EMA) as a reference for identifying dips. The type and length of the moving average can be customized in the settings.
█ SIGNAL GENERATION
1. LONG ENTRY
A Buy Signal is triggered when:
The close price is below the selected moving average for a specified number of consecutive bars (`consecutiveBarsTreshold`).
The signal occurs within the specified time window (between `Start Time` and `End Time`).
2. EXIT CONDITION
A Sell Signal is generated when the current closing price exceeds the high of the previous bar (`close > high `). This indicates that the price has shown strength, potentially confirming the reversal and prompting the strategy to exit the position.
█ ADDITIONAL SETTINGS
Consecutive Bars Threshold: The number of consecutive bars the price must remain below the moving average to trigger a Buy Signal. Default is 3.
MA Type: The type of moving average used (SMA or EMA). Default is SMA.
MA Length: The length of the moving average. Default is 5.
Start Time and End Time: The time window during which the strategy is allowed to execute trades.
█ PERFORMANCE OVERVIEW
This strategy is designed for mean-reverting markets and performs best when the price frequently oscillates around the moving average.
It is sensitive to the number of consecutive bars below the moving average, which helps to identify potential dips.
Backtesting results should be analysed to optimize the Consecutive Bars Threshold, MA Type, and MA Length for specific instruments.

Session Bar/Candle ColoringChange the color of candles within a user-defined trading session. Borders and wicks can be changed as well, not just the body color.
PREFACE
This script can be used an educational resource for those who are interested in learning Pine Script. Therefore, the script is published open source and is organized in a manner that follows the recommended Style Guide .
While the main premise of the indicator is rather simple, the script showcases various things that can be achieved such as conditional plotting, alignment of indicator settings, user input validation, script optimization, and more. The script also has examples of taking into consideration the chart timeframe and/or different chart types (Heikin Ashi, Renko, etc.) that a user might be running it on. Note: for complete beginners, I strongly suggest going through the Pine Script User Manual (possibly more than once).
FEATURES
Besides being able to select a specific time window, the indicator also provides additional color settings for changing the background color or changing the colors of neutral/indecisive candles, as shown in the image below.
This allows for a higher level of customization beyond the TradingView chart settings or other similar scripts that are currently available.
HOW TO USE
First, define the intraday trading session that will contain the candles to modify. The session can be limited to specific days of the week.
Next, select the parts of the candles that should be modified: Body, Borders, Wick, and/or Background.
For each of the candle parts that were enabled, you can select the colors that will be used depending on whether a candle is bullish (⇧), bearish (⇩), or neutral (⇆).
All other indicator settings will have a detailed tooltip to describe its usage and/or effect.
LIMITATIONS
The indicator is not intended to function on Daily or higher timeframes due to the intraday nature of session time windows.
The indicator cannot always automatically detect the chart type being used, therefore the user is requested to manually input the chart type via the " Chart Style " setting.
Depending on the available historical data and the selected choice for the " Portion of bar in session " setting, the indicator may not be able to update very old candles on the chart.
EXAMPLE USAGE
This section will show examples of different scenarios that the indicator can be used for.
Emphasizing a main trading session.
Defining a "Pre/post market hours background" like is available for some symbols (e.g., NASDAQ:AAPL ).
Highlighting in which bar the midnight candle occurs.
Hiding indecision bars (neutral candles).
Showing only "Regular Trading Hours" for a chart that does not have the option to toggle ETH/RTH. To achieve this, the actual chart data is hidden, and only the indicator is visible; alternatively, a 2nd instance of the indicator could change colors to match the chart background.
Using a combination of Bars and Japanese Candlesticks. Alternatively, this could be done by hiding the main chart data and using 2 instances of the indicator (one with " Chart Style " setting as Bars , and the other set to Candles ).
Using a combination of thin and thick bars on Range charts. Note: requires disabling the "Thin Bars" setting for Bar charts in the TradingView chart settings.
NOTES
If using more than one instance of this indicator on the same chart, you can use the TradingView "Save Indicator Template" feature to avoid having to re-configure the multiple indicators at a later time.
This indicator is intended to work "out-of-the-box" thanks to the behind_chart option introduced to Pine Script in October 2024. But you can always manually bring the indicator to the front just in case the color changes are not being seen (using the "More" option in the indicator status line: More > Visual Order > Bring to front ).
Many thanks to fikira for their help and inspiring me to create open source scripts.
Any feedback including bug reports or suggestions for improving the indicator (or source code itself) are always welcome in the comments section.

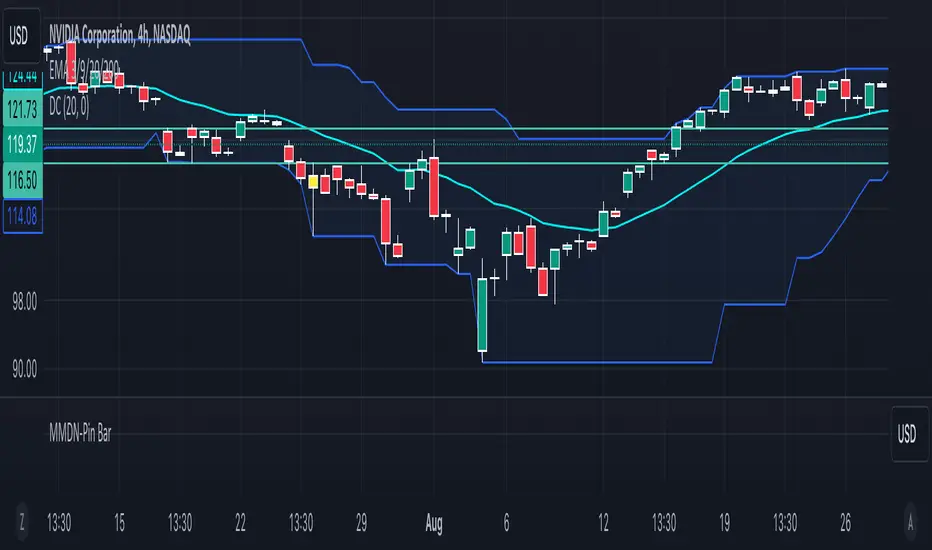
Pin Bar with Adaptive Zones and Price LevelsThis indicator is designed to simplify the identification and analysis of pin bar formations (commonly called "tail bars"), offering traders an adaptable and efficient tool for market insights. With added visual and numerical precision, it aids in spotting potential trade setups with clarity.
Key Features:
Dynamic Pin Bar Detection:
Highlights bullish pin bars with a customizable color (default: white).
Highlights bearish pin bars with a customizable color (default: yellow).
Price-Level Zones for Clarity:
Automatically draws a zone from the high to the low of each pin bar.
Displays the highest and lowest prices for the pin bar within the zone, making it easy to visualize potential entry, exit, or stop-loss levels.
Customizable Display Options:
Toggle visibility for bullish and bearish pin bars independently.
Option to enable or disable zones for a cleaner chart view.
Fully Adjustable Aesthetics:
Customize the colors, zone styles, and text display to suit your personal preferences or chart theme.
Purpose:
This indicator enhances chart analysis by combining pattern recognition with actionable visual and numerical data. By focusing on customizable zones and price levels, traders can efficiently identify key areas of interest and refine their strategies for better trade execution.
How It Adds Value:
Unique Utility: The inclusion of zones showing the pin bar's highest and lowest prices adds practical value, as traders can immediately see potential entry and exit prices without manually inspecting the bar.
Adaptable Features: With options to customize and toggle elements, the indicator caters to both minimalists and detailed-focused traders.
Precision in Trade Execution: The visual clarity provided by the zones supports more precise placement of entries, exits, and stop-losses, making it highly useful for both discretionary and systematic traders.

MMDN-Pin BarThis Pine Script code is designed to highlight Pin Bars on a TradingView chart by changing their color to yellow. A Pin Bar is a type of candlestick pattern that typically indicates a potential reversal in the market. The script uses specific conditions to identify bullish and bearish Pin Bars based on the size of the candlestick body and the length of the shadows (wicks).
1. Calculate Body and Shadows:
body: The absolute difference between the close and open prices.
upshadow: The upper shadow, calculated differently depending on whether the close is higher or lower than the open.
downshadow: The lower shadow, calculated similarly.
2. Define Pin Bar Conditions:
pinbar_h: Identifies a bullish Pin Bar if the previous candle's close is greater than its open, the previous candle's body is larger than the current candle's body, the upper shadow is more than half the size of the body, and the upper shadow is more than twice the size of the body.
pinbar_l: Identifies a bearish Pin Bar with similar conditions but for the lower shadow.
Set Pin Bar Color:
barcolor: Changes the color of the identified Pin Bars to yellow.
NEXT BAR PercentagesNEXT BAR Percentages Indicator
This Pine Script code implements the "NEXT BAR Percentages" indicator, designed to analyze and display percentage changes between consecutive bars on a TradingView chart. The script provides valuable insights into how percentage changes in price behave after significant price movements, aiding traders in identifying potential trends or reversals.
Key Features:
Percentage Change Calculations :
Close-to-Close : Calculates the percentage change between the close of the current bar and the close of the previous bar.
High-to-Close : Calculates the percentage change between the high of the current bar and the close of the previous bar.
Low-to-Close : Calculates the percentage change between the low of the current bar and the close of the previous bar.
High-to-Close (Wick) : Computes the percentage change from the close to the high of the current bar.
Low-to-Close (Wick) : Computes the percentage change from the close to the low of the current bar.
Dynamic Table Display :
Creates a table on the chart to display various statistics related to percentage changes.
The table position is customizable, with options including "Top Left," "Middle Left," "Bottom Left," "Top Right," "Middle Right," "Bottom Right," "Top Center," "Middle Center," and "Bottom Center."
Count and Average Calculations :
High POS/NEG Counts : Counts occurrences of significant positive and negative percentage changes based on user-defined thresholds.
High POS/NEG Average : Computes the average percentage change following high positive and negative percentage changes.
Next Bar Statistics : Provides statistics on the percentage change of the next bar following identified significant price movements.
Visual Indicators :
Labels : Plots arrows on the chart when a high positive or high negative percentage change is detected, visually highlighting these events.
Customizable Input Parameters :
Adjust the thresholds for identifying high positive and negative percentage changes ( highpos, highposEnd, highneg, highnegEnd ).
Specify the start date for analysis ( teststartdate ), allowing for focused period analysis.
Usage:
Traders : Gain insights into price behavior following significant movements to make informed trading decisions.
Analysis : Customizable parameters and visual indicators enable detailed analysis of price action and trend identification.
Enhance your chart analysis with this indicator for a clear, data-driven view of percentage changes and their implications for future price movements.
