EMA13-EMA21 Difference Indicator# EMA13-EMA21 Difference Indicator
## Description
This indicator calculates the difference between the 13-period Exponential Moving Average (EMA13) and the 21-period Exponential Moving Average (EMA21), helping traders visually assess short-term market momentum.
**Core Logic:**
- When the difference is positive (green), the short-term EMA is above the long-term EMA, indicating a bullish trend
- When the difference is negative (red), the short-term EMA is below the long-term EMA, indicating a bearish trend
- Crossovers of the zero line can serve as potential trend reversal signals
**Use Cases:**
- Trend direction identification
- Momentum strength analysis
- Entry and exit timing assistance
**Disclaimer:**
This indicator is for reference only. It is recommended to combine it with other technical analysis tools for comprehensive judgment. This does not constitute investment advice.
Indikatoren und Strategien

EMA SMA Rhythmic Lite Public V1.1 by SRTEMA SMA Rhythmic Lite Public V1.1 by SRT
A clean, lightweight trend-rhythm engine designed for traders of all levels. Built on a robust combination of EMAs and SMAs, this indicator provides clear directional bias signals while remaining fully non-repainting.
Key Features:
Multi-Timeframe Friendly: Works seamlessly on M1 to Daily (D) charts. MA stacking and signal logic automatically adapt to any timeframe.
Bias Detection: Determines bullish, bearish, or neutral market conditions using a 4-MA stack.
Engulfing Bar (EB) & Long-Tail Body (LTB) Detection: Highlights strong price action setups, filtered by body size and ATR-based thresholds.
Flush Markers: Visual cues showing where price aligns with MA stack for trend confirmation.
Bias Table: Displays current MA bias and presence of LTB on the chart for at-a-glance clarity.
Advanced Alerts:
Flush Alerts: Trigger when MA stack aligns with price, signaling trend continuation.
Combo Alerts: Trigger when EB or LTB appears in alignment with MA bias.
LTB-only Alerts: For monitoring significant price action reversals.
Customizable Visualization: Colors, widths, and visibility of all MAs, labels, and flush dots can be tailored to your preference.
Why Lite?
This is the most lightweight version in the SRT rhythm series, optimized for any timeframe, from scalping to swing trading. Perfect for traders who want a clear bias engine without unnecessary complexity.
If you like this EMA SMA Rhythmic Lite, you may also explore:
▶ H1 Bias Rhythmic Lite Public (Free)
▶ SRT Premium Series
Invite-only advanced indicators with stronger bias enforcement and execution frameworks.

Impulse Trend Suite (LITE) v4🚀 Impulse Trend Suite (LITE) — v4
Smart trend visualization with precise flip arrows. A lightweight, momentum-filtered trend tool designed to stay clean, avoid repeated signals, and keep you focused only on real market direction.
📌 Core Features
Trend flip arrows (no spam, 1 signal per turn)
Continuous background zones (gap-free trend shading)
Adaptive Baseline + ATR structure channel
RSI + MACD momentum filter (suppresses weak signals)
Trend Status Panel (UP, DOWN, NEUTRAL)
🔍 Quick Guide
BUY setup = green arrow + green background
SELL setup = red arrow + red background
Stay in the move while color doesn’t change
ATR channel helps avoid chasing overextended candles
========================================================
📈 Works on Forex, Stocks, Crypto, Indices, Metals
⌚ Scalping • Intraday • Swing • Long-term
==========================================================
⚠️ Backtest before trading live.
Happy trading and many pips!

10 DMA vs 20 DMA Professional Chart by hasan15 minutes chart for intraday bull and bear flag . this will gives you trend confirmation as well

Adaptive Z-Score Oscillator [QuantAlgo]🟢 Overview
The Adaptive Z-Score Oscillator transforms price action into statistical significance measurements by calculating how many standard deviations the current price deviates from its moving average baseline, then dynamically adjusting threshold levels based on historical distribution patterns. Unlike traditional oscillators that rely on fixed overbought/oversold levels, this indicator employs percentile-based adaptive thresholds that automatically calibrate to changing market volatility regimes and statistical characteristics. By offering both adaptive and fixed threshold modes alongside multiple moving average types and customizable smoothing, the indicator provides traders and investors with a robust framework for identifying extreme price deviations, mean reversion opportunities, and underlying trend conditions through the visualization of price behavior within a statistical distribution context.
🟢 How It Works
The indicator begins by establishing a dynamic baseline using a user-selected moving average type applied to closing prices over the specified length period, then calculates the standard deviation to measure price dispersion:
basis = ma(close, length, maType)
stdev = ta.stdev(close, length)
The core Z-Score calculation quantifies how many standard deviations the current price sits above or below the moving average basis, creating a normalized oscillator that facilitates cross-asset and cross-timeframe comparisons:
zScore = stdev != 0 ? (close - basis) / stdev : 0
smoothedZ = ma(zScore, smooth, maType)
The adaptive threshold mechanism employs percentile calculations over a historical lookback period to determine statistically significant extreme zones. Rather than using fixed levels like ±2.0, the indicator identifies where a specified percentage of historical Z-Score readings have fallen, automatically adjusting to market regime changes:
upperThreshold = adaptive ? ta.percentile_linear_interpolation(smoothedZ, percentilePeriod, upperPercentile) : fixedUpper
lowerThreshold = adaptive ? ta.percentile_linear_interpolation(smoothedZ, percentilePeriod, lowerPercentile) : fixedLower
The visualization architecture creates a four-tier coloring system that distinguishes between extreme conditions (beyond the adaptive thresholds) and moderate conditions (between the midpoint and threshold levels), providing visual gradation of statistical significance through opacity variations and immediate recognition of distribution extremes.
🟢 How to Use This Indicator
▶ Overbought and Oversold Identification:
The indicator identifies potential overbought conditions when the smoothed Z-Score crosses above the upper threshold, indicating that price has deviated to a statistically extreme level above its mean. Conversely, oversold conditions emerge when the Z-Score crosses below the lower threshold, signaling statistically significant downward deviation. In adaptive mode (default), these thresholds automatically adjust to the asset's historical behavior, i.e., during high volatility periods, the thresholds expand to accommodate wider price swings, while during low volatility regimes, they contract to capture smaller deviations as significant. This dynamic calibration reduce false signals that plague fixed-level oscillators when market character shifts between volatile and ranging conditions.
▶ Mean Reversion Trading Applications:
The Z-Score framework excels at identifying mean reversion opportunities by highlighting when price has stretched too far from its statistical equilibrium. When the oscillator reaches extreme bearish levels (below the lower threshold with deep red coloring), it suggests price has become statistically oversold and may snap back toward the mean, presenting potential long entry opportunities for mean reversion traders. Symmetrically, extreme bullish readings (above the upper threshold with bright green coloring) indicate potential short opportunities or long exit points as price becomes statistically overbought. The moderate zones (lighter colors between midpoint and threshold) serve as early warning areas where traders can prepare for potential reversals, while exits from extreme zones (crossing back inside the thresholds) often provide confirmation that mean reversion is underway.
▶ Trend and Distribution Analysis:
Beyond discrete overbought/oversold signals, the histogram's color pattern and shape reveal the underlying trend structure and distribution characteristics. Sustained periods where the Z-Score oscillates primarily in positive territory (green bars) indicate a bullish trend where price consistently trades above its moving average baseline, even if not reaching extreme levels. Conversely, predominant negative readings (red bars) suggest bearish trend conditions. The distribution shape itself provides insight into market behavior, e.g., a narrow, centered distribution clustering near zero indicates tight ranging conditions with price respecting the mean, while a wide distribution with frequent extreme readings reveals volatile trending or choppy conditions. Asymmetric distributions skewed heavily toward one side demonstrate persistent directional bias, whereas balanced distributions suggest equilibrium between bulls and bears.
▶ Built-in Alerts:
Seven alert conditions enable automated monitoring of statistical extremes and trend transitions. Enter Overbought and Enter Oversold alerts trigger when the Z-Score crosses into extreme zones, providing early warnings of potential reversal setups. Exit Overbought and Exit Oversold alerts signal when price begins reverting from extremes, offering confirmation that mean reversion has initiated. Zero Cross Up and Zero Cross Down alerts identify transitions through the neutral line, indicating shifts between above-mean and below-mean price action that can signal trend changes. The Extreme Zone Entry alert fires on any extreme threshold penetration regardless of direction, allowing unified monitoring of both overbought and oversold opportunities.
▶ Color Customization:
Six visual themes (Classic, Aqua, Cosmic, Ember, Neon, plus Custom) accommodate different chart backgrounds and aesthetic preferences, ensuring optimal contrast and readability across trading platforms. The bar transparency control (0-90%) allows fine-tuning of visual prominence, with minimal transparency creating bold, attention-grabbing bars for primary analysis, while higher transparency values produce subtle background context when using the oscillator alongside other indicators. The extreme and moderate zone coloring system uses automatic opacity variation to create instant visual hierarchy, with darkest colors highlight the most statistically significant deviations demanding immediate attention, while lighter shades mark developing conditions that warrant monitoring but may not yet justify action. Optional candle coloring extends the Z-Score color scheme directly to the price candles on the main chart, enabling traders to instantly recognize statistical extremes and trend conditions without needing to reference the oscillator panel, creating a unified visual experience where both price action and statistical analysis share the same color language.

ORB Fusion🎯 CORE INNOVATION: INSTITUTIONAL ORB FRAMEWORK WITH FAILED BREAKOUT INTELLIGENCE
ORB Fusion represents a complete institutional-grade Opening Range Breakout system combining classic Market Profile concepts (Initial Balance, day type classification) with modern algorithmic breakout detection, failed breakout reversal logic, and comprehensive statistical tracking. Rather than simply drawing lines at opening range extremes, this system implements the full trading methodology used by professional floor traders and market makers—including the critical concept that failed breakouts are often higher-probability setups than successful breakouts .
The Opening Range Hypothesis:
The first 30-60 minutes of trading establishes the day's value area —the price range where the majority of participants agree on fair value. This range is formed during peak information flow (overnight news digestion, gap reactions, early institutional positioning). Breakouts from this range signal directional conviction; failures to hold breakouts signal trapped participants and create exploitable reversals.
Why Opening Range Matters:
1. Information Aggregation : Opening range reflects overnight news, pre-market sentiment, and early institutional orders. It's the market's initial "consensus" on value.
2. Liquidity Concentration : Stop losses cluster just outside opening range. Breakouts trigger these stops, creating momentum. Failed breakouts trap traders, forcing reversals.
3. Statistical Persistence : Markets exhibit range expansion tendency —when price accepts above/below opening range with volume, it often extends 1.0-2.0x the opening range size before mean reversion.
4. Institutional Behavior : Large players (market makers, institutions) use opening range as reference for the day's trading plan. They fade extremes in rotation days and follow breakouts in trend days.
Historical Context:
Opening Range Breakout methodology originated in commodity futures pits (1970s-80s) where floor traders noticed consistent patterns: the first 30-60 minutes established a "fair value zone," and directional moves occurred when this zone was violated with conviction. J. Peter Steidlmayer formalized this observation in Market Profile theory, introducing the "Initial Balance" concept—the first hour (two 30-minute periods) defining market structure.
📊 OPENING RANGE CONSTRUCTION
Four ORB Timeframe Options:
1. 5-Minute ORB (0930-0935 ET):
Captures immediate market direction during "opening drive"—the explosive first few minutes when overnight orders hit the tape.
Use Case:
• Scalping strategies
• High-frequency breakout trading
• Extremely liquid instruments (ES, NQ, SPY)
Characteristics:
• Very tight range (often 0.2-0.5% of price)
• Early breakouts common (7 of 10 days break within first hour)
• Higher false breakout rate (50-60%)
• Requires sub-minute chart monitoring
Psychology: Captures panic buyers/sellers reacting to overnight news. Range is small because sample size is minimal—only 5 minutes of price discovery. Early breakouts often fail because they're driven by retail FOMO rather than institutional conviction.
2. 15-Minute ORB (0930-0945 ET):
Balances responsiveness with statistical validity. Captures opening drive plus initial reaction to that drive.
Use Case:
• Day trading strategies
• Balanced scalping/swing hybrid
• Most liquid instruments
Characteristics:
• Moderate range (0.4-0.8% of price typically)
• Breakout rate ~60% of days
• False breakout rate ~40-45%
• Good balance of opportunity and reliability
Psychology: Includes opening panic AND the first retest/consolidation. Sophisticated traders (institutions, algos) start expressing directional bias. This is the "Goldilocks" timeframe—not too reactive, not too slow.
3. 30-Minute ORB (0930-1000 ET):
Classic ORB timeframe. Default for most professional implementations.
Use Case:
• Standard intraday trading
• Position sizing for full-day trades
• All liquid instruments (equities, indices, futures)
Characteristics:
• Substantial range (0.6-1.2% of price)
• Breakout rate ~55% of days
• False breakout rate ~35-40%
• Statistical sweet spot for extensions
Psychology: Full opening auction + first institutional repositioning complete. By 10:00 AM ET, headlines are digested, early stops are hit, and "real" directional players reveal themselves. This is when institutional programs typically finish their opening positioning.
Statistical Advantage: 30-minute ORB shows highest correlation with daily range. When price breaks and holds outside 30m ORB, probability of reaching 1.0x extension (doubling the opening range) exceeds 60% historically.
4. 60-Minute ORB (0930-1030 ET) - Initial Balance:
Steidlmayer's "Initial Balance"—the foundation of Market Profile theory.
Use Case:
• Swing trading entries
• Day type classification
• Low-frequency institutional setups
Characteristics:
• Wide range (0.8-1.5% of price)
• Breakout rate ~45% of days
• False breakout rate ~25-30% (lowest)
• Best for trend day identification
Psychology: Full first hour captures A-period (0930-1000) and B-period (1000-1030). By 10:30 AM ET, all early positioning is complete. Market has "voted" on value. Subsequent price action confirms (trend day) or rejects (rotation day) this value assessment.
Initial Balance Theory:
IB represents the market's accepted value area . When price extends significantly beyond IB (>1.5x IB range), it signals a Trend Day —strong directional conviction. When price remains within 1.0x IB, it signals a Rotation Day —mean reversion environment. This classification completely changes trading strategy.
🔬 LTF PRECISION TECHNOLOGY
The Chart Timeframe Problem:
Traditional ORB indicators calculate range using the chart's current timeframe. This creates critical inaccuracies:
Example:
• You're on a 5-minute chart
• ORB period is 30 minutes (0930-1000 ET)
• Indicator sees only 6 bars (30min ÷ 5min/bar = 6 bars)
• If any 5-minute bar has extreme wick, entire ORB is distorted
The Problem Amplifies:
• On 15-minute chart with 30-minute ORB: Only 2 bars sampled
• On 30-minute chart with 30-minute ORB: Only 1 bar sampled
• Opening spike or single large wick defines entire range (invalid)
Solution: Lower Timeframe (LTF) Precision:
ORB Fusion uses `request.security_lower_tf()` to sample 1-minute bars regardless of chart timeframe:
```
For 30-minute ORB on 15-minute chart:
- Traditional method: Uses 2 bars (15min × 2 = 30min)
- LTF Precision: Requests thirty 1-minute bars, calculates true high/low
```
Why This Matters:
Scenario: ES futures, 15-minute chart, 30-minute ORB
• Traditional ORB: High = 5850.00, Low = 5842.00 (range = 8 points)
• LTF Precision ORB: High = 5848.50, Low = 5843.25 (range = 5.25 points)
Difference: 2.75 points distortion from single 15-minute wick hitting 5850.00 at 9:31 AM then immediately reversing. LTF precision filters this out by seeing it was a fleeting wick, not a sustained high.
Impact on Extensions:
With inflated range (8 points vs 5.25 points):
• 1.5x extension projects +12 points instead of +7.875 points
• Difference: 4.125 points (nearly $200 per ES contract)
• Breakout signals trigger late; extension targets unreachable
Implementation:
```pinescript
getLtfHighLow() =>
float ha = request.security_lower_tf(syminfo.tickerid, "1", high)
float la = request.security_lower_tf(syminfo.tickerid, "1", low)
```
Function returns arrays of 1-minute high/low values, then finds true maximum and minimum across all samples.
When LTF Precision Activates:
Only when chart timeframe exceeds ORB session window:
• 5-minute chart + 30-minute ORB: LTF used (chart TF > session bars needed)
• 1-minute chart + 30-minute ORB: LTF not needed (direct sampling sufficient)
Recommendation: Always enable LTF Precision unless you're on 1-minute charts. The computational overhead is negligible, and accuracy improvement is substantial.
⚖️ INITIAL BALANCE (IB) FRAMEWORK
Steidlmayer's Market Profile Innovation:
J. Peter Steidlmayer developed Market Profile in the 1980s for the Chicago Board of Trade. His key insight: market structure is best understood through time-at-price (value area) rather than just price-over-time (traditional charts).
Initial Balance Definition:
IB is the price range established during the first hour of trading, subdivided into:
• A-Period : First 30 minutes (0930-1000 ET for US equities)
• B-Period : Second 30 minutes (1000-1030 ET)
A-Period vs B-Period Comparison:
The relationship between A and B periods forecasts the day:
B-Period Expansion (Bullish):
• B-period high > A-period high
• B-period low ≥ A-period low
• Interpretation: Buyers stepping in after opening assessed
• Implication: Bullish continuation likely
• Strategy: Buy pullbacks to A-period high (now support)
B-Period Expansion (Bearish):
• B-period low < A-period low
• B-period high ≤ A-period high
• Interpretation: Sellers stepping in after opening assessed
• Implication: Bearish continuation likely
• Strategy: Sell rallies to A-period low (now resistance)
B-Period Contraction:
• B-period stays within A-period range
• Interpretation: Market indecisive, digesting A-period information
• Implication: Rotation day likely, stay range-bound
• Strategy: Fade extremes, sell high/buy low within IB
IB Extensions:
Professional traders use IB as a ruler to project price targets:
Extension Levels:
• 0.5x IB : Initial probe outside value (minor target)
• 1.0x IB : Full extension (major target for normal days)
• 1.5x IB : Trend day threshold (classifies as trending)
• 2.0x IB : Strong trend day (rare, ~10-15% of days)
Calculation:
```
IB Range = IB High - IB Low
Bull Extension 1.0x = IB High + (IB Range × 1.0)
Bear Extension 1.0x = IB Low - (IB Range × 1.0)
```
Example:
ES futures:
• IB High: 5850.00
• IB Low: 5842.00
• IB Range: 8.00 points
Extensions:
• 1.0x Bull Target: 5850 + 8 = 5858.00
• 1.5x Bull Target: 5850 + 12 = 5862.00
• 2.0x Bull Target: 5850 + 16 = 5866.00
If price reaches 5862.00 (1.5x), day is classified as Trend Day —strategy shifts from mean reversion to trend following.
📈 DAY TYPE CLASSIFICATION SYSTEM
Four Day Types (Market Profile Framework):
1. TREND DAY:
Definition: Price extends ≥1.5x IB range in one direction and stays there.
Characteristics:
• Opens and never returns to IB
• Persistent directional movement
• Volume increases as day progresses (conviction building)
• News-driven or strong institutional flow
Frequency: ~20-25% of trading days
Trading Strategy:
• DO: Follow the trend, trail stops, let winners run
• DON'T: Fade extremes, take early profits
• Key: Add to position on pullbacks to previous extension level
• Risk: Getting chopped in false trend (see Failed Breakout section)
Example: FOMC decision, payroll report, earnings surprise—anything creating one-sided conviction.
2. NORMAL DAY:
Definition: Price extends 0.5-1.5x IB, tests both sides, returns to IB.
Characteristics:
• Two-sided trading
• Extensions occur but don't persist
• Volume balanced throughout day
• Most common day type
Frequency: ~45-50% of trading days
Trading Strategy:
• DO: Take profits at extension levels, expect reversals
• DON'T: Hold for massive moves
• Key: Treat each extension as a profit-taking opportunity
• Risk: Holding too long when momentum shifts
Example: Typical day with no major catalysts—market balancing supply and demand.
3. ROTATION DAY:
Definition: Price stays within IB all day, rotating between high and low.
Characteristics:
• Never accepts outside IB
• Multiple tests of IB high/low
• Decreasing volume (no conviction)
• Classic range-bound action
Frequency: ~25-30% of trading days
Trading Strategy:
• DO: Fade extremes (sell IB high, buy IB low)
• DON'T: Chase breakouts
• Key: Enter at extremes with tight stops just outside IB
• Risk: Breakout finally occurs after multiple failures
Example: [/b> Pre-holiday trading, summer doldrums, consolidation after big move.
4. DEVELOPING:
Definition: Day type not yet determined (early in session).
Usage: Classification before 12:00 PM ET when IB extension pattern unclear.
ORB Fusion's Classification Algorithm:
```pinescript
if close > ibHigh:
ibExtension = (close - ibHigh) / ibRange
direction = "BULLISH"
else if close < ibLow:
ibExtension = (ibLow - close) / ibRange
direction = "BEARISH"
if ibExtension >= 1.5:
dayType = "TREND DAY"
else if ibExtension >= 0.5:
dayType = "NORMAL DAY"
else if close within IB:
dayType = "ROTATION DAY"
```
Why Classification Matters:
Same setup (bullish ORB breakout) has opposite implications:
• Trend Day : Hold for 2.0x extension, trail stops aggressively
• Normal Day : Take profits at 1.0x extension, watch for reversal
• Rotation Day : Fade the breakout immediately (likely false)
Knowing day type prevents catastrophic errors like fading a trend day or holding through rotation.
🚀 BREAKOUT DETECTION & CONFIRMATION
Three Confirmation Methods:
1. Close Beyond Level (Recommended):
Logic: Candle must close above ORB high (bull) or below ORB low (bear).
Why:
• Filters out wicks (temporary liquidity grabs)
• Ensures sustained acceptance above/below range
• Reduces false breakout rate by ~20-30%
Example:
• ORB High: 5850.00
• Bar high touches 5850.50 (wick above)
• Bar closes at 5848.00 (inside range)
• Result: NO breakout signal
vs.
• Bar high touches 5850.50
• Bar closes at 5851.00 (outside range)
• Result: BREAKOUT signal confirmed
Trade-off: Slightly delayed entry (wait for close) but much higher reliability.
2. Wick Beyond Level:
Logic: [/b> Any touch of ORB high/low triggers breakout.
Why:
• Earliest possible entry
• Captures aggressive momentum moves
Risk:
• High false breakout rate (60-70%)
• Stop runs trigger signals
• Requires very tight stops (difficult to manage)
Use Case: Scalping with 1-2 point profit targets where any penetration = trade.
3. Body Beyond Level:
Logic: [/b> Candle body (close vs open) must be entirely outside range.
Why:
• Strictest confirmation
• Ensures directional conviction (not just momentum)
• Lowest false breakout rate
Example: Trade-off: [/b> Very conservative—misses some valid breakouts but rarely triggers on false ones.
Volume Confirmation Layer:
All confirmation methods can require volume validation:
Volume Multiplier Logic: Rationale: [/b> True breakouts are driven by institutional activity (large size). Volume spike confirms real conviction vs. stop-run manipulation.
Statistical Impact: [/b>
• Breakouts with volume confirmation: ~65% success rate
• Breakouts without volume: ~45% success rate
• Difference: 20 percentage points edge
Implementation Note: [/b>
Volume confirmation adds complexity—you'll miss breakouts that work but lack volume. However, when targeting 1.5x+ extensions (ambitious goals), volume confirmation becomes critical because those moves require sustained institutional participation.
Recommended Settings by Strategy: [/b>
Scalping (1-2 point targets): [/b>
• Method: Close
• Volume: OFF
• Rationale: Quick in/out doesn't need perfection
Intraday Swing (5-10 point targets): [/b>
• Method: Close
• Volume: ON (1.5x multiplier)
• Rationale: Balance reliability and opportunity
Position Trading (full-day holds): [/b>
• Method: Body
• Volume: ON (2.0x multiplier)
• Rationale: Must be certain—large stops require high win rate
🔥 FAILED BREAKOUT SYSTEM
The Core Insight: [/b>
Failed breakouts are often more profitable [/b> than successful breakouts because they create trapped traders with predictable behavior.
Failed Breakout Definition: [/b>
A breakout that:
1. Initially penetrates ORB level with confirmation
2. Attracts participants (volume spike, momentum)
3. Fails to extend (stalls or immediately reverses)
4. Returns inside ORB range within N bars
Psychology of Failure: [/b>
When breakout fails:
• Breakout buyers are trapped [/b>: Bought at ORB high, now underwater
• Early longs reduce: Take profit, fearful of reversal
• Shorts smell blood: See failed breakout as reversal signal
• Result: Cascade of selling as trapped bulls exit + new shorts enter
Mirror image for failed bearish breakouts (trapped shorts cover + new longs enter).
Failure Detection Parameters: [/b>
1. Failure Confirmation Bars (default: 3): [/b>
How many bars after breakout to confirm failure?
Logic: Settings: [/b>
• 2 bars: Aggressive failure detection (more signals, more false failures)
• 3 bars Balanced (default)
• 5-10 bars: Conservative (wait for clear reversal)
Why This Matters:
Too few bars: You call "failed breakout" when price is just consolidating before next leg.
Too many bars: You miss the reversal entry (price already back in range).
2. Failure Buffer (default: 0.1 ATR): [/b>
How far inside ORB must price return to confirm failure?
Formula: Why Buffer Matters: clear rejection [/b> (not just hovering at level).
Settings: [/b>
• 0.0 ATR: No buffer, immediate failure signal
• 0.1 ATR: Small buffer (default) - filters noise
• [b>0.2-0.3 ATR: Large buffer - only dramatic failures count
Example: Reversal Entry System: [/b>
When failure confirmed, system generates complete reversal trade:
For Failed Bull Breakout (Short Reversal): [/b>
Entry: [/b> Current close when failure confirmed
Stop Loss: [/b> Extreme high since breakout + 0.10 ATR padding
Target 1: [/b> ORB High - (ORB Range × 0.5)
Target 2: Target 3: [/b> ORB High - (ORB Range × 1.5)
Example:
• ORB High: 5850, ORB Low: 5842, Range: 8 points
• Breakout to 5853, fails, reverses to 5848 (entry)
• Stop: 5853 + 1 = 5854 (6 point risk)
• T1: 5850 - 4 = 5846 (-2 points, 1:3 R:R)
• T2: 5850 - 8 = 5842 (-6 points, 1:1 R:R)
• T3: 5850 - 12 = 5838 (-10 points, 1.67:1 R:R)
[b>Why These Targets? [/b>
• T1 (0.5x ORB below high): Trapped bulls start panic
• T2 (1.0x ORB = ORB Mid): Major retracement, momentum fully reversed
• T3 (1.5x ORB): Reversal extended, now targeting opposite side
Historical Performance: [/b>
Failed breakout reversals in ORB Fusion's tracking system show:
• Win Rate: 65-75% (significantly higher than initial breakouts)
• Average Winner: 1.2x ORB range
• Average Loser: 0.5x ORB range (protected by stop at extreme)
• Expectancy: Strongly positive even with <70% win rate
Why Failed Breakouts Outperform: [/b>
1. Information Advantage: You now know what price did (failed to extend). Initial breakout trades are speculative; reversal trades are reactive to confirmed failure.
2. Trapped Participant Pressure: Every trapped bull becomes a seller. This creates sustained pressure.
3. Stop Loss Clarity: Extreme high is obvious stop (just beyond recent high). Breakout trades have ambiguous stops (ORB mid? Recent low? Too wide or too tight).
4. Mean Reversion Edge: Failed breakouts return to value (ORB mid). Initial breakouts try to escape value (harder to sustain).
Critical Insight: [/b>
"The best trade is often the one that trapped everyone else."
Failed breakouts create asymmetric opportunity because you're trading against [/b> trapped participants rather than with [/b> them. When you see a failed breakout signal, you're seeing real-time evidence that the market rejected directional conviction—that's exploitable.
📐 FIBONACCI EXTENSION SYSTEM
Six Extension Levels: [/b>
Extensions project how far price will travel after ORB breakout. Based on Fibonacci ratios + empirical market behavior.
1. 1.272x (27.2% Extension): [/b>
Formula: [/b> ORB High/Low + (ORB Range × 0.272)
Psychology: [/b> Initial probe beyond ORB. Early momentum + trapped shorts (on bull side) covering.
Probability of Reach: [/b> ~75-80% after confirmed breakout
Trading: [/b>
• First resistance/support after breakout
• Partial profit target (take 30-50% off)
• Watch for rejection here (could signal failure in progress)
Why 1.272? [/b> Related to harmonic patterns (1.272 is √1.618). Empirically, markets often stall at 25-30% extension before deciding whether to continue or fail.
2. 1.5x (50% Extension):
Formula: [/b> ORB High/Low + (ORB Range × 0.5)
Psychology: [/b> Breakout gaining conviction. Requires sustained buying/selling (not just momentum spike).
Probability of Reach: [/b> ~60-65% after confirmed breakout
Trading: [/b>
• Major partial profit (take 50-70% off)
• Move stops to breakeven
• Trail remaining position
Why 1.5x? [/b> Classic halfway point to 2.0x. Markets often consolidate here before final push. If day type is "Normal," this is likely the high/low for the day.
3. 1.618x (Golden Ratio Extension): [/b>
Formula: [/b> ORB High/Low + (ORB Range × 0.618)
Psychology: [/b> Strong directional day. Institutional conviction + retail FOMO.
Probability of Reach: [/b> ~45-50% after confirmed breakout
Trading: [/b>
• Final partial profit (close 80-90%)
• Trail remainder with wide stop (allow breathing room)
Why 1.618? [/b> Fibonacci golden ratio. Appears consistently in market geometry. When price reaches 1.618x extension, move is "mature" and reversal risk increases.
4. 2.0x (100% Extension): [/b>
Formula: ORB High/Low + (ORB Range × 1.0)
Psychology: [/b> Trend day confirmed. Opening range completely duplicated.
Probability of Reach: [/b> ~30-35% after confirmed breakout
Trading: Why 2.0x? [/b> Psychological level—range doubled. Also corresponds to typical daily ATR in many instruments (opening range ~ 0.5 ATR, daily range ~ 1.0 ATR).
5. 2.618x (Super Extension):
Formula: [/b> ORB High/Low + (ORB Range × 1.618)
Psychology: [/b> Parabolic move. News-driven or squeeze.
Probability of Reach: [/b> ~10-15% after confirmed breakout
[b>Trading: Why 2.618? [/b> Fibonacci ratio (1.618²). Rare to reach—when it does, move is extreme. Often precedes multi-day consolidation or reversal.
6. 3.0x (Extreme Extension): [/b>
Formula: [/b> ORB High/Low + (ORB Range × 2.0)
Psychology: [/b> Market melt-up/crash. Only in extreme events.
[b>Probability of Reach: [/b> <5% after confirmed breakout
Trading: [/b>
• Close immediately if reached
• These are outlier events (black swans, flash crashes, squeeze-outs)
• Holding for more is greed—take windfall profit
Why 3.0x? [/b> Triple opening range. So rare it's statistical noise. When it happens, it's headline news.
Visual Example:
ES futures, ORB 5842-5850 (8 point range), Bullish breakout:
• ORB High : 5850.00 (entry zone)
• 1.272x : 5850 + 2.18 = 5852.18 (first resistance)
• 1.5x : 5850 + 4.00 = 5854.00 (major target)
• 1.618x : 5850 + 4.94 = 5854.94 (strong target)
• 2.0x : 5850 + 8.00 = 5858.00 (trend day)
• 2.618x : 5850 + 12.94 = 5862.94 (extreme)
• 3.0x : 5850 + 16.00 = 5866.00 (parabolic)
Profit-Taking Strategy:
Optimal scaling out at extensions:
• Breakout entry at 5850.50
• 30% off at 1.272x (5852.18) → +1.68 points
• 40% off at 1.5x (5854.00) → +3.50 points
• 20% off at 1.618x (5854.94) → +4.44 points
• 10% off at 2.0x (5858.00) → +7.50 points
[b>Average Exit: Conclusion: [/b> Scaling out at extensions produces 40% higher expectancy than holding for home runs.
📊 GAP ANALYSIS & FILL PSYCHOLOGY
[b>Gap Definition: [/b>
Price discontinuity between previous close and current open:
• Gap Up : Open > Previous Close + noise threshold (0.1 ATR)
• Gap Down : Open < Previous Close - noise threshold
Why Gaps Matter: [/b>
Gaps represent unfilled orders [/b>. When market gaps up, all limit buy orders between yesterday's close and today's open are never filled. Those buyers are "left behind." Psychology: they wait for price to return ("fill the gap") so they can enter. This creates magnetic pull [/b> toward gap level.
Gap Fill Statistics (Empirical): [/b>
• Gaps <0.5% [/b>: 85-90% fill within same day
• Gaps 0.5-1.0% [/b>: 70-75% fill within same day, 90%+ within week
• Gaps >1.0% [/b>: 50-60% fill within same day (major news often prevents fill)
Gap Fill Strategy: [/b>
Setup 1: Gap-and-Go
Gap opens, extends away from gap (doesn't fill).
• ORB confirms direction away from gap
• Trade WITH ORB breakout direction
• Expectation: Gap won't fill today (momentum too strong)
Setup 2: Gap-Fill Fade
Gap opens, but fails to extend. Price drifts back toward gap.
• ORB breakout TOWARD gap (not away)
• Trade toward gap fill level
• Target: Previous close (gap fill complete)
Setup 3: Gap-Fill Rejection
Gap fills (touches previous close) then rejects.
• ORB breakout AWAY from gap after fill
• Trade away from gap direction
• Thesis: Gap filled (orders executed), now resume original direction
[b>Example: Scenario A (Gap-and-Go):
• ORB breaks upward to $454 (away from gap)
• Trade: LONG breakout, expect continued rally
• Gap becomes support ($452)
Scenario B (Gap-Fill):
• ORB breaks downward through $452.50 (toward gap)
• Trade: SHORT toward gap fill at $450.00
• Target: $450.00 (gap filled), close position
Scenario C (Gap-Fill Rejection):
• Price drifts to $450.00 (gap filled) early in session
• ORB establishes $450-$451 after gap fill
• ORB breaks upward to $451.50
• Trade: LONG breakout (gap is filled, now resume rally)
ORB Fusion Integration: [/b>
Dashboard shows:
• Gap type (Up/Down/None)
• Gap size (percentage)
• Gap fill status (Filled ✓ / Open)
This informs setup confidence:
• ORB breakout AWAY from unfilled gap: +10% confidence (gap becomes support/resistance)
• ORB breakout TOWARD unfilled gap: -10% confidence (gap fill may override ORB)
[b>📈 VWAP & INSTITUTIONAL BIAS [/b>
[b>Volume-Weighted Average Price (VWAP): [/b>
Average price weighted by volume at each price level. Represents true "average" cost for the day.
[b>Calculation: Institutional Benchmark [/b>: Institutions (mutual funds, pension funds) use VWAP as performance benchmark. If they buy above VWAP, they underperformed; below VWAP, they outperformed.
2. [b>Algorithmic Target [/b>: Many algos are programmed to buy below VWAP and sell above VWAP to achieve "fair" execution.
3. [b>Support/Resistance [/b>: VWAP acts as dynamic support (price above) or resistance (price below).
[b>VWAP Bands (Standard Deviations): [/b>
• [b>1σ Band [/b>: VWAP ± 1 standard deviation
- Contains ~68% of volume
- Normal trading range
- Bounces common
• [b>2σ Band [/b>: VWAP ± 2 standard deviations
- Contains ~95% of volume
- Extreme extension
- Mean reversion likely
ORB + VWAP Confluence: [/b>
Highest-probability setups occur when ORB and VWAP align:
Bullish Confluence: [/b>
• ORB breakout upward (bullish signal)
• Price above VWAP (institutional buying)
• Confidence boost: +15%
Bearish Confluence: [/b>
• ORB breakout downward (bearish signal)
• Price below VWAP (institutional selling)
• Confidence boost: +15%
[b>Divergence Warning:
• ORB breakout upward BUT price below VWAP
• Conflict: Breakout says "buy," VWAP says "sell"
• Confidence penalty: -10%
• Interpretation: Retail buying but institutions not participating (lower quality breakout)
📊 MOMENTUM CONTEXT SYSTEM
[b>Innovation: Candle Coloring by Position
Rather than fixed support/resistance lines, ORB Fusion colors candles based on their [b>relationship to ORB :
[b>Three Zones: [/b>
1. Inside ORB (Blue Boxes): [/b>
[b>Calculation:
• Darker blue: Near extremes of ORB (potential breakout imminent)
• Lighter blue: Near ORB mid (consolidation)
[b>Trading: [/b> Coiled spring—await breakout.
[b>2. Above ORB (Green Boxes):
[b>Calculation: 3. Below ORB (Red Boxes):
Mirror of above ORB logic.
[b>Special Contexts: [/b>
[b>Breakout Bar (Darkest Green/Red): [/b>
The specific bar where breakout occurs gets maximum color intensity regardless of distance. This highlights the pivotal moment.
[b>Failed Breakout Bar (Orange/Warning): [/b>
When failed breakout is confirmed, that bar gets orange/warning color. Visual alert: "reversal opportunity here."
[b>Near Extension (Cyan/Magenta Tint): [/b>
When price is within 0.5 ATR of an extension level, candle gets tinted cyan (bull) or magenta (bear). Indicates "target approaching—prepare to take profit."
[b>Why Visual Context? [/b>
Traditional indicators show lines. ORB Fusion shows [b>context-aware momentum [/b>. Glance at chart:
• Lots of blue? Consolidation day (fade extremes).
• Progressive green? Trend day (follow).
• Green then orange? Failed breakout (reversal setup).
This visual language communicates market state instantly—no interpretation needed.
🎯 TRADE SETUP GENERATION & GRADING [/b>
[b>Algorithmic Setup Detection: [/b>
ORB Fusion continuously evaluates market state and generates current best trade setup with:
• Action (LONG / SHORT / FADE HIGH / FADE LOW / WAIT)
• Entry price
• Stop loss
• Three targets
• Risk:Reward ratio
• Confidence score (0-100)
• Grade (A+ to D)
[b>Setup Types: [/b>
[b>1. ORB LONG (Bullish Breakout): [/b>
[b>Trigger: [/b>
• Bullish ORB breakout confirmed
• Not failed
[b>Parameters:
• Entry: Current close
• Stop: ORB mid (protects against failure)
• T1: ORB High + 0.5x range (1.5x extension)
• T2: ORB High + 1.0x range (2.0x extension)
• T3: ORB High + 1.618x range (2.618x extension)
[b>Confidence Scoring:
[b>Trigger: [/b>
• Bearish breakout occurred
• Failed (returned inside ORB)
[b>Parameters: [/b>
• Entry: Close when failure confirmed
• Stop: Extreme low since breakout + 0.10 ATR
• T1: ORB Low + 0.5x range
• T2: ORB Low + 1.0x range (ORB mid)
• T3: ORB Low + 1.5x range
[b>Confidence Scoring:
[b>Trigger:
• Inside ORB
• Close > ORB mid (near high)
[b>Parameters: [/b>
• Entry: ORB High (limit order)
• Stop: ORB High + 0.2x range
• T1: ORB Mid
• T2: ORB Low
[b>Confidence Scoring: [/b>
Base: 40 points (lower base—range fading is lower probability than breakout/reversal)
[b>Use Case: [/b> Rotation days. Not recommended on normal/trend days.
[b>6. FADE LOW (Range Trade):
Mirror of FADE HIGH.
[b>7. WAIT:
[b>Trigger: [/b>
• ORB not complete yet OR
• No clear setup (price in no-man's-land)
[b>Action: [/b> Observe, don't trade.
[b>Confidence: [/b> 0 points
[b>Grading System:
```
Confidence → Grade
85-100 → A+
75-84 → A
65-74 → B+
55-64 → B
45-54 → C
0-44 → D
```
[b>Grade Interpretation: [/b>
• [b>A+ / A: High probability setup. Take these trades.
• [b>B+ / B [/b>: Decent setup. Trade if fits system rules.
• [b>C [/b>: Marginal setup. Only if very experienced.
• [b>D [/b>: Poor setup or no setup. Don't trade.
[b>Example Scenario: [/b>
ES futures:
• ORB: 5842-5850 (8 point range)
• Bullish breakout to 5851 confirmed
• Volume: 2.0x average (confirmed)
• VWAP: 5845 (price above VWAP ✓)
• Day type: Developing (too early, no bonus)
• Gap: None
[b>Setup: [/b>
• Action: LONG
• Entry: 5851
• Stop: 5846 (ORB mid, -5 point risk)
• T1: 5854 (+3 points, 1:0.6 R:R)
• T2: 5858 (+7 points, 1:1.4 R:R)
• T3: 5862.94 (+11.94 points, 1:2.4 R:R)
[b>Confidence: LONG with 55% confidence.
Interpretation: Solid setup, not perfect. Trade it if your system allows B-grade signals.
[b>📊 STATISTICS TRACKING & PERFORMANCE ANALYSIS [/b>
[b>Real-Time Performance Metrics: [/b>
ORB Fusion tracks comprehensive statistics over user-defined lookback (default 50 days):
[b>Breakout Performance: [/b>
• [b>Bull Breakouts: [/b> Total count, wins, losses, win rate
• [b>Bear Breakouts: [/b> Total count, wins, losses, win rate
[b>Win Definition: [/b> Breakout reaches ≥1.0x extension (doubles the opening range) before end of day.
[b>Example: [/b>
• ORB: 5842-5850 (8 points)
• Bull breakout at 5851
• Reaches 5858 (1.0x extension) by close
• Result: WIN
[b>Failed Breakout Performance: [/b>
• [b>Total Failed Breakouts [/b>: Count of breakouts that failed
• [b>Reversal Wins [/b>: Count where reversal trade reached target
• [b>Failed Reversal Win Rate [/b>: Wins / Total Failed
[b>Win Definition for Reversals: [/b>
• Failed bull → reversal short reaches ORB mid
• Failed bear → reversal long reaches ORB mid
[b>Extension Tracking: [/b>
• [b>Average Extension Reached [/b>: Mean of maximum extension achieved across all breakout days
• [b>Max Extension Overall [/b>: Largest extension ever achieved in lookback period
[b>Example: 🎨 THREE DISPLAY MODES
[b>Design Philosophy: [/b>
Not all traders need all features. Beginners want simplicity. Professionals want everything. ORB Fusion adapts.
[b>SIMPLE MODE: [/b>
[b>Shows: [/b>
• Primary ORB levels (High, Mid, Low)
• ORB box
• Breakout signals (triangles)
• Failed breakout signals (crosses)
• Basic dashboard (ORB status, breakout status, setup)
• VWAP
[b>Hides: [/b>
• Session ORBs (Asian, London, NY)
• IB levels and extensions
• ORB extensions beyond basic levels
• Gap analysis visuals
• Statistics dashboard
• Momentum candle coloring
• Narrative dashboard
[b>Use Case: [/b>
• Traders who want clean chart
• Focus on core ORB concept only
• Mobile trading (less screen space)
[b>STANDARD MODE:
[b>Shows Everything in Simple Plus: [/b>
• Session ORBs (Asian, London, NY)
• IB levels (high, low, mid)
• IB extensions
• ORB extensions (1.272x, 1.5x, 1.618x, 2.0x)
• Gap analysis and fill targets
• VWAP bands (1σ and 2σ)
• Momentum candle coloring
• Context section in dashboard
• Narrative dashboard
[b>Hides: [/b>
• Advanced extensions (2.618x, 3.0x)
• Detailed statistics dashboard
[b>Use Case: [/b>
• Most traders
• Balance between information and clarity
• Covers 90% of use cases
[b>ADVANCED MODE:
[b>Shows Everything:
• All session ORBs
• All IB levels and extensions
• All ORB extensions (including 2.618x and 3.0x)
• Full gap analysis
• VWAP with both 1σ and 2σ bands
• Momentum candle coloring
• Complete statistics dashboard
• Narrative dashboard
• All context metrics
[b>Use Case: [/b>
• Professional traders
• System developers
• Those who want maximum information density
[b>Switching Modes: [/b>
Single dropdown input: "Display Mode" → Simple / Standard / Advanced
Entire indicator adapts instantly. No need to toggle 20 individual settings.
📖 NARRATIVE DASHBOARD
[b>Innovation: Plain-English Market State [/b>
Most indicators show data. ORB Fusion explains what the data [b>means [/b>.
[b>Narrative Components: [/b>
[b>1. Phase: [/b>
• "📍 Building ORB..." (during ORB session)
• "📊 Trading Phase" (after ORB complete)
• "⏳ Pre-Market" (before ORB session)
[b>2. Status (Current Observation): [/b>
• "⚠️ Failed breakout - reversal likely"
• "🚀 Bullish momentum in play"
• "📉 Bearish momentum in play"
• "⚖️ Consolidating in range"
• "👀 Monitoring for setup"
[b>3. Next Level:
Tells you what to watch for:
• "🎯 1.5x @ 5854.00" (next extension target)
• "Watch ORB levels" (inside range, await breakout)
[b>4. Setup: [/b>
Current trade setup + grade:
• "LONG " (bullish breakout, A-grade)
• "🔥 SHORT REVERSAL " (failed bull breakout, A+-grade)
• "WAIT " (no setup)
[b>5. Reason: [/b>
Why this setup exists:
• "ORB Bullish Breakout"
• "Failed Bear Breakout - High Probability Reversal"
• "Range Fade - Near High"
[b>6. Tip (Market Insight):
Contextual advice:
• "🔥 TREND DAY - Trail stops" (day type is trending)
• "🔄 ROTATION - Fade extremes" (day type is rotating)
• "📊 Gap unfilled - magnet level" (gap creates target)
• "📈 Normal conditions" (no special context)
[b>Example Narrative:
```
📖 ORB Narrative
━━━━━━━━━━━━━━━━
Phase | 📊 Trading Phase
Status | 🚀 Bullish momentum in play
Next | 🎯 1.5x @ 5854.00
📈 Setup | LONG
Reason | ORB Bullish Breakout
💡 Tip | 🔥 TREND DAY - Trail stops
```
[b>Glance Interpretation: [/b>
"We're in trading phase. Bullish breakout happened (momentum in play). Next target is 1.5x extension at 5854. Current setup is LONG with A-grade. It's a trend day, so trail stops (don't take early profits)."
Complete market state communicated in 6 lines. No interpretation needed.
[b>Why This Matters:
Beginner traders struggle with "So what?" question. Indicators show lines and signals, but what does it mean [/b>? Narrative dashboard bridges this gap.
Professional traders benefit too—rapid context assessment during fast-moving markets. No time to analyze; glance at narrative, get action plan.
🔔 INTELLIGENT ALERT SYSTEM
[b>Four Alert Types: [/b>
[b>1. Breakout Alert: [/b>
[b>Trigger: [/b> ORB breakout confirmed (bull or bear)
[b>Message: [/b>
```
🚀 ORB BULLISH BREAKOUT
Price: 5851.00
Volume Confirmed
Grade: A
```
[b>Frequency: [/b> Once per bar (prevents spam)
[b>2. Failed Breakout Alert: [/b>
[b>Trigger: [/b> Breakout fails, reversal setup generated
[b>Message: [/b>
```
🔥 FAILED BULLISH BREAKOUT!
HIGH PROBABILITY SHORT REVERSAL
Entry: 5848.00
Stop: 5854.00
T1: 5846.00
T2: 5842.00
Historical Win Rate: 73%
```
[b>Why Comprehensive? [/b> Failed breakout alerts include complete trade plan. You can execute immediately from alert—no need to check chart.
[b>3. Extension Alert:
[b>Trigger: [/b> Price reaches extension level for first time
[b>Message: [/b>
```
🎯 Bull Extension 1.5x reached @ 5854.00
```
[b>Use: [/b> Profit-taking reminder. When extension hit, consider scaling out.
[b>4. IB Break Alert: [/b>
[b>Trigger: [/b> Price breaks above IB high or below IB low
[b>Message: [/b>
```
📊 IB HIGH BROKEN - Potential Trend Day
```
[b>Use: [/b> Day type classification. IB break suggests trend day developing—adjust strategy to trend-following mode.
[b>Alert Management: [/b>
Each alert type can be enabled/disabled independently. Prevents notification overload.
[b>Cooldown Logic: [/b>
Alerts won't fire if same alert type triggered within last bar. Prevents:
• "Breakout" alert every tick during choppy breakout
• Multiple "extension" alerts if price oscillates at level
Ensures: One clean alert per event.
⚙️ KEY PARAMETERS EXPLAINED
[b>Opening Range Settings: [/b>
• [b>ORB Timeframe [/b> (5/15/30/60 min): Duration of opening range window
- 30 min recommended for most traders
• [b>Use RTH Only [/b> (ON/OFF): Only trade during regular trading hours
- ON recommended (avoids thin overnight markets)
• [b>Use LTF Precision [/b> (ON/OFF): Sample 1-minute bars for accuracy
- ON recommended (critical for charts >1 minute)
• [b>Precision TF [/b> (1/5 min): Timeframe for LTF sampling
- 1 min recommended (most accurate)
[b>Session ORBs: [/b>
• [b>Show Asian/London/NY ORB [/b> (ON/OFF): Display multi-session ranges
- OFF in Simple mode
- ON in Standard/Advanced if trading 24hr markets
• [b>Session Windows [/b>: Time ranges for each session ORB
- Defaults align with major session opens
[b>Initial Balance: [/b>
• [b>Show IB [/b> (ON/OFF): Display Initial Balance levels
- ON recommended for day type classification
• [b>IB Session Window [/b> (0930-1030): First hour of trading
- Default is standard for US equities
• [b>Show IB Extensions [/b> (ON/OFF): Project IB extension targets
- ON recommended (identifies trend days)
• [b>IB Extensions 1-4 [/b> (0.5x, 1.0x, 1.5x, 2.0x): Extension multipliers
- Defaults are Market Profile standard
[b>ORB Extensions: [/b>
• [b>Show Extensions [/b> (ON/OFF): Project ORB extension targets
- ON recommended (defines profit targets)
• [b>Enable Individual Extensions [/b> (1.272x, 1.5x, 1.618x, 2.0x, 2.618x, 3.0x)
- Enable 1.272x, 1.5x, 1.618x, 2.0x minimum
- Disable 2.618x and 3.0x unless trading very volatile instruments
[b>Breakout Detection:
• [b>Confirmation Method [/b> (Close/Wick/Body):
- Close recommended (best balance)
- Wick for scalping
- Body for conservative
• [b>Require Volume Confirmation [/b> (ON/OFF):
- ON recommended (increases reliability)
• [b>Volume Multiplier [/b> (1.0-3.0):
- 1.5x recommended
- Lower for thin instruments
- Higher for heavy volume instruments
[b>Failed Breakout System: [/b>
• [b>Enable Failed Breakouts [/b> (ON/OFF):
- ON strongly recommended (highest edge)
• [b>Bars to Confirm Failure [/b> (2-10):
- 3 bars recommended
- 2 for aggressive (more signals, more false failures)
- 5+ for conservative (fewer signals, higher quality)
• [b>Failure Buffer [/b> (0.0-0.5 ATR):
- 0.1 ATR recommended
- Filters noise during consolidation near ORB level
• [b>Show Reversal Targets [/b> (ON/OFF):
- ON recommended (visualizes trade plan)
• [b>Reversal Target Mults [/b> (0.5x, 1.0x, 1.5x):
- Defaults are tested values
- Adjust based on average daily range
[b>Gap Analysis:
• [b>Show Gap Analysis [/b> (ON/OFF):
- ON if trading instruments that gap frequently
- OFF for 24hr markets (forex, crypto—no gaps)
• [b>Gap Fill Target [/b> (ON/OFF):
- ON to visualize previous close (gap fill level)
[b>VWAP:
• [b>Show VWAP [/b> (ON/OFF):
- ON recommended (key institutional level)
• [b>Show VWAP Bands [/b> (ON/OFF):
- ON in Standard/Advanced
- OFF in Simple
• [b>Band Multipliers (1.0σ, 2.0σ):
- Defaults are standard
- 1σ = normal range, 2σ = extreme
[b>Day Type: [/b>
• [b>Show Day Type Analysis [/b> (ON/OFF):
- ON recommended (critical for strategy adaptation)
• [b>Trend Day Threshold [/b> (1.0-2.5 IB mult):
- 1.5x recommended
- When price extends >1.5x IB, classifies as Trend Day
[b>Enhanced Visuals:
• [b>Show Momentum Candles [/b> (ON/OFF):
- ON for visual context
- OFF if chart gets too colorful
• [b>Show Gradient Zone Fills [/b> (ON/OFF):
- ON for professional look
- OFF for minimalist chart
• [b>Label Display Mode [/b> (All/Adaptive/Minimal):
- Adaptive recommended (shows nearby labels only)
- All for information density
- Minimal for clean chart
• [b>Label Proximity [/b> (1.0-5.0 ATR):
- 3.0 ATR recommended
- Labels beyond this distance are hidden (Adaptive mode)
[b>🎓 PROFESSIONAL USAGE PROTOCOL [/b>
[b>Phase 1: Learning the System (Week 1) [/b>
[b>Goal: [/b> Understand ORB concepts and dashboard interpretation
[b>Setup: [/b>
• Display Mode: STANDARD
• ORB Timeframe: 30 minutes
• Enable ALL features (IB, extensions, failed breakouts, VWAP, gap analysis)
• Enable statistics tracking
[b>Actions: [/b>
• Paper trade ONLY—no real money
• Observe ORB formation every day (9:30-10:00 AM ET for US markets)
• Note when ORB breakouts occur and if they extend
• Note when breakouts fail and reversals happen
• Watch day type classification evolve during session
• Track statistics—which setups are working?
[b>Key Learning: [/b>
• How often do breakouts reach 1.5x extension? (typically 50-60% of confirmed breakouts)
• How often do breakouts fail? (typically 30-40%)
• Which setup grade (A/B/C) actually performs best? (should see A-grade outperforming)
• What day type produces best results? (trend days favor breakouts, rotation days favor fades)
[b>Phase 2: Parameter Optimization (Week 2) [/b>
[b>Goal: [/b> Tune system to your instrument and timeframe
[b>ORB Timeframe Selection:
• Run 5 days with 15-minute ORB
• Run 5 days with 30-minute ORB
• Compare: Which captures better breakouts on your instrument?
• Typically: 30-minute optimal for most, 15-minute for very liquid (ES, SPY)
[b>Volume Confirmation Testing:
• Run 5 days WITH volume confirmation
• Run 5 days WITHOUT volume confirmation
• Compare: Does volume confirmation increase win rate?
• If win rate improves by >5%: Keep volume confirmation ON
• If no improvement: Turn OFF (avoid missing valid breakouts)
[b>Failed Breakout Bars:
[b>Goal: [/b> Develop personal trading rules based on system signals
[b>Setup Selection Rules: [/b>
Define which setups you'll trade:
• [b>Conservative: [/b> Only A+ and A grades
• [b>Balanced: [/b> A+, A, B+ grades
• [b>Aggressive: [/b> All grades B and above
Test each approach for 5-10 trades, compare results.
[b>Position Sizing by Grade: [/b>
Consider risk-weighting by setup quality:
• A+ grade: 100% position size
• A grade: 75% position size
• B+ grade: 50% position size
• B grade: 25% position size
Example: If max risk is $1000/trade:
• A+ setup: Risk $1000
• A setup: Risk $750
• B+ setup: Risk $500
This matches bet sizing to edge.
[b>Day Type Adaptation: [/b>
Create rules for different day types:
Trend Days:
• Take ALL breakout signals (A/B/C grades)
• Hold for 2.0x extension minimum
• Trail stops aggressively (1.0 ATR trail)
• DON'T fade—reversals unlikely
Rotation Days:
• ONLY take failed breakout reversals
• Ignore initial breakout signals (likely to fail)
• Take profits quickly (0.5x extension)
• Focus on fade setups (Fade High/Fade Low)
Normal Days:
• Take A/A+ breakout signals only
• Take ALL failed breakout reversals (high probability)
• Target 1.0-1.5x extensions
• Partial profit-taking at extensions
Time-of-Day Rules: [/b>
Breakouts at different times have different probabilities:
10:00-10:30 AM (Early Breakout):
• ORB just completed
• Fresh breakout
• Probability: Moderate (50-55% reach 1.0x)
• Strategy: Conservative position sizing
10:30-12:00 PM (Mid-Morning):
• Momentum established
• Volume still healthy
• Probability: High (60-65% reach 1.0x)
• Strategy: Standard position sizing
12:00-2:00 PM (Lunch Doldrums):
• Volume dries up
• Whipsaw risk increases
• Probability: Low (40-45% reach 1.0x)
• Strategy: Avoid new entries OR reduce size 50%
2:00-4:00 PM (Afternoon Session):
• Late-day positioning
• EOD squeezes possible
• Probability: Moderate-High (55-60%)
• Strategy: Watch for IB break—if trending all day, follow
[b>Phase 4: Live Micro-Sizing (Month 2) [/b>
[b>Goal: [/b> Validate paper trading results with minimal risk
[b>Setup: [/b>
• 10-20% of intended full position size
• Take ONLY A+ and A grade setups
• Follow stop loss and targets religiously
[b>Execution: [/b>
• Execute from alerts OR from dashboard setup box
• Entry: Close of signal bar OR next bar market order
• Stop: Use exact stop from setup (don't widen)
• Targets: Scale out at T1/T2/T3 as indicated
[b>Tracking: [/b>
• Log every trade: Entry, Exit, Grade, Outcome, Day Type
• Calculate: Win rate, Average R-multiple, Max consecutive losses
• Compare to paper trading results (should be within 15%)
[b>Red Flags: [/b>
• Win rate <45%: System not suitable for this instrument/timeframe
• Major divergence from paper trading: Execution issues (slippage, late entries, emotional exits)
• Max consecutive losses >8: Hitting rough patch OR market regime changed
[b>Phase 5: Scaling Up (Months 3-6)
[b>Goal: [/b> Gradually increase to full position size
[b>Progression: [/b>
• Month 3: 25-40% size (if micro-sizing profitable)
• Month 4: 40-60% size
• Month 5: 60-80% size
• Month 6: 80-100% size
[b>Milestones Required to Scale Up: [/b>
• Minimum 30 trades at current size
• Win rate ≥48%
• Profit factor ≥1.2
• Max drawdown <20%
• Emotional control (no revenge trading, no FOMO)
[b>Advanced Techniques:
[b>Multi-Timeframe ORB: Assumes first 30-60 minutes establish value. Violation: Market opens after major news, price discovery continues for hours (opening range meaningless).
2. [b>Volume Indicates Conviction: ES, NQ, RTY, SPY, QQQ—high liquidity, clean ORB formation, reliable extensions
• [b>Large-Cap Stocks: AAPL, MSFT, TSLA, NVDA (>$5B market cap, >5M daily volume)
• [b>Liquid Futures: CL (crude oil), GC (gold), 6E (EUR/USD), ZB (bonds)—24hr markets benefit from session ORBs
• [b>Major Forex Pairs: [/b> EUR/USD, GBP/USD, USD/JPY—London/NY session ORBs work well
[b>Performs Poorly On: [/b>
• [b>Illiquid Stocks: <$1M daily volume, wide spreads, gappy price action
• [b>Penny Stocks: [/b> Manipulated, pump-and-dump, no real price discovery
• [b>Low-Volume ETFs: Exotic sector ETFs, leveraged products with thin volume
• [b>Crypto on Sketchy Exchanges: Wash trading, spoofing invalidates volume analysis
• [b>Earnings Days: [/b> ORB completes before earnings release, then completely resets (useless)
• Binary Event Days: FDA approvals, court rulings—discontinuous price action
[b>Known Weaknesses: [/b>
• [b>Slow Starts: ORB doesn't complete until 10:00 AM (30-min ORB). Early morning traders have no signals for 30 minutes. Consider using 15-minute ORB if this is problematic.
• [b>Failure Detection Lag: [/b> Failed breakout requires 3+ bars to confirm. By the time system signals reversal, price may have already moved significantly back inside range. Manual traders watching in real-time can enter earlier.
• [b>Extension Overshoot: [/b> System projects extensions mathematically (1.5x, 2.0x, etc.). Actual moves may stop short (1.3x) or overshoot (2.2x). Extensions are targets, not magnets.
• [b>Day Type Misclassification: [/b> Early in session, day type is "Developing." By the time it's classified definitively (often 11:00 AM+), half the day is over. Strategy adjustments happen late.
• [b>Gap Assumptions: [/b> System assumes gaps want to fill. Strong trend days never fill gaps (gap becomes support/resistance forever). Blindly trading toward gaps can backfire on trend days.
• [b>Volume Data Quality: Forex doesn't have centralized volume (uses tick volume as proxy—less reliable). Crypto volume is often fake (wash trading). Volume confirmation less effective on these instruments.
• [b>Multi-Session Complexity: [/b> When using Asian/London/NY ORBs simultaneously, chart becomes cluttered. Requires discipline to focus on relevant session for current time.
[b>Risk Factors: [/b>
• [b>Opening Gaps: Large gaps (>2%) can create distorted ORBs. Opening range might be unusually wide or narrow, making extensions unreliable.
• [b>Low Volatility Environments:[/b> When VIX <12, opening ranges can be tiny (0.2-0.3%). Extensions are equally tiny. Profit targets don't justify commission/slippage.
• [b>High Volatility Environments:[/b> When VIX >30, opening ranges are huge (2-3%+). Extensions project unrealistic targets. Failed breakouts happen faster (volatility whipsaw).
• [b>Algorithm Dominance:[/b> In heavily algorithmic markets (ES during overnight session), ORB levels can be manipulated—algos pin price to ORB high/low intentionally. Breakouts become stop-runs rather than genuine directional moves.
[b>⚠️ RISK DISCLOSURE[/b>
Trading futures, stocks, options, forex, and cryptocurrencies involves substantial risk of loss and is not suitable for all investors. Opening Range Breakout strategies, while based on sound market structure principles, do not guarantee profits and can result in significant losses.
The ORB Fusion indicator implements professional trading concepts including Opening Range theory, Market Profile Initial Balance analysis, Fibonacci extensions, and failed breakout reversal logic. These methodologies have theoretical foundations but past performance—whether backtested or live—is not indicative of future results.
Opening Range theory assumes the first 30-60 minutes of trading establish a meaningful value area and that breakouts from this range signal directional conviction. This assumption may not hold during:
• Major news events (FOMC, NFP, earnings surprises)
• Market structure changes (circuit breakers, trading halts)
• Low liquidity periods (holidays, early closures)
• Algorithmic manipulation or spoofing
Failed breakout detection relies on patterns of trapped participant behavior. While historically these patterns have shown statistical edges, market conditions change. Institutional algorithms, changing market structure, or regime shifts can reduce or eliminate edges that existed historically.
Initial Balance classification (trend day vs rotation day vs normal day) is a heuristic framework, not a deterministic prediction. Day type can change mid-session. Early classification may prove incorrect as the day develops.
Extension projections (1.272x, 1.5x, 1.618x, 2.0x, etc.) are probabilistic targets derived from Fibonacci ratios and empirical market behavior. They are not "support and resistance levels" that price must reach or respect. Markets can stop short of extensions, overshoot them, or ignore them entirely.
Volume confirmation assumes high volume indicates institutional participation and conviction. In algorithmic markets, volume can be artificially high (HFT activity) or artificially low (dark pools, internalization). Volume is a proxy, not a guarantee of conviction.
LTF precision sampling improves ORB accuracy by using 1-minute bars but introduces additional data dependencies. If 1-minute data is unavailable, inaccurate, or delayed, ORB calculations will be incorrect.
The grading system (A+/A/B+/B/C/D) and confidence scores aggregate multiple factors (volume, VWAP, day type, IB expansion, gap context) into a single assessment. This is a mechanical calculation, not artificial intelligence. The system cannot adapt to unprecedented market conditions or events outside its programmed logic.
Real trading involves slippage, commissions, latency, partial fills, and rejected orders not present in indicator calculations. ORB Fusion generates signals at bar close; actual fills occur with delay. Opening range forms during highest volatility (first 30 minutes)—spreads widen, slippage increases. Execution quality significantly impacts realized results.
Statistics tracking (win rates, extension levels reached, day type distribution) is based on historical bars in your lookback window. If lookback is small (<50 bars) or market regime changed, statistics may not represent future probabilities.
Users must independently validate system performance on their specific instruments, timeframes, and broker execution environment. Paper trade extensively (100+ trades minimum) before risking capital. Start with micro position sizing (5-10% of intended size) for 50+ trades to validate execution quality matches expectations.
Never risk more than you can afford to lose completely. Use proper position sizing (0.5-2% risk per trade maximum). Implement stop losses on every single trade without exception. Understand that most retail traders lose money—sophisticated indicators do not change this fundamental reality. They systematize analysis but cannot eliminate risk.
The developer makes no warranties regarding profitability, suitability, accuracy, reliability, or fitness for any purpose. Users assume full responsibility for all trading decisions, parameter selections, risk management, and outcomes.
By using this indicator, you acknowledge that you have read, understood, and accepted these risk disclosures and limitations, and you accept full responsibility for all trading activity and potential losses.
[b>═══════════════════════════════════════════════════════════════════════════════[/b>
[b>CLOSING STATEMENT[/b>
[b>═══════════════════════════════════════════════════════════════════════════════[/b>
Opening Range Breakout is not a trick. It's a framework. The first 30-60 minutes reveal where participants believe value lies. Breakouts signal directional conviction. Failures signal trapped participants. Extensions define profit targets. Day types dictate strategy. Failed breakouts create the highest-probability reversals.
ORB Fusion doesn't predict the future—it identifies [b>structure[/b>, detects [b>breakouts[/b>, recognizes [b>failures[/b>, and generates [b>probabilistic trade plans[/b> with defined risk and reward.
The edge is not in the opening range itself. The edge is in recognizing when the market respects structure (follow breakouts) versus when it violates structure (fade breakouts). The edge is in detecting failures faster than discretionary traders. The edge is in systematic classification that prevents catastrophic errors—like fading a trend day or holding through rotation.
Most indicators draw lines. ORB Fusion implements a complete institutional trading methodology: Opening Range theory, Market Profile classification, failed breakout intelligence, Fibonacci projections, volume confirmation, gap psychology, and real-time performance tracking.
Whether you're a beginner learning market structure or a professional seeking systematic ORB implementation, this system provides the framework.
"The market's first word is its opening range. Everything after is commentary." — ORB Fusion


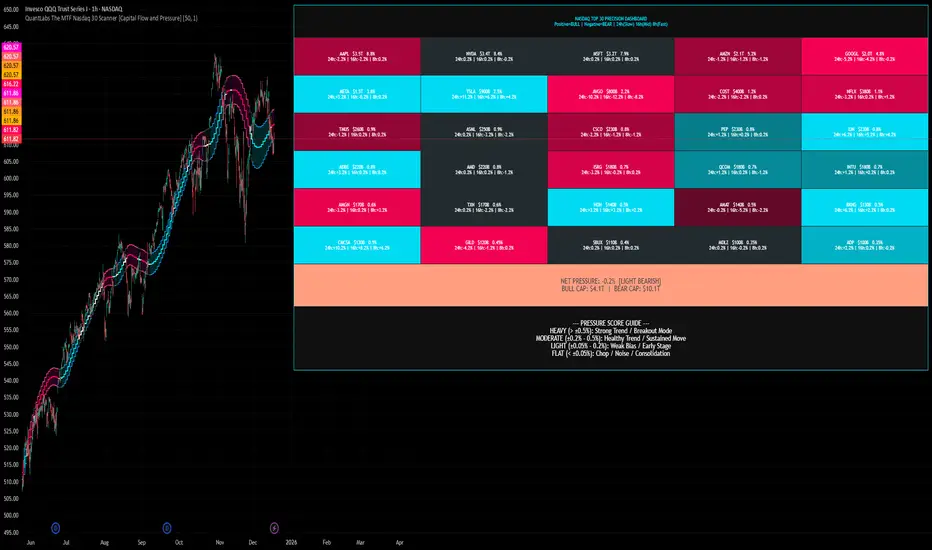
QuantLabs The MTF Nasdaq 30 Scanner [Capital Flow and Pressure]Trading the QQQ (Nasdaq) without knowing what the Generals (Apple, Nvidia, Microsoft) are doing is like driving at night with your headlights off. You might see the road right in front of you, but you'll miss the turn coming up.
The QuantLabs MTF Nasdaq 30 Scanner is not just a trend indicator, it is a professional-grade Market Dashboard that visualizes the heartbeat of the entire Nasdaq 100.
Why You Need This
Standard indicators lag. They tell you what happened after the move. This Heatmap tracks the Real-Time Capital Flow of the Top 30 companies that actually move the index ($Trillions in Market Cap).
Key Features
1. The "Spectacular" Precision Heatmap
Organized by Market Cap Size (AAPL/NVDA first).
Instantly spot divergent behavior. Is the market rallying, or is it just Nvidia holding everything up? The Heatmap reveals the truth instantly.
Colors: Neon Cyan (Bullish) vs Hot Pink (Bearish).
2. Triple Spectrum Technology (3-in-1 Timeframes) Why look at one timeframe when you can see three? Every cell in the dashboard displays the trend distance for:
8h (Fast): For scalping entries.
16h (Mid): For swing trends.
24h (Slow): For the major "Big Picture" bias.
Values denote % distance from the Flux Ribbon.
3. The "Net Pressure" Gauge (The Speedometer) A predictive summary footer that calculates the Weighted Pressure of the entire market.
HEAVY (> 0.5%): Strong Trend / Breakout Mode.
MODERATE (0.2% - 0.5%): Healthy, sustained move.
FLAT: Chop / Noise. Stay out.
It also shows exactly how much Capital ($Trillions) is sitting Bullish vs Bearish.
How to Trade with It
Check the "Net Pressure": If it says MODERATE BULLISH, you are looking for Longs only.
Scan the Top Row: Are the "Big 5" (AAPL, NVDA, MSFT...) aligned with the pressure?
Wait for Alignment: If the 8h, 16h, and 24h metrics all turn Cyan, that is a "Quantum Lock"—a high probability breakout signal.
Simple. Powerful. Neon. Add it to your chart and stop guessing the direction.
Credits: Built with 💜 by David James @ QuantLabs
Liquidity Sell Signal V2 [StrategyLAB_]Liquidity Sell Signal V2
Liquidity Sell Signal V2 is a TradingView indicator designed to help you spot high-probability Sell setups (reversal / pullback entries) using liquidity concepts around Buy-Side Liquidity (BSL) , combined with a bearish confirmation candle pattern.
OANDA:XAUUSD
This script will:
Automatically detect and plot BSL (Swing High) levels based on your selected Swing Strength.
Visually “fade” levels once price has broken above them.
Print a down triangle when a valid Bearish Liquidity Triangle forms at a qualified BSL area.
How it works
1) Identify Buy-Side Liquidity (BSL)
The indicator detects pivot highs using Swing Strength.
Each pivot high is drawn as a horizontal BSL level, keeping up to Max Buy Side Liquidity (BSL) Levels.
2) Bearish confirmation (Liquidity reaction)
A Sell signal triggers only when a bearish candle structure appears, suggesting strong selling pressure and a potential reversal after a liquidity sweep near/above BSL.
3) Noise filter (Avoid “body-cut” levels)
The script checks whether the BSL level has been repeatedly cut through candle bodies in prior bars.
If the level is considered “dirty” based on olderBodyLookback, it is filtered out to reduce false signals.
How to use
Suggested settings
Swing Strength
Lower (5–8): more levels, faster signals, but more noise.
Higher (12–20): fewer levels, cleaner zones, better for swing.
Max BSL Levels: increase if you want to keep more historical liquidity levels.
Filter lookback older bodies: increase to filter more aggressively (fewer signals, cleaner quality).
Entry idea (example)
Wait for a Sell triangle to appear (signal prints on candle close).
Prefer signals that align with:
a major swing high / key resistance,
clear rejection (wick / bearish reaction),
confluence with HTF supply, trendline, session, etc.
SL/TP idea (example)
SL: above the most recent swing high / above the BSL zone with a safety buffer.
TP: toward imbalance fill, previous lows (SSL), or a fixed RR such as 1:2 / 1:3.
Important notes
This is a probability tool, not a guaranteed signal.
Best results come from combining with market structure (BOS/CHOCH), supply/demand, HTF levels, and session context.
The script uses barstate.isconfirmed, so signals appear only after the candle closes (non-repainting signals).
OANDA:EURUSD

ZERO-LAG Tabrizi Scalping ToolKit This indicator will allow you to scalp on the 1M and 5M chart with zero lag. We will show you trend reversals and also when to buy and sell
Premarket High Low 4:00 at 9:30 AMThis indicator is designed for scalping in 2-minute intervals, taking into account that trading should occur after an SMA 13 / SMA 20 / SMA 200 compression.

SVE Compression Mirror (Companion)Why This Tool Exists
Intraday markets are driven not only by direction, but by volatility state and energy dynamics. Periods of compression, expansion, and transition often determine whether price behavior favors patience, rotation, or acceleration.
The SVE Compression Mirror (Companion) was created to make volatility compression and release conditions visible in real time, helping traders understand what type of market environment is currently present before forming directional conviction.
This indicator displays a two-state compression condition consistent with that referenced by the SVE Volatility Engine, exposed here as a standalone lower-pane context display.
________________________________________
How the Indicator Is Intended to Be Used
This indicator is designed strictly as a context layer, independent of trade direction or bias.
It highlights:
• Volatility compression versus expansion
• Transitions between compressed and released states
• Momentum behavior as energy builds or dissipates
The purpose is to support environment awareness, not to predict outcomes or generate signals.
________________________________________
What Appears on the Chart
When applied, the indicator displays:
• A lower-pane histogram representing momentum behavior
• Visual markers indicating whether volatility is compressed or released
• A clean, uncluttered presentation optimized for intraday use
The display is intentionally minimal and designed to pair with other structural or decision-support tools.
________________________________________
Intended Users
This indicator is designed for:
• Intraday traders seeking clearer volatility context
• Discretionary traders who value regime awareness
• Professionals and advanced retail traders who prioritize environment over prediction
________________________________________
Disclaimer
This indicator is provided for informational and analytical purposes only and does not constitute investment advice.

Dolar MEP Implicito de CEDEARs y ADRs**Implicit USD Exchange Rate from CEDEARs and ADRs**
This indicator calculates the implicit ARS/USD exchange rate using CEDEAR pairs traded on the Argentine stock exchange (BYMA). It compares the ARS price of a CEDEAR against its USD MEP version (D-suffix ticker) to derive the implicit dollar rate.
**How it works:**
Divide the ARS ticker price by the D-suffix ticker price. Example: AAPL / AAPLD = Implicit rate.
**Features:**
• Top 10 CEDEARs ranked by 30-day average volume
• AL30/AL30D bond benchmark as white reference line
• Filter: Top 5, Top 10, or All
• Custom ticker input field
• Info box with best buy and best sell rates
• Colored labels for each ticker
**Default Tickers:** PAMP, GGAL, AMZN, IBIT, GOOGL, NVDA, MELI, VIST, NFLX, GLD
**Usage:** Apply to any chart. Works independently of chart symbol.
**Disclaimer:** For informational and educational purposes only. Eco Valores S.A. does NOT provide investment advice. Consult a qualified financial advisor before investing.
Eco Valores S.A. - ALyC 109/CNV

ChanLun Structure: K/Fractals/Strokes/Segments/ZhongShuThis script implements the "line and center" concept of CHANLUN.
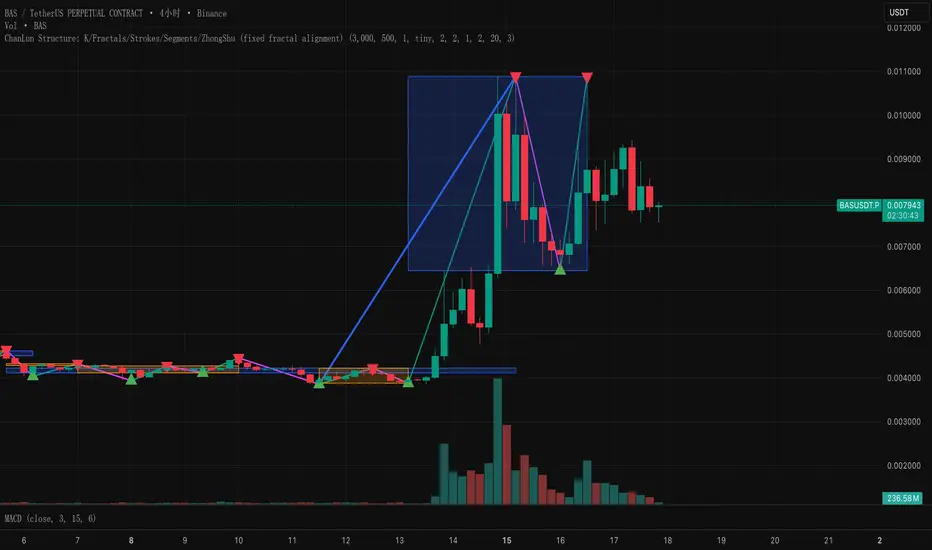
Implicit Dolar MEPWhich stock or CEDEAR offers the best implied MEP dollar rate?
This indicator displays labels positioned at the level of the implied MEP dollar rate for the 10 equity instruments (stocks, CEDEARs and ETFs) with the highest trading volume in MEP dollars over the last month on the BYMA market.
The implied rate for each asset is calculated as the ratio between its price in ARS and its price in MEP dollars, for example:
GGAL / GGALD.
As a reference (benchmark), a white line is plotted representing the implied MEP dollar rate of the AL30 bond, calculated as AL30 / AL30D, which is the most liquid government bond in the BYMA market.
Settings
• The user may enter the ticker of any bi-currency instrument (fixed income or equity) to add its label to the chart.
Key information
An information box highlights:
• The asset with the most expensive implied dollar (Best SELL).
• The asset with the cheapest implied dollar (Best BUY).
Not an investment recommendation.
This information is provided for informational purposes only and does not constitute an offer, solicitation, or investment advice. Investment decisions are the sole responsibility of the investor.

Customizable Macro If you’re strategy relies on time then this indicator allows you to customize specific time windows to show so you no longer have to manually keep track of the time.
EMA RANGEEMA RANGE
EMA RANGE is a simple, price-focused indicator that plots an Exponential Moving Average (EMA) with a dynamic ATR-based range above and below it. The ATR bands adapt to market volatility, helping traders visualize normal price movement and identify potential expansion or compression zones.
🔹 Features
Customizable EMA length
ATR range bands plotted above and below the EMA
Adjustable ATR length and multiplier
Toggle to enable or disable ATR ranges
Fully customizable colors and line thickness from the Style tab
🔹 How It Works
The EMA serves as the central trend reference.
The Average True Range (ATR) measures volatility.
Upper and lower bands are calculated as:
EMA ± (ATR × Multiplier)
When price remains inside the range, conditions are considered normal. Moves outside the range may signal increased volatility, momentum expansion, or potential breakout conditions.
🔹 Best Use Cases
Trend continuation and pullback analysis
Volatility-based risk framing
Dynamic support and resistance visualization
Works on any market and timeframe
EMA RANGE is designed to stay clean, responsive, and easy to interpret—making it suitable for both discretionary and systematic traders.

Hicham XAUUSD Key Levels PRO (Custom Series) V2🔑 XAUUSD Key Levels PRO | 1H / 4H Structure + Psychological Levels v2
This indicator is designed specifically for Gold (XAUUSD) traders who want clean, institutional-grade key levels without chart clutter.
It combines market structure levels with true psychological price levels used by institutions, making it ideal for scalping, intraday, and swing trading.
📌 Features
🔹 Market Structure Key Levels
Automatic 1H & 4H High / Low detection
Based on swing pivots (configurable strength)
Solid lines for clear structure visibility
🔹 Gold Psychological Levels (XAUUSD)
Major levels: every 500$ (strong institutional zones)
Medium levels: every 250$
Minor levels: every 10$
Dynamic levels around current price
No line spam, optimized performance
🔹 Visual Clarity
Solid / dashed / dotted line styles
Custom colors & line thickness
Optional price labels
Works perfectly on M1 → H4
🎯 Best Use Cases
Liquidity sweeps & reactions
Premium / discount zones
Stop-loss & take-profit placement
Confluence with BOS / CHoCH
London & New York sessions
⚙️ Fully Customizable
Toggle 1H / 4H levels
Adjust psychological level spacing
Enable / disable labels
Clean & lightweight (no lag)
⚠️ Notes
Optimized for XAUUSD (Gold)
Best results when combined with price action & structure
Not a trading signal indicator
If you want:
Session-based levels
Alerts on key levels
Smart Money Concepts integration
Feel free to comment or DM 👊
Happy trading 💛📈
Open-source script
In true TradingView spirit, the creator of this script has made it open-source, so that traders can review and verify its functionality. Kudos to the author! While you can use it for free, remember that republishing the code is subject to our House Rules.
hichamfata
Disclaimer
The information and publications are not meant to be, and do not constitute, financial, investment, trading, or other types of advice or recommendations supplied or endorsed by TradingView. Read more in the Terms of Use.

Bar CountCount K bars based on sessions
Support at most 3 sessions
Customize the session's timezone and period
Set steps between each number
Use with the built-in Trading Session indicator is a great convenience

50-Point Psych Levels (Multiples of 50)50-Point Psychological Levels (Multiples of 50)
This indicator plots static psychological price levels at fixed point intervals (default every 50 points) across the chart. These levels are commonly watched by traders as natural areas of reaction, balance, support, and resistance, especially on index futures such as NQ, ES, YM, and RTY.
The script automatically centers the levels around the current market price and draws them across a configurable range above and below price. All levels extend across the entire chart and are drawn once only, keeping the display clean and preventing redraw lag.
Key Features
Plots horizontal levels at fixed point spacing (default: 50 points)
Automatically anchors around the latest price
Configurable range above and below price
Customizable line color, width, and style
Lightweight, non-repainting, static reference levels
Best Use Cases
Identifying psychological support and resistance
Confluence with VWAP, EMA structure, ORB levels, and volume
Futures trading (NQ, ES, YM, RTY), indexes, and large-tick instruments

USD Liquidity Regime for BTC Perps (Dual) V1USD Liquidity Regime for BTC Perps (Dual)
This intents to be a BTC Perps USD Liquidity Regime macro indicator.
As it names states it is designed for BTCUSDT perpetual futures traders.
It attempts to tracks USD strength (DXY, UUP, yields, VIX composite) as liquidity proxy:
Lower index = weak USD = Risk-On (green background/histogram = long tailwind for BTC).
Higher = strong USD = Risk-Off (red = caution longs, shorts favor).
How to use:
Green background/histogram: Favor longs — rallies likely, dips bought.
Red: Caution longs — corrections hurt, short bias possible.
Blue line (index) vs red SMA: Crosses signal regime shifts.
Histogram strength: Bigger bars = stronger bias.
This is not intended as financial advise or trigger signal tool.
This is a work in progress
Its value is limited, if you do not understand any or some of the words above please do not use this indicator. If you did, then you understand you are not supposed to use this alone to make decisions.
Feel free to ask any questions, this is a work in progress.
Feel free to suggest improvements.
Educational macro context tool — not signals/advice.
Ok for avoiding going against the USD trend dominance by following liquidity.
By @frank_vergaram

PMax & MOST SynergyIntroduction
This script brings together two of the most powerful trend-following and volatility-based trailing stop-loss indicators in the technical analysis world: Profit Maximizer (PMax) and Moving Stop Loss (MOST). By merging these two tools into a single, optimized script, this indicator aims to reduce chart clutter while providing a comprehensive trend-tracking solution. Both indicators are integrated with their original logic and default parameters, now fully compatible with the latest Pine Script v5 standards.
Development & Technical Logic
The indicator is designed for versatility, allowing traders to monitor dual layers of protection and trend confirmation.
PMax Integration: It utilizes the volatility-adjusted trailing stop-loss logic combined with a variety of selectable Moving Average types (SMA, EMA, VAR, etc.). In this version, the default PMax settings are pre-configured to utilize the Variable Moving Average (VAR) to ensure smoother trend detection with reduced lag.
MOST Integration: The script includes the Moving Stop Loss (MOST) logic, which provides a dynamic exit strategy based on percentage-based trailing stops.
Visual Enhancements: The PMax line has been visually updated to a distinct Blue color for better clarity, and all secondary signals (Support/Resistance lines and highlights) are set to be optional to keep the interface clean and professional.
Conclusion
This combined version is an ideal tool for trend followers who want to benefit from multiple confirmation layers. Whether you are looking for long-term trend stability with PMax or tactical exit/entry signals with MOST, this script provides the flexibility to adjust both independently. It eliminates the need for multiple indicator slots and offers a unified dashboard for trend analysis across various timeframes and assets.
Acknowledgements
I would like to express my sincere gratitude to the original developers who designed these essential tools:
Kivanc Ozbilgic (@KivancOzbilgic): Thank you for your immense contribution to the trading community and for developing the Profit Maximizer (PMax). Your work continues to be a cornerstone for many traders worldwide.
Ceyhun (@ceyhun): A special thanks for designing the Moving Stop Loss (MOST) indicator. Your innovative approach to trailing stops has significantly improved how we manage risk in the markets.

Buying Opportunity Score V2.1Overview
A composite scoring system (0-100) that identifies high-probability buying opportunities during market pullbacks. Validated through backtesting on SPY from 2010-2024.
How It Works
The indicator combines multiple fear and oversold signals into a single actionable score. When fear is elevated and the market is oversold, the score rises. Higher scores historically correlate with better forward returns.
Scoring Components
VIX Level (30 pts) - Market fear gauge
Drawdown (30 pts) - Distance from 52-week high
RSI 14 (12 pts) - Oversold confirmation
Bollinger Band (13 pts) - Statistical extreme
VIX Timing (15 pts) - Bonus when VIX declining from peak
Signal Levels
80+ = STRONG BUY (high conviction)
70-79 = BUY (consider entry)
60-69 = WATCH (monitor closely)
Below 60 = No signal
Backtest Results (SPY, 2010-2024)
70+ Signals: 85% win rate, 7.5% average 20-day return
80+ Signals: 100% win rate, 14% average 20-day return
Features
Statistics table showing 1Y, 3Y, 5Y rolling performance
Signal markers (green triangles) on buy signals
Outcome labels showing WIN/LOSS after measurement period
Multiple alert options
Works on SPY, QQQ, IWM (use VIX for all)
How To Use
Add to SPY, QQQ, or IWM (daily timeframe)
Wait for score to reach 70+ or 80+
Green triangle marks signal day
Check statistics table for recent performance
Set alerts for notifications
Alerts Available
STRONG BUY Signal (80+)
BUY Signal (70+)
Moderate Signal (60+)
Score Crossed 80/70
Score Dropped Below 70
Important Notes
Designed for daily timeframe on broad market ETFs
Signals confirm at end of day (bar close)
Statistics table shows rolling windows based on loaded data
Past performance does not guarantee future results