TMB LevelsDescription:
Improved "Hourly Midline" indicator. It displays high, middle and low levels of every candle with specified timeframe (can be hourly, daily, or any other timeframe). You can change the source for the levels (either high and low of candle, or open and close of candle). Additionally, you can turn on the "Line chart", which essentially connects every midline, making a line chart of middle prices.
Parameters:
- Timeframe -> use data from this timeframe ("30" would mean 30 minutes, "60" would mean 1 hour, etc.)
- Source -> source for calculating the middle level
- Top -> parameters of the top level lines
- Middle -> parameters of the middle level lines
- Bottom -> parameters of the bottom level lines
- Line chart -> connect every midline, making a line chart
Levels

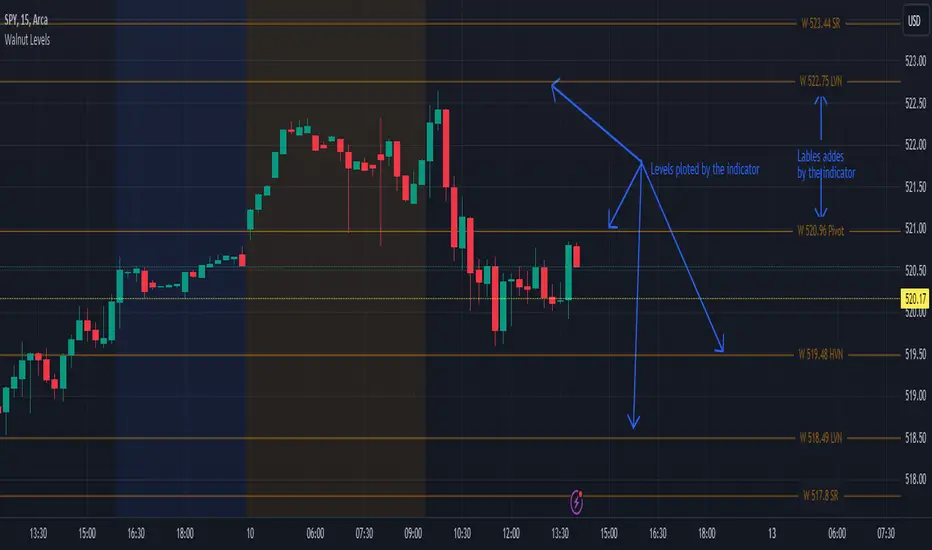
Walnut LevelsThis indicator was specifically designed to plot levels published by Walnut on SPY and ES charts. In the indicator's configuration settings, you are required to input the desired levels in the following format: (Description), (Description), (Description), .... Additionally, you have the option to configure whether to display labels and if those labels should include the numeric value of the level or just the description.
Moreover, the indicator allows customization of both color and line style via configuration settings. This flexibility enables users to tailor the appearance of the plotted levels according to their preferences. If there are no levels to plot, a message will be displayed indicating so.
Overall, the indicator streamlines the process of incorporating Walnut's published levels into trading analysis on SPY and ES charts, offering enhanced visualization and customization options to suit individual trading strategies.
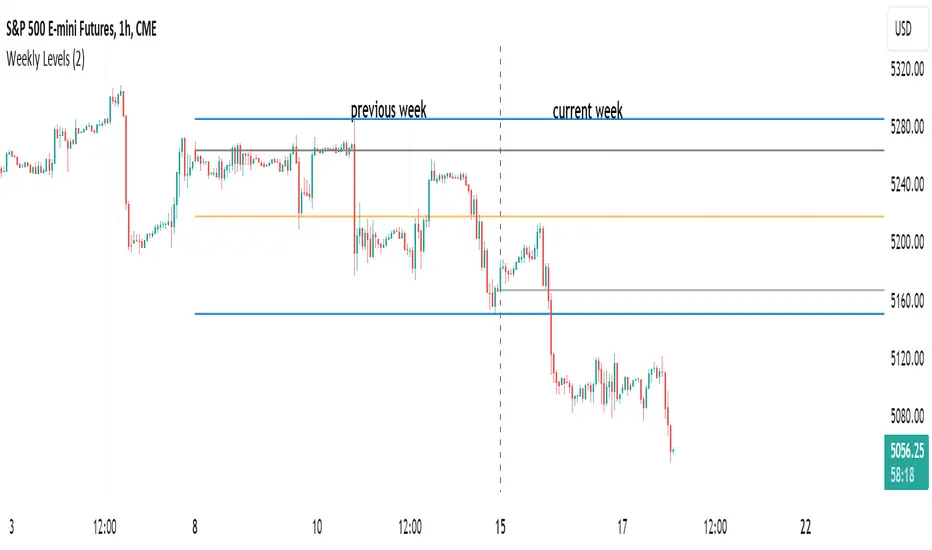
HT: Weekly LevelsIndicator draws several most important weekly levels on the lower timeframe: last week high/low, halfback, week close and current week open. These levels often act as support/resistance for price movements. Also, they can help to assess week character and control of power.
Indicator can be used on any timeframe, lower than weekly, for any type of instrument, including futures. It also provides an option to draw levels for any selected week back in time.
Important notes:
• Levels for the last week are drawn after the new week opens.
• Half-back is calculated as a middle line between week High and Low.
Parameters:
Date – user can select date, belonging to week, for which levels will be plotted. Works only if “Use” check box is on. Otherwise, levels will be plotted for the last week. (“time” value doesn’t matter; unfortunately, there is no way to hide the input box)
Time zone – your chart time zone (as UTC offset). Only needed if you use “Date” parameter.
Visuals – controls visibility and colors
Script is published as an open source. It uses two libraries: Levels Lib and Functions Lib. First one demonstrates how to work with pine-script object model and arrays. You can also reuse it in your custom scripts where there is need to construct any support/resistance levels. The second library contains some useful functions for working with time and dates.
Disclaimer
This indicator should not be used as a standalone tool to make trading decisions but only in conjunction with other technical analysis methods.
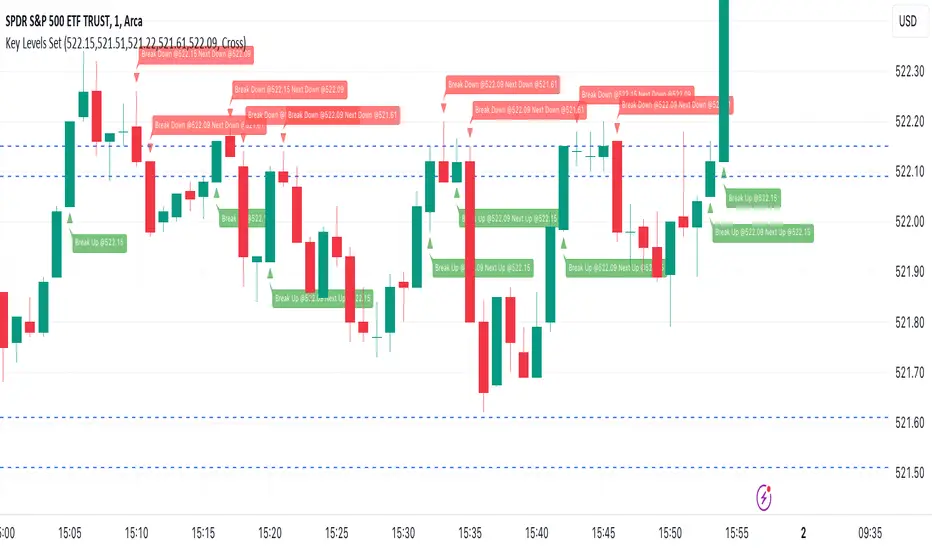
Key Levels SetKey Levels Set allows to set key levels as comma separated values, and to detect breaks to the downside and/or upside, taking into account potential gaps between bars.
This indicator can be very handy if you, like me, rely on some key levels that you identified as potential support/resistance from some technical analysis.
Features
+ It allows for key levels to be set as comma separated values.
+ It draws key levels on chart.
+ On close, it identifies highest key level that has been broken to the upside, if any.
+ On close, it identifies lowest key level that has been broken to the downside, if any.
+ In Cross mode, as bar is printing, it also detects highest/lowest key levels being broken to the upside/downside between bar high and low, if any.
+ It plots and labels breaks with current level and next level information.
+ It includes alerts from breaks on close.
+ It includes turn on/off functionality.
Settings
+ {Prices} checkbox: turns on/off entire functionality
+ {Prices} text field: comma separated values for key levels
+ {Breaks on} checkbox: turns on/off breaks detection functionality
+ {Breaks on} options: selects Close or Cross mode
[UST] Protein+Support/Resistance Script: A Comprehensive Overview
Thanks to Pmgjiv for providing the foundation to this improved Version.
In the world of trading, having a robust support and resistance analysis tool can make a significant difference in decision-making and overall strategy. Let's delve into the enhancements made to the support/resistance script and how each component contributes to a trader's arsenal:
Changes and improvements made for the script to help Traders make better rational decisions in their Trading:
1. Multiple Timeframes:
Integrating multiple timeframes into the analysis provides a multi-dimensional view of the market. Traders can now assess price action across different time horizons simultaneously. This feature allows for a deeper understanding of market dynamics and helps in identifying significant support and resistance levels across various timeframes.
2. Timeframe Labels Inside Zones:
By including timeframe labels within the zones, traders can easily identify the origin of each support or resistance level. This contextual information enhances clarity and facilitates more informed decision-making, especially when navigating through multiple timeframes.
3. Visual Zone Update:
Visual updates on zones enable traders to track changes in support and resistance levels in real-time. This dynamic feature enhances the analytical process by providing immediate insights into evolving market conditions, thereby enabling traders to adapt their strategies accordingly.
4. Zones Hit:
Understanding the frequency and intensity of zone hits offers valuable insights into the strength and relevance of support and resistance levels. Traders can gauge the significance of each zone based on its historical interaction with price, thereby gaining a deeper understanding of market sentiment and potential trading opportunities.
5. Option to Turn off Current Timeframe:
The ability to toggle off the current timeframe streamlines chart analysis by focusing only on the most critical support and resistance zones. This decluttering feature helps traders prioritize key levels, reducing cognitive overload and enhancing decision-making efficiency.
Explanation of Additional Functions:
a. Lookback:
The 'lookback' parameter allows traders to customize the age of support and resistance zones based on their trading style and preferences. By adjusting the lookback setting, traders can choose whether to prioritize recent price action or consider historical data, thus tailoring the analysis to their specific trading strategies.
b. Swinglength:
Swinglength determines the sensitivity of the support and resistance zones. By modifying this parameter, traders can control how aggressively the script identifies pivot points. A higher swinglength value results in smoother, more stable zones, whereas a lower value increases sensitivity, capturing smaller price movements.
c. ZigZag Indicator:
The ZigZag indicator plays a pivotal role in identifying significant price reversals. Its period setting determines the number of price bars considered before confirming a pivot point. Traders can utilize this indicator to identify key turning points in the market, aiding in the identification of robust support and resistance levels.
Impact of Sensitivity on Zones:
Adjusting the sensitivity of the ZigZag indicator directly influences the identification and delineation of support and resistance zones. Higher sensitivity levels result in fewer but more robust zones, capturing significant price movements. Conversely, lower sensitivity levels yield more zones, accommodating smaller price fluctuations but potentially introducing noise into the analysis.
d. S/R Range:
The ability to adjust the width of support and resistance zones allows traders to customize the breadth of key areas on a chart. Choosing a wider range encompasses a broader spectrum of prices, thereby identifying more comprehensive support and resistance levels. This flexibility enables traders to adapt their analysis to different market conditions and trading strategies.
Utilization in Trading:
Comprehensive Analysis: By incorporating multiple timeframes, traders gain a holistic view of market dynamics, enabling them to identify high-probability trading opportunities across various horizons.
Contextual Understanding: Timeframe labels within zones provide context, helping traders understand the significance of each level in relation to different timeframes and market conditions.
Real-time Adaptability: Visual zone updates facilitate real-time analysis, allowing traders to adjust their strategies promptly in response to changing market conditions.
Informed Decision-making: By considering zone hits, traders can assess the strength and relevance of support and resistance levels, enhancing their ability to make informed trading decisions.
Customized Analysis: Adjustable parameters such as lookback, swinglength, and sensitivity empower traders to tailor the analysis to their individual trading styles and preferences, enhancing precision and effectiveness.
In summary, these enhancements to the support/resistance script provide traders with a powerful toolkit for analyzing market dynamics, identifying key levels, and executing well-informed trading strategies across various timeframes and market conditions.

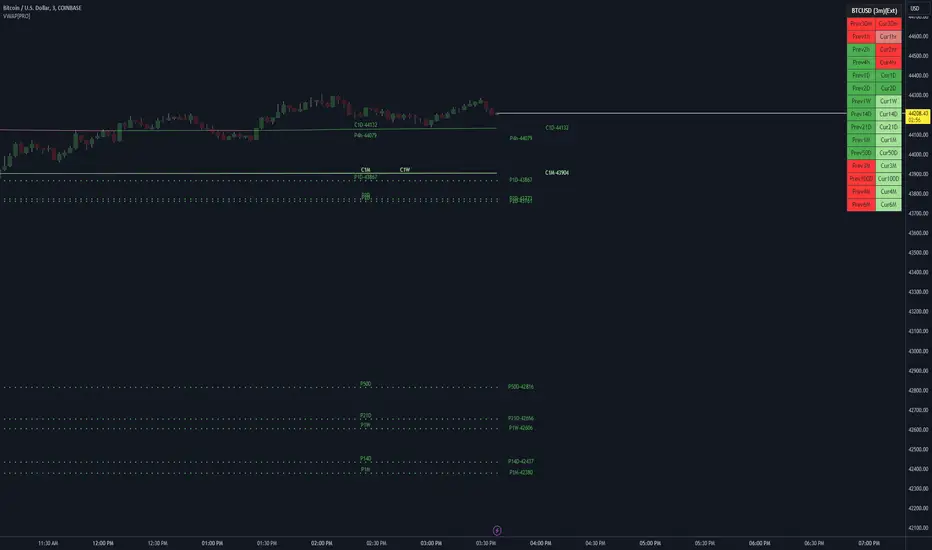
Multi Pivot (S/R) & Previous Period (OHLC)█ Multi Pivot (Support/Resistance) & Previous Period (Open/High/Low/Close)
The previous script was deleted because of a copyrighted word.
From JayRogers description.
█ Multi Pivot Selector
Allows you to set up to 3 distinct sets of pivots, each with their own resolution settings and the ability to select how many support|resistance levels are shown.
The maximum amount of S|R levels available varies with different pivot types, the options available are:
Traditional
Fibonacci
Woodie
Classic
Copyrighted word
Camarilla
Fibonacci Extended
█ Previous Period Levels
A simple but highly customisable display of previous higher time-frame OHLC values.
Customised resolution input which excludes time frames lower than 1 hour while extending the common higher reference inputs.
This script is based on JayRogers script, I only added some features so please check out his script.
I added the timeframe in the labels, in order to make it easier to differentiate when using multiple pivot set.
As well as making it possible to change the lines color of each pivot set separately.
Labels can now be displayed on each side (right, left and both) or just disabled.
The type of pivot can be shown on the right side.
Lines extension can be disabled and lines width value can be changed.
I also added another one of his script to display OHLC levels, I made similar changes.
Converted to Pine Script v5.
Previous Period Levels - X Alerts
Pivotal - Multi Pivot Selector (which was also deleted because of the copyrighted word)

HT: Intraday LevelsIndicator draws several most important intraday levels: last day RTH high/low, ETH high/low, Half Back, Day Close and current day RTH Day Open. These levels often act as support/resistance for intraday price movements. Also, they can help to assess day character and control of power.
Indicator can be used for ETH + RTH sessions.
Important notes:
• User must specify RTH session time, appropriate for his time zone and exchange
• Half-back is calculated as a middle line between RTH High and Low.
• Day Close is always equal to close of the last bar of the previous day
• RTH Day Open will be redrawn for the current day as soon as it is known (after RTH session opens and at least one bar gets confirmed).
Known issues:
• Day open will not be shown if there is no bar, clearly corresponding to RTH open time (e.g. if 4h timeframe is selected)
• For some ETH sessions it is not possible to determine session’s last bar (this is pine script limitation) until next day trading starts. This means that daily levels will be also update with only then.
Parameters:
Date – user can select date, for which levels will be plotted. Works only if “Use” check box is on. Otherwise, levels will be plotted for the last day. (“time” value doesn’t matter; unfortunately, there is no way to hide the input box)
RTH Open/Close time – it is important to specify time, appropriate for your time zone.
Time zone – your chart time zone (as UTC offset)
Visuals – controls visibility and colors
Script is published as an open source. It uses two libraries: Levels Lib and Functions Lib. First one demonstrates how to work with pine-script object model and arrays. You can also reuse it in your custom scripts where there is need to construct any support/resistance levels. The second library contains some useful functions for working with time and dates.
Disclaimer
This indicator should not be used as a standalone tool to make trading decisions but only in conjunction with other technical analysis methods.

HT: Levels LibLibrary "Levels"
method initialize(id)
Namespace types: levels_collection
Parameters:
id (levels_collection)
method create_level(id, name, value, level_start_bar, level_color, show)
Namespace types: levels_collection
Parameters:
id (levels_collection)
name (string)
value (float)
level_start_bar (int)
level_color (color)
show (bool)
method set_level(id, name, value, level_start_bar, show)
Namespace types: levels_collection
Parameters:
id (levels_collection)
name (string)
value (float)
level_start_bar (int)
show (bool)
method find_resistance(id)
Namespace types: levels_collection
Parameters:
id (levels_collection)
method find_support(id)
Namespace types: levels_collection
Parameters:
id (levels_collection)
method draw_level(id)
Namespace types: level_info
Parameters:
id (level_info)
method draw_all_levels(id)
Namespace types: levels_collection
Parameters:
id (levels_collection)
level_info
Fields:
name (series__string)
value (series__float)
bar_num (series__integer)
level_line (series__line)
line_start_bar (series__integer)
level_color (series__color)
show (series__bool)
ss (series__bool)
sr (series__bool)
levels_collection
Fields:
levels (array__|level_info|#OBJ)

GG - LevelsThe GG Levels indicator is a tool designed for day trading U.S. equity futures. It highlights key levels intraday, overnight, intermediate-swing levels that are relevant for intraday futures trading.
Terminology
RTH (Regular Trading Hours): Represents the New York session from 09:30 to 17:00 EST.
ON Session (Overnight Session): Represents the trading activity from 17:00 to 09:29 EST.
IB (Initial Balance): The first hour of the New York session, from 09:30 to 10:30 EST.
Open: The opening price of the RTH session.
YH (Yesterday's High): The highest price during the RTH session of the previous day.
YL (Yesterday's Low): The lowest price during the RTH session of the previous day.
YC (Yesterday's Close): The daily bar close which for futures gets updated to settlement.
IBH (Initial Balance High): The highest price during the IB session.
IBL (Initial Balance Low): The lowest price during the IB session.
ONH (Overnight High): The highest price during the ON session.
ONL (Overnight Low): The lowest price during the ON session.
VWAP (Volume-Weighted Average Price): The volume-weighted average price that resets each day.
Why is RTH Important?
Tracking the RTH session is important because often times the overnight session can be filled with "lies". It is thought that because the overnight session is lower volume price can be pushed or "manipulated" to extremes that would not happen during higher volume times.
Why is the ON Session Important Then?
Just because the ON session can be thought as a "lie" doesn't mean it is relevant to know. For example, if price is stuck inside the ON range then you can think of the market as rotational or range-bound. If price is above the ON range then it can be thought of as bullish. If price is below the ON range then it can be thought as bearish.
What is IB?
IB or initial balance is the first hour of the New York Session. Typically the market sets the tone for the day in the first hour. This tone is similarly a map like the ON session. If we are above the IBH then it is bullish and likely a trend day to the upside. If we are below the IBL then it is bearish and likely a trend day to the downside. If we are in IB then we want to avoid conducting business in the middle of IBH and IBL to avoid getting chopped up in a range bound market.
These levels are not a holy grail
You should use this indicator as guide or map for context about the instrument you are trading. You need to combine your own technical analysis with this indicator. You want as much context confirming your trade thesis in order to enter a trade. Simply buying or selling because we are above or below a level is not recommended in any circumstance. If it were that easy I would not publish this indicator.
Adjustments
In the indicator settings you can adjust the RTH, ON, and IB session-time settings. All of the times entered must be in EST (Eastern Standard Time). You may want to do this to apply the levels to a foreign market.
Examples

Blockunity Level Presets (BLP)A simple tool for setting performance targets.
Level Presets (BLP) is a simple tool for setting upside and downside levels relative to the current price of any asset. In this way, you can track which price the asset needs to move towards in order to achieve a defined performance.
How to Use
This indicator is very easy to use, you can set up to 5 upward and downward targets in the parameters.
Elements
The main elements of this tool are upward (default green) and downward (default red) levels.
Settings
Several parameters can be defined in the indicator configuration.
In addition to configuring which performance value to set the level at, you can choose not to display it if you don't need it. For example, here we display only two levels:
You can also choose not to display the labels:
Also concerning labels, you can choose not to display them in currency format, but in numerical format only (for example, if you're viewing a non-USD pair, such as ETHBTC):
Finally, you can modify design elements such as colors, level widths and text size:
How it Works
Here's how upside (_u) and downside (_d) levels are calculated:
source = close
level_1_u = source + (source * (level_1 / 100))
level_1_d = math.max(source - (source * (level_1 / 100)), 0)

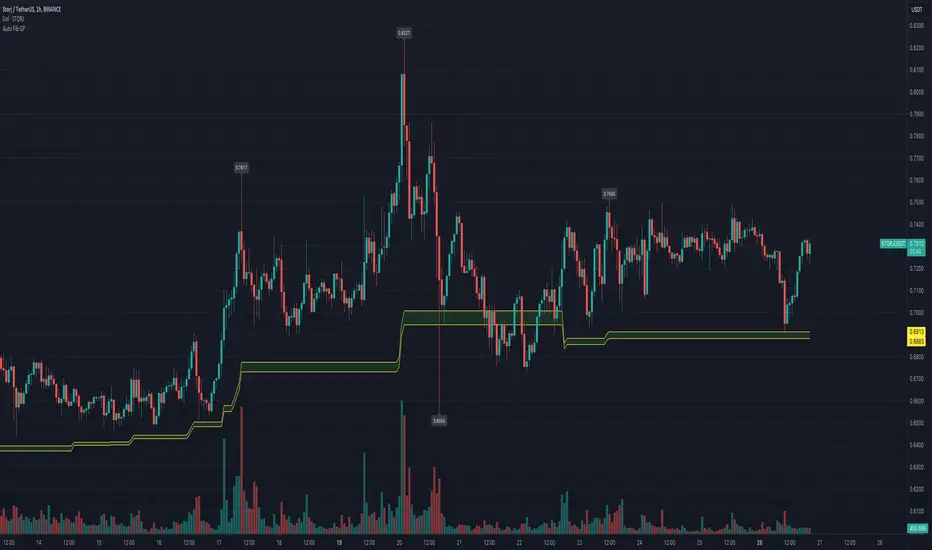
Automatic Fibonacci Retracement Golden Pocket (GP)Main info
This script automatically draws you the Fibonacci retracement level called golden pocket from the latest detected pivot point to the actual price. This level is very popular among traders because the price tends to reverse on this level pretty often. You should use this on higher timeframes 15m+.
It is good to keep in mind that this level alone is not enough, you should still have another level there to enter the trade, for example golden pocket in combination with a demand zone is pretty solid. :)
Settings
The length for pivot point calculation is available in the script settings.
You can enable inverted golden pocket (for shorts)
You can hide/show the pivot point labels
If you want any updates, just feel free to write me :)
Session Levels Predictor [LuxAlgo]The "Session Levels Predictor" indicator predicts the maximum/minimum levels that will be made within a user-specified session. Hit rate percentages are displayed to measure how often a specific level has been hit.
🔶 USAGE
The indicator can be used to estimate the expected maximum/minimum levels within a specified session, these are directly displayed at the start of a session. This operation can be useful to set take profits/stop losses levels when we expect to exit within a specific session.
Users can display up to 3 upper and lower extremities on their chart (by default only 2 upper and lower extremities are displayed), with their distance from the session opening price being determined by the user-set percentile setting, values closer to 100 will return levels farther away from the session opening price.
Predicting maximum/minimum levels effectively allows obtaining support/resistance levels for the user-defined session, with a breakout probability indicating how easy it can be for the price to reach the estimated levels. These levels can be extended outside the specified session, allowing to test their relevancy as support/resistance levels to prices outside the specified sessions.
🔶 DETAILS
To predict maximum/minimum levels made within a session we keep a record of the distance between a session's maximum/minimum value and the session opening price (opening price when the session starts).
By using the percentile_nearest_rank() on our recorded distances we draw levels from the session opening price. If a level is hit between 2 sessions, this is saved for further calculations.
Lastly, a % hit rate of these levels is shown at the sessions open, indicating the probability that these levels could be hit before the next session.
🔹 array.percentile_nearest_rank()
Returns the value for which the specified percentage of array values (percentile) is less than or equal to it, using the nearest-rank method.
For example, taking the 75th percentile from our recorded distances between the maximum session level and session opening price will return a new distance where 75% of the recorded distances are lower.
The same goes for the green session's open - low levels
🔶 SETTINGS
Session: User-defined session interval, uses the symbol timezone.
Percentile (1, 2, 3): K-th percentile used to estimate session max/min levels, higher values will return more distant levels.
Max Population: Maximum amount of recorded distance data for the calculation of percentiles.
🔹 Style
Extend Middle Line: Toggle to extend the blue Middle Line to the next session - Default disabled

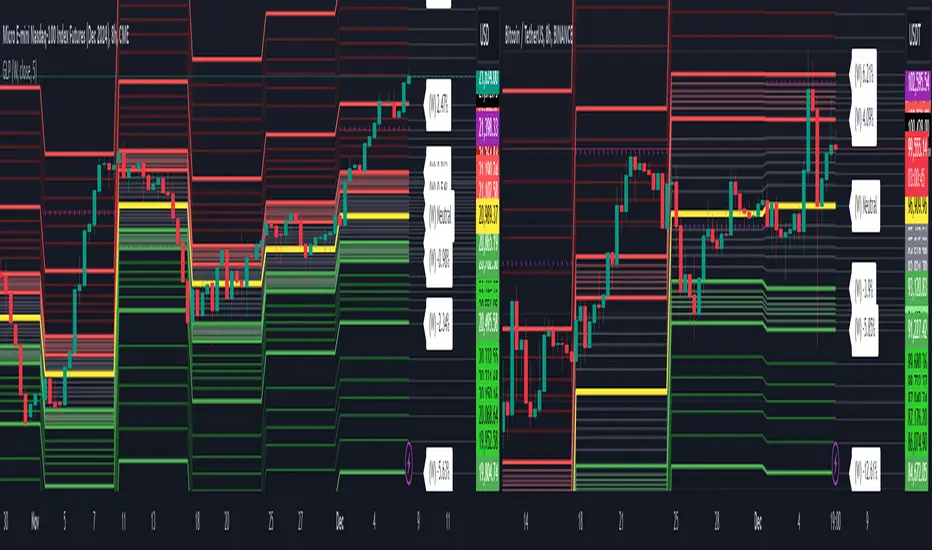
AlgoRhythmica - Liquidity MapThe AlgoRhythmica - Liquidity Map is a complex and performance heavy indicator, attempting to visualize and highlight areas of liquidity on the chart. It paints lines above and below price with different color and opacity based on the volume, and then highlight the areas with the highest cumulative volume.
What is liquidity and a liquidity map?
Liquidity refers to how quickly and easily an asset can be bought or sold in the market without affecting its price. High liquidity means that there are many buyers and sellers, and transactions can happen rapidly and smoothly.
Liquidity analysis involves examining where and how liquidity is distributed across different price levels.
Price often moves from liquidity zone to liquidity zone, and therefore, having an idea of where those zones are can give traders an understanding of potential support and resistance levels and where significant trading activities might occur.
Those looking to fill large buy orders for example would want to do that in liquid sell areas and vice versa. This indicator attempts to estimate the price levels where traders using leverage get liquidated, and therefore creates liquid areas for buying and selling.
In contrast to Bookmaps which chart the orders in the order book where traders want to transact, a liquidity map is charting where traders are 'forced' to transact due to stop-losses or margin calls. To do that, liquidity maps are mostly based on estimations. It could be based on pivot points, common stop-loss amounts, common leverage amounts or a combination of multiple factors.
As of the current version on release, this indicator is only using the leverage input by the user to estimate the liquidity.
How does it work and what makes it unique?
The indicator takes the volume in a candle and saves that volume in a line. Based on the leverage settings it then offsets that line above and below price. Say, a trader using 20x leverage without a stop-loss gets liquidated if price goes roughly 5% in the wrong direction. Therefore, by assuming common leverage amounts or common risk amounts, we can estimate where traders get liquidated or have their stop-losses based on their leverage or amount they are willing to risk.
Now keep in mind, this liquidity map is just estimating based on general assumptions, it doesn't have access to actual liquidity data.
But at the same time, we're not trading single individual traders, but we're trading the market as a whole, and interestingly enough, some risk and leverage amounts are more common than others. People like using those even numbers like 10x, 20x, 1% risk etc. That's why price do often react on the liquidity in liquidity maps such as this one.
So, when a candle is printed, and you are on a smaller timeframe and decided this is just the kind of market for 100x scalpers. You set the leverage to 100x in the settings and the indicator will paint lines above and below price offset by 1%. There are settings for three leverage amounts at the same time, so you might also set it to paint lines at 5% and 10%, just to catch those traders on higher timeframes if price really takes off.
Now let's talk about what makes this indicator really shine and stand out!
Normally, if we just left the indicator doing as above, there would be lines all over the place and very difficult to interpret which areas matter, or we could limit the indicator to only print lines at high volume candles. Now, you do have that option, but that wouldn't pick up areas where low volume trading has cumulated in the same range, such as over a weekend or during market gaps. Where other liquidity indicators out there might miss that liquidity, this indicator has several solutions for it.
The first solution is stacking semi-transparent lines on top of each other. Normally, lines of the same color and transparency wouldn't add and blend together. But this script offers a seamless transition from one color the next, blending those low volume liquidity lines together.
The second solution, and this is what I believe is really unique and powerful, is that this indicator also has the ability highlight certain liquidity. When enabled, it scans through all the lines, cumulate the volume within a specified range around the lines and then compare the cumulated volume range with the ranges around the other lines. New lines created in the range with the highest cumulated volume gets highlighted.
Without this feature you wouldn't necessarily be able to tell which of two strong areas are more liquid. When price later enters that area and crosses those lines, the liquidity there is then considered consumed and lines created in a different range will now begin to highlight.
All of this is of course enhanced, as in the picture above, when multiple copies of the indicator is used together and assigned to only calculate specific parts of the liquidity map, such as longs, shorts or specific leverage amounts.
Oh, and there's also options for assigning which part of the candle should generate the liquidity. Close, Middle Body or Open. The indicator will then assume that the majority of traders are entering their position in that part of the candle.
The offset is calculated from that part of the candle. By using multiple copies of the indicator, you can assign one for each part and that will give you the whole range of the candle. And you might assume more traders go long from the top, so to emphasize that liquidity, you could increase the size or transparency slightly of the lines generated from that part.
How do I use it?
Well, this isn't gonna give you trading signals or anything, but it will visualize the market for you in a new perspective.
Typically, high liquidity areas are often good areas for entry and TP. But always watch how the price reacts in those areas before entering a position. And remember, the liquidity estimation might not always be accurate.
Particularly watch the highlighted areas for long wicks and high volume, indicating that the liquidity was enough to meet the orders and a retrace or reversal could be imminent.
Watch what happens during consolidation, market gaps and weekends. Notice the lack of liquidity and how the market maker creates liquidity by inducing traders to take positions with quick moves that instantly reverses. You might know how that works in theory, but watching it happen real-time with visualized liquidity is very interesting.
While not necessary, and as I've mentioned earlier, dividing the different functions of the indicator on multiple copies will substantially increase it's accuracy and performance!
For example, use one copy of the indicator per leverage level, or one for shorts, one for longs. One that generates from the close, one from the middle etc. creating a much clearer picture of the liquidity like the picture comparison above.
This is what the indicator offers:
When you're estimating liquidity, you want to be able to do it with accuracy and interpretability. That's why the customization options of this indicator has been really important in the development.
Timeframe Options:
It supports a wide range of time periods, from daily to yearly, enabling traders to apply it across various trading strategies, from short-term day trading to long-term investment analysis. Assuming traders are eventually taking their profits, liquidity after the set time period disappears.
Rich Visual Settings:
The indicator comes with multiple preset color themes and a completely customizable option as well. These visual settings are designed to enhance the interpretability of liquidity data, with adjustable transparency and contrast features.
Liquidity Highlighting Function:
This unique feature emphasizes areas with high liquidity concentration. It scans and highlights significant liquidity zones, aiding traders in identifying critical market levels.
Liquidity Profile:
The LQ-Profile extends liquidity lines based on their associated volume, giving traders another way of identifying high liquidity zones.
Adjustable Liquidity Estimation:
Select and adjust leverage amounts based on your particular chart and analysis. Choose what positions and leverage amounts to display liquidity for. You also have the option to determine if wicks consume liquidity or not.
Since wicks indicate that price was rejected from that area, it doesn't necessarily mean all the liquidity in that area was consumed. You could assign an additional copy of the indicator consuming with wicks and another that doesn't. That way, half the liquidity gets consumed and the other half remains until another candle closes in that area. They choices are endless and it's all about your understanding and analysis here.
Multiple Performance Options:
Depending on your particular chart and timeframe, this indicator can be very performance heavy to load. Luckily it has plenty of performance options for limiting the calculations of the indicator.
Tooltips:
As usual, this indicator comes with extensive tooltips for every function, making sure you understand every part of it.
Happy trading!

Intraday Fibonacci Levels [Gorb]Welcome to the Intraday Fibonacci Levels indicator, a dynamic and customizable tool designed for traders who incorporate Fibonacci retracements and extensions into their technical analysis. This indicator focuses on intraday price action, allowing you to select a specific candle from any trading session and visualize crucial Fibonacci levels derived from its high and low prices.
Features:
Candle Selection for Fibonacci Analysis: Select any candle based on its time to plot Fibonacci levels, giving you control over the period of analysis.
Customizable .236 and .618 Fibonacci Levels: Plot and customize the .236 and .618 Fibonacci retracement and extension levels. Adjust color and line style for each level to fit your chart preferences.
User-Friendly Interface: Easy-to-use input fields for selecting the candle time and configuring Fibonacci settings. Intuitive toggle options to display or hide specific Fibonacci levels.
Dynamic Updating: The indicator updates in real-time as new price data is received, ensuring you have the latest Fibonacci levels on your chart.
Usage Case:
This indicator is ideal for day traders and technical analysts who utilize Fibonacci tools to identify potential support and resistance levels, trend reversals, or continuation patterns. Whether you are analyzing a high-impact news event candle or a significant pivot point in the trading day, this indicator helps bring clarity to your Fibonacci-based trading strategy.
Guidelines for Usage:
Use the indicator settings to select the candle time and configure your desired Fibonacci levels. You can choose any time you want, in order to use premarket candles you need to enable electronic hours on your chart to have levels plot from pre/post.
These auto plotted levels can act as pivot points or points of support and resistance for traders to make informed trading decisions near these levels. Analyze the plotted Fibonacci levels in conjunction with other technical indicators or price action patterns for informed trading decisions.
Conclusion:
This indicator is a versatile and essential tool for traders who rely on Fibonacci analysis as part of their trading arsenal. By offering the flexibility to analyze specific candles and customize Fibonacci levels, this indicator empowers you to make more informed trading decisions. Its user-friendly design and real-time updating capabilities ensure that you have access to accurate and relevant Fibonacci data at any moment of the trading day.
RISK DISCLAIMER
All content, tools, scripts & education provided by Monstanzer or Gorb Algo are for informational & educational purposes only. Trading is risk and most lose their money, past performance does not guarantee future results.

VWAP LEVELS [PRO]32 VWAP levels with labels and a table to help you identify quickly where current price is in relation to your favorite VWAP pivot levels. To help reduce cognitive load, 4 colors are used to show you where price is in relation to a VWAP level as well as the strength of that respective level. Ultimately, VWAP can be an invaluable source of support and resistance; in other words you'll often see price bounce off of a level (whether price is increasing or decreasing) once or multiple times and that could be an indication of a price's direction. Another way that you could utilize this indicator is to use it in confluence with other popular signals, such as an EMA crossover. Many traders will wait till a bar's close on the 5m or 10m time frame above a VWAP level (developing 1D VWAP would be a popular choice) before making a decision on a potential trade especially if price is rising above the 1D VWAP *and* there's been a recent 100 EMA cross UP of the 200 EMA. These are 2 bullish signals that you could look for before possibly entering in to a trade.
I've made this indicator extremely customizable:
⚡Each VWAP level has 2 labels: 1 "at level" and 1 "at right", each label and price can be disabled
⚡Each VWAP label has its own input for label padding. The "at right" label padding input allows you to zoom in and out of a chart without the labels moving along their respective axis. However, the "at level" label padding input doesn't work the same way once you move the label out of the "0" input. The label will move slightly when you zoom in and out
⚡Both "current" and "previous" VWAP levels have their own plot style that can be changed from circles, crosses and lines
⚡Significant figures input allows you to round a price up or down
⚡A price line that allows you to identify where price is in relation to a VWAP level
⚡A table that's color coded the same way as the labels. The labels and table cells change to 1 of 4 colors when "OC Check Mode" is enabled. This theory examines if the VWAP from the Open is above or below the VWAP from Close and if price is above or below normal VWAP (HLC3). This way we have 4 states:
Red = Strong Downtrend
Light Red = Weak Downtrend
Light = Weak Uptrend
Green = Strong Uptrend
Something to keep in mind: At the start of a new year, week or month, some levels will converge and they'll eventually diverge slowly or quickly depending on the level and/or time frame. You could add a few labels "at level" to show which levels are converging at the time. Since we're at the beginning of a new year, you'll see current month, 2 month, 3 month etc converge in to one level.
🙏Thanks to (c)MartinWeb for the inspiration behind this indicator.
🙏Thanks to (c)SimpleCryptoLife for the libraries and code to help create the labels.
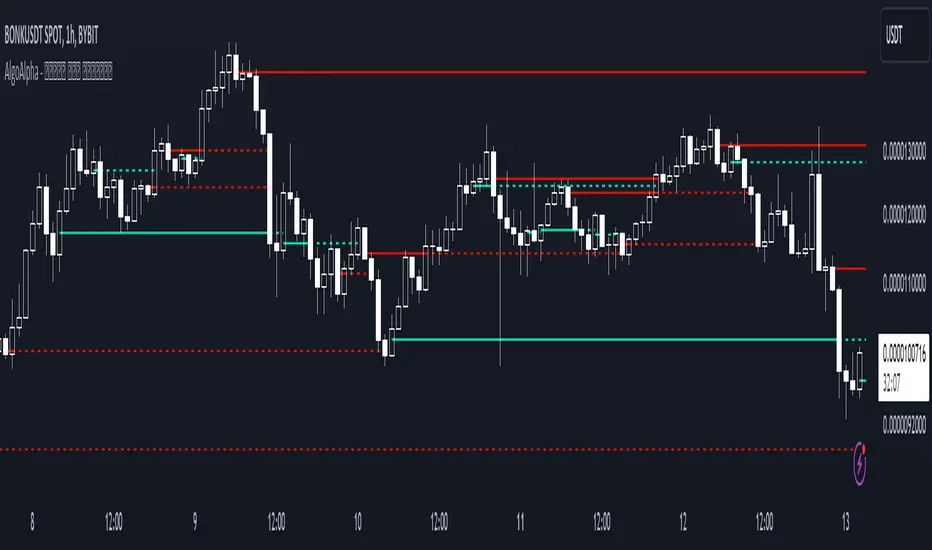
Peak & Valley Levels [AlgoAlpha]The Peak & Valley Levels indicator is a sophisticated script designed to pinpoint key support and resistance levels in the market. By utilizing candle length and direction, it accurately identifies potential reversal points, offering traders valuable insights for their strategies.
Core Components:
Peak and Valley Detection: The script recognizes peaks and valleys in price action. Peaks (potential resistance levels) are identified when a candle is longer than the previous one, changes direction, and closes lower, especially on lower volume. Valleys (potential support levels) are detected under similar conditions but with the candle closing higher.
Color-Coded Visualization:
Red lines mark resistance levels, signifying peaks in the price action.
Green lines indicate support levels, representing valleys.
Dynamic Level Adjustment: The script adapts these levels based on ongoing market movements, enhancing their relevance and accuracy.
Rejection Functions:
Bullish Rejection: Determines if a candlestick pattern rejects a level as potential support.
Bearish Rejection: Identifies if a pattern rejects a level as possible resistance.
Usage and Strategy Integration:
Visual Aid for Support and Resistance: The indicator is invaluable for visualizing key market levels where price reversals may occur.
Entry and Exit Points: Traders can use the identified support and resistance levels to fine-tune entry and exit points in their trading strategies.
Trend Reversal Signals: The detection of peaks and valleys serves as an early indicator of potential trend reversals.
Application in Trading:
Versatile for Various Trading Styles: This indicator can be applied across different trading styles, including swing trading, scalping, or trend-following approaches.
Complementary Tool: For best results, it should be used alongside other technical analysis tools to confirm trading signals and strategies.
Customization and Adaptability: Traders are encouraged to experiment with different settings and timeframes to tailor the indicator to their specific trading needs and market conditions.
In summary, the Peak & Valley Levels by AlgoAlpha is a dynamic and adaptable tool that enhances a trader’s ability to identify crucial market levels. Its integration of candlestick analysis with dynamic level adjustment offers a robust method for spotting potential reversal points, making it a valuable addition to any trader's toolkit.
Adaptive MFT Extremum Pivots [Elysian_Mind]Adaptive MFT Extremum Pivots
Overview:
The Adaptive MFT Extremum Pivots indicator, developed by Elysian_Mind, is a powerful Pine Script tool that dynamically displays key market levels, including Monthly Highs/Lows, Weekly Extremums, Pivot Points, and dynamic Resistances/Supports. The term "dynamic" emphasizes the adaptive nature of the calculated levels, ensuring they reflect real-time market conditions. I thank Zandalin for the excellent table design.
---
Chart Explanation:
The table, a visual output of the script, is conveniently positioned in the bottom right corner of the screen, showcasing the indicator's dynamic results. The configuration block, elucidated in the documentation, empowers users to customize the display position. The default placement is at the bottom right, exemplified in the accompanying chart.
The deliberate design ensures that the table does not obscure the candlesticks, with traders commonly situating it outside the candle area. However, the flexibility exists to overlay the table onto the candles. Thanks to transparent cells, the underlying chart remains visible even with the table displayed atop.
In the initial column of the table, users will find labels for the monthly high and low, accompanied by their respective numerical values. The default precision for these values is set at #.###, yet this can be adjusted within the configuration block to suit markets with varying degrees of volatility.
Mirroring this layout, the last column of the table presents the weekly high and low data. This arrangement is part of the upper half of the table. Transitioning to the lower half, users encounter the resistance levels in the first column and the support levels in the last column.
At the center of the table, prominently displayed, is the monthly pivot point. For a comprehensive understanding of the calculations governing these values, users can refer to the documentation. Importantly, users retain the freedom to modify these mathematical calculations, with the table seamlessly updating to reflect any adjustments made.
Noteworthy is the table's persistence; it continues to display reliably even if users choose to customize the mathematical calculations, providing a consistent and adaptable tool for informed decision-making in trading.
This detailed breakdown offers traders a clear guide to interpreting the information presented by the table, ensuring optimal use and understanding of the Adaptive MFT Extremum Pivots indicator.
---
Usage:
Table Layout:
The table is a crucial component of this indicator, providing a structured representation of various market levels. Color-coded cells enhance readability, with blue indicating key levels and a semi-transparent background to maintain chart visibility.
1. Utilizing a Table for Enhanced Visibility:
In presenting this wealth of information, the indicator employs a table format beneath the chart. The use of a table is deliberate and offers several advantages:
2. Structured Organization:
The table organizes the diverse data into a structured format, enhancing clarity and making it easier for traders to locate specific information.
3. Concise Presentation:
A table allows for the concise presentation of multiple data points without cluttering the main chart. Traders can quickly reference key levels without distraction.
4. Dynamic Visibility:
As the market dynamically evolves, the table seamlessly updates in real-time, ensuring that the most relevant information is readily visible without obstructing the candlestick chart.
5. Color Coding for Readability:
Color-coded cells in the table not only add visual appeal but also serve a functional purpose by improving readability. Key levels are easily distinguishable, contributing to efficient analysis.
Data Values:
Numerical values for each level are displayed in their respective cells, with precision defined by the iPrecision configuration parameter.
Configuration:
// User configuration: You can modify this part without code understanding
// Table location configuration
// Position: Table
const string iPosition = position.bottom_right
// Width: Table borders
const int iBorderWidth = 1
// Color configuration
// Color: Borders
const color iBorderColor = color.new(color.white, 75)
// Color: Table background
const color iTableColor = color.new(#2B2A29, 25)
// Color: Title cell background
const color iTitleCellColor = color.new(#171F54, 0)
// Color: Characters
const color iCharColor = color.white
// Color: Data cell background
const color iDataCellColor = color.new(#25456E, 0)
// Precision: Numerical data
const int iPrecision = 3
// End of configuration
The code includes a configuration block where users can customize the following parameters:
Precision of Numerical Table Data (iPrecision):
// Precision: Numerical data
const int iPrecision = 3
This parameter (iPrecision) sets the precision of the numerical values displayed in the table. The default value is 3, displaying numbers in #.### format.
Position of the Table (iPosition):
// Position: Table
const string iPosition = position.bottom_right
This parameter (iPosition) sets the position of the table on the chart. The default is position.bottom_right.
Color preferences
Table borders (iBorderColor):
// Color: Borders
const color iBorderColor = color.new(color.white, 75)
This parameters (iBorderColor) sets the color of the borders everywhere within the window.
Table Background (iTableColor):
// Color: Table background
const color iTableColor = color.new(#2B2A29, 25)
This is the background color of the table. If you've got cells without custom background color, this color will be their background.
Title Cell Background (iTitleCellColor):
// Color: Title cell background
const color iTitleCellColor = color.new(#171F54, 0)
This is the background color the title cells. You can set the background of data cells and text color elsewhere.
Text (iCharColor):
// Color: Characters
const color iCharColor = color.white
This is the color of the text - titles and data - within the table window. If you change any of the background colors, you might want to change this parameter to ensure visibility.
Data Cell Background: (iDataCellColor):
// Color: Data cell background
const color iDataCellColor = color.new(#25456E, 0)
The data cells have a background color to differ from title cells. You can configure this is a different parameter (iDataColor). You might even set the same color for data as for the titles if you will.
---
Mathematical Background:
Monthly and Weekly Extremums:
The indicator calculates the High (H) and Low (L) of the previous month and week, ensuring accurate representation of these key levels.
Standard Monthly Pivot Point:
The standard pivot point is determined based on the previous month's data using the formula:
PivotPoint = (PrevMonthHigh + PrevMonthLow + Close ) / 3
Monthly Pivot Points (R1, R2, R3, S1, S2, S3):
Additional pivot points are calculated for Resistances (R) and Supports (S) using the monthly data:
R1 = 2 * PivotPoint - PrevMonthLow
S1 = 2 * PivotPoint - PrevMonthHigh
R2 = PivotPoint + (PrevMonthHigh - PrevMonthLow)
S2 = PivotPoint - (PrevMonthHigh - PrevMonthLow)
R3 = PrevMonthHigh + 2 * (PivotPoint - PrevMonthLow)
S3 = PrevMonthLow - 2 * (PrevMonthHigh - PivotPoint)
---
Code Explanation and Interpretation:
The table displayed beneath the chart provides the following information:
Monthly Extremums:
(H) High of the previous month
(L) Low of the previous month
// Function to get the high and low of the previous month
getPrevMonthHighLow() =>
var float prevMonthHigh = na
var float prevMonthLow = na
monthChanged = month(time) != month(time )
if (monthChanged)
prevMonthHigh := high
prevMonthLow := low
Weekly Extremums:
(H) High of the previous week
(L) Low of the previous week
// Function to get the high and low of the previous week
getPrevWeekHighLow() =>
var float prevWeekHigh = na
var float prevWeekLow = na
weekChanged = weekofyear(time) != weekofyear(time )
if (weekChanged)
prevWeekHigh := high
prevWeekLow := low
Monthly Pivots:
Pivot: Standard pivot point based on the previous month's data
// Function to calculate the standard pivot point based on the previous month's data
getStandardPivotPoint() =>
= getPrevMonthHighLow()
pivotPoint = (prevMonthHigh + prevMonthLow + close ) / 3
Resistances:
R3, R2, R1: Monthly resistance levels
// Function to calculate additional pivot points based on the monthly data
getMonthlyPivotPoints() =>
= getPrevMonthHighLow()
pivotPoint = (prevMonthHigh + prevMonthLow + close ) / 3
r1 = (2 * pivotPoint) - prevMonthLow
s1 = (2 * pivotPoint) - prevMonthHigh
r2 = pivotPoint + (prevMonthHigh - prevMonthLow)
s2 = pivotPoint - (prevMonthHigh - prevMonthLow)
r3 = prevMonthHigh + 2 * (pivotPoint - prevMonthLow)
s3 = prevMonthLow - 2 * (prevMonthHigh - pivotPoint)
Initializing and Populating the Table:
The myTable variable initializes the table with a blue background, and subsequent table.cell functions populate the table with headers and data.
// Initialize the table with adjusted bgcolor
var myTable = table.new(position = iPosition, columns = 5, rows = 10, bgcolor = color.new(color.blue, 90), border_width = 1, border_color = color.new(color.blue, 70))
Dynamic Data Population:
Data is dynamically populated in the table using the calculated values for Monthly Extremums, Weekly Extremums, Monthly Pivot Points, Resistances, and Supports.
// Add rows dynamically with data
= getPrevMonthHighLow()
= getPrevWeekHighLow()
= getMonthlyPivotPoints()
---
Conclusion:
The Adaptive MFT Extremum Pivots indicator offers traders a detailed and clear representation of critical market levels, empowering them to make informed decisions. However, users should carefully analyze the market and consider their individual risk tolerance before making any trading decisions. The indicator's disclaimer emphasizes that it is not investment advice, and the author and script provider are not responsible for any financial losses incurred.
---
Disclaimer:
This indicator is not investment advice. Trading decisions should be made based on a careful analysis of the market and individual risk tolerance. The author and script provider are not responsible for any financial losses incurred.
Kind regards,
Ely

Apeiron Jail RangeThe Apeiron Jail Range is an experimental use of proprietary standard deviation calculations.
It calculates price standard deviations based of previous data & a MA, which it applies and anchors to an automatically (can also be done manually) selected TF open. Finally, the standard deviation bands are plotted and create a "Jail" range with up to 12 levels (6 above and 6 below) that can potentially work as support and resistance during the TF period anchor time.
The indicator is meant to help traders identify potential support and resistance levels which can then be used in confluence with other indicators and strategies. It can also be potentially used for testing automation strategies such as grid trading.
The anchor time and the lenght of the MA used for the calculation can be manually or automatically selected.
The example shown uses the same indicator twice to show all levels from 0.5 - 1 - 1.5 ... 5.5 - 6

Market Pivot Levels [Past & Live]Market Levels provide a robust view of daily pivot points of markets such as high/low/close with both past and live values shown at the same time using the recently updated system of polylines of pinescript.
The main need for this script arose from not being able to use plots for daily points because plots are inherently once drawn can't be erased and because we can't plot stuff for previous bars after values are determined we can't use them reliably. And while we can use traditional lines, because we would have extremely high amount of lines and we would have to keep removing the previous ones it wouldn't be that effective way for us. So we try to do it with the new method of polylines .
Features of this script:
- Daily High/Low Points
- Yesterday High/Low/Close Points
- Pre-Market High-Low points.
Now let's preview some of the important points of code and see how we achieve this:
With the code below we make sure no matter which chart we are using we are getting the extended hours version of sessions so our calculations are made safely for viewing pre-market conditions.
// Let's get ticker extended no matter what the current chart is
tc = ticker.new(syminfo.prefix, syminfo.ticker, session.extended)
Coding our own function to calculate high's and low's because inbuilt pinescript function cannot take series and we send this function to retrieve our high's and lows.
// On the fly function to calculate daily highlows instead of tv inbuilt because tv's length cannot take series
f_highlow(int last) =>
bardiff = last
float _low = low, float _high = high
for i = bardiff to 0 by 1
if high > _high
_high := high
if low < _low
_low := low
With doing calculations at the bars of day ending points we can retrieve the correct points and values and push them for our polylines array so it can be used in best way possible.
// Daily change points
changeD = timeframe.change("D")
// When new day starts fill polyline arrays with previous day values for polylines to draw on chart
// We also update prevtime values with current ones after we pushed to the arrays
if changeD
f_arrFill(cpArrHigh, cpArrLow, prevArrh, prevArrl, prevArrc, prevMarh, prevMarl)
valHolder.unshift(valueHold.new(_high, _low, _high, _close, _low, time, pr_h, pr_l))
The rest of the code is annotated and commented. You can let me know in comments if you have any questions. Happy trading.

Golden Level Predictions v1.0Golden Level Predictions (GLP) Trading Indicator
This script introduces a custom trading indicator named "GLP" tailored for the TradingView platform. It offers various price levels derived from Fibonacci calculations and other mathematical models, assisting traders in pinpointing potential overpriced and discounted price levels.
Key Features:
User Inputs : Users have the flexibility to select their desired timeframe, with options ranging from Weekly, Daily, Monthly, and more. Additionally, they can opt to showcase Fibonacci lines and the associated prices within these levels.
Price Level Calculations :
- Employs constants such as the Golden Ratio (PHI) and Pi (PI) to extract various multipliers and factors.
- Assesses if the current asset is a cryptocurrency and tweaks calculations accordingly.
- Determines overpriced and discounted price levels, drawing from the current open price and past data.
Fibonacci Levels :
- For each overpriced and discounted level, the script computes intermediary Fibonacci levels, including 23.6%, 38.2%, 50%, 61.8%, and 78.6% (the 3rd level is excluded due to plot limitations).
- These levels are illustrated on the chart, granting traders a more detailed view of price targets.
Visual Elements :
- Projects horizontal lines to the subsequent selected indicator interval for every calculated price level.
- Exhibits potential percentage gains or losses at each tier, indicating the prospective price alteration upon reaching that level.
- Differentiates overpriced (green) and discounted (red) levels using color codes. A neutral price is depicted in yellow.
Anticipated Close Calculation : Offers a projected closing price for the current timeframe, based on a myriad of factors.
This indicator is particularly effective with cryptocurrencies due to their inherent volatility. It's also compatible with stocks and is most efficient with tickers that provide volume data.
Histogram-based price zonesThis indicator provides a new approach to creating price zones that can be used as support and resistance. The approach does not use pivot points or Fibonacci levels. Instead, it uses the frequency of occurence of local maxima and minima to determine zones of interest where price often changed direction.
The algorithm is as follows:
- Gather price data from the last Lookback trading periods
- Calculate rolling minima and rolling maxima along the price points with window size Window size
- Build a histogram from the rolling extrema which are binned into different zones. The number of bins and therefore the width of a zone can be adjusted with the parameter Zone width factor
- Select only the top fullest bins. The number of bins selected for plotting can be controlled with Zone multiplier
The result are a number of boxes that appear on the chart which mark levels of interest to watch for. You can combine multiple instances of this indicator on different settings to find zones that are very relevant.
Shown as an example is the Nasdaq 100 futures ( NQ1! ) on the D timeframe with levels built from the last 100 periods with default settings. The boxes are the only output of the indicator, no signals are created.

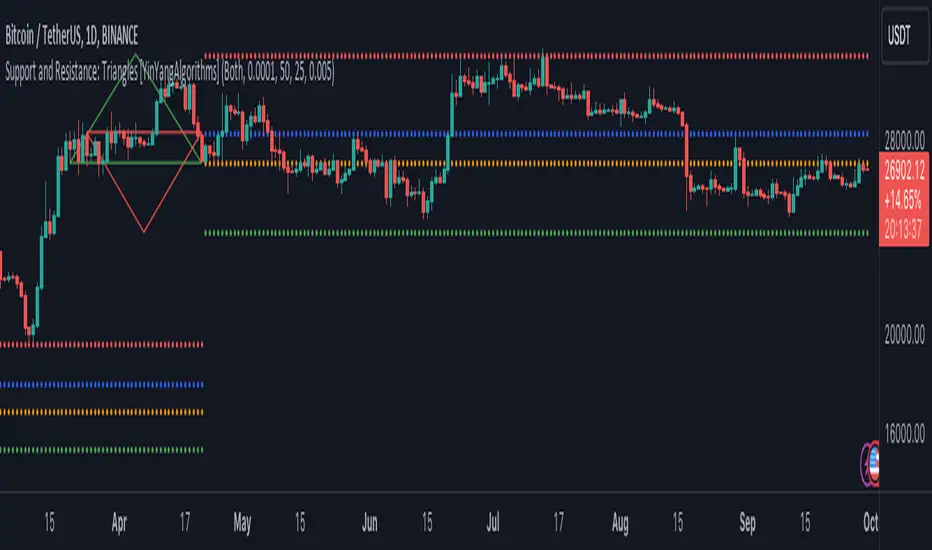
Support and Resistance: Triangles [YinYangAlgorithms]Overview:
Triangles have always been known to be the strongest shape. Well, why wouldn’t that likewise apply to trading? This Indicator will create Upwards and Downwards Triangles which in turn create Support and Resistance locations. For example, we find 2 highs that meet the criteria (within deviation %, Minimum Distance and Lookback Distance). We calculate the distance between these two and create an Equilateral Triangle Downwards (You can adjust the % if you want more of an Isosceles Triangle). The midpoint (tip) of this triangle is the Support and the bottom (base) of it is the Resistance. The exact opposite applies for an Upwards Triangle.
The reason why Triangles may make for good Support and Resistance locations is the % 's used, much like the fibonacci, use ratios relevant in nature and everywhere in the world around us, so why not for trading too?
Tutorial:
If you look at the locations we’ve circled above, all of them exhibit strong rejections are predictive Support and Resistance locations plotted by the triangles created. There can only ever be 1 Upward and 1 Downward Triangle at a time, so when a new one is created, the Support and Resistance locations are moved.
If you scroll back far enough you’ll notice the Triangles disappear but their Support and Resistance locations are still plotted. This has to do with the fact you are allowed only so many Lines plotted and when a new Triangle is created, an old one will be removed. The Support and Resistance locations however will stay.
If we look at the example above, you can see the Support and Resistance locations the Triangles made here may have helped predict where the price would struggle to surpass.
By default the Look Back Distance is set to 50 and the Min Distance is 10 (settings used in all previous examples). However, you can modify these to make Triangles more ‘Rare’ and therefore the Support and Resistance locations change less. In the example above for Instance we left Look Back Distance to 50 but changed Min Distance from 10 to 25. This results in Support and Resistance locations that may hold better in the long term.
If we scroll back a bit, we can see the settings ‘Look Back Distance’ 50 and ‘Minimum Distance’ 25 had done a decent job at predicting the ATH resistance and many Support and Resistance locations around it. Keep in mind, previous results don’t mean future results, but Triangles may create ratios which apply well to trading.
We will conclude our Tutorial here. Hopefully you can see the benefit to the ratio Triangles make when predicting Support and Resistance locations.
Settings:
Show Triangles: If all you want to know is the Support and Resistance locations, there’s no need to draw the Triangles.
Triangle Zones: What types of triangles should we create our zones for? Options are Upward, Downward, Both, None.
Max Deviation Allowed: Maximum Deviation up or down from the last bars High/Low for potential to create a Triangle.
Lookback Distance: How far back we look to see for potential of a High/Low within Deviation range.
Min Distance: This is so triangles are spaced properly and not from 2 bars beside each other. Min distance allocated between 2 points to create a Triangle.
Bar Percent Increase: How much % multiplier do we apply for each bar spacing of the triangle. 0.005 creates a close to Equilateral Triangle, but other values like 0.004 and 0.006 seem to work well too.
If you have any questions, comments, ideas or concerns please don't hesitate to contact us.
HAPPY TRADING!
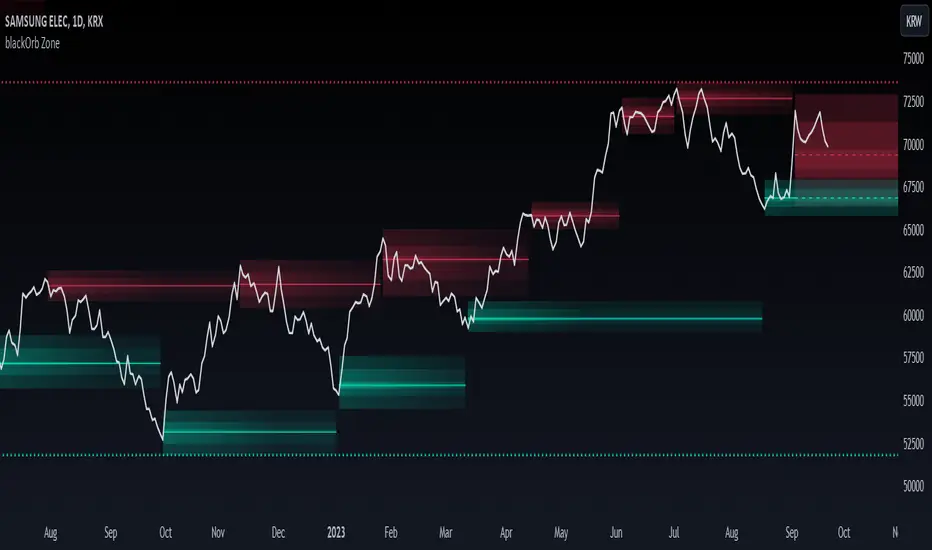
blackOrb ZoneBuying near the bottom and selling near the peak can be a challenging trading approach. However, it all begins with the ability to identify these essential zones. This indicator is targeting support and resistance with heightened accuracy. It utilizes features like:
I. Multi-Level Weighting for Enhanced Support and Resistance Zones
II. Vertical Zone Range Adjustment for Enhanced Price Level Identification
III. High-Time Frame for Solid Macro Validation
IV. Projection Function for Informed Trade Management
V. Automatic Level Identification for Pinpointing Potential Order Positions
VI. Customizable Pivot Analysis for Accurate Zone Identifications
Technical Methodology
I. Multi-Level Weighting for Enhanced Support and Resistance Zones
Support and resistance are more accurately represented as wider zones rather than singular lines. In practical application, relevant support or resistance levels often converge around a central mean-weighted level within a zone.
This indicator visually represents these zones by calculating values from open, high, low, and close prices, accentuating them through varying opacities. Higher opacity within an area indicates a higher likelihood of it serving as a relevant support or resistance level.
Multiple mean options within the settings menu encompass weighted average calculations that utilize different combinations of price data within the relevant pivot analysis phase. This versatility allows users to target pertinent levels within a zone. For instance, when employing hlcc4 price data, the calculation is as follows:
mean_price_hlcc4 = (high + low + close + close) / 4
II. Vertical Zone Range Adjustment for Enhanced Price Level Identification
This feature enables users to precisely adjust the vertical zone range for price references within potential support or resistance phases. For instance, decreasing the reference setting results in a more granular validation within a narrower range. This creates vertically thinner zones with increased price level precision, although it may offer a less comprehensive perspective.
III. High-Time Frame for Solid Macro Validation
The indicator enhances pivot points, potentially in conjunction with high-time frame validation, to identify significant price zones with heightened confirmation strength driven by volume. Higher time frames provide more extensive volume verification, for instance, comparing the 4-hour to the 24-hour timeframe (a multiple of six).
This feature involves cross-referencing data from higher time frames, heightening the reliability of support and resistance zones and providing valuable insights into potential trading interest levels.
Technically, the indicator applies the identical rigorous analysis to both lower and higher time frames. This approach facilitates a more comprehensive perspective and aids in the clearer identification of overarching macro support and resistance levels, even when focusing on smaller timeframes. For instance, a potential support zone identified on the daily time frame can gain higher confidence when confirmed on a weekly chart.
IV. Projection Function for Informed Trade Management
The projection function visually extends the most recent analysis of support and resistance zones forward, in accordance with the user's configured parameters.
By displaying precise price values at these visualized support and resistance levels, this indicator offers valuable assistance in decision-making, particularly when planning real-time orders or when engaged in an active trade management phase (e.g., for the purpose of adjusting stop-loss levels post-entry).
Note: This function is based on historical data. It may not account for unforeseen market events. It's important to complement this feature with ongoing analysis of real-time market data.
V. Automatic Level Identification for Pinpointing Potential Order Positions
It is empirically observed that traders frequently position orders at price levels that conform to quantized values due to cognitive biases.*
Consequently, blackOrb Zone not only facilitates the identification of pertinent levels within a weighted zone but also features an "auto" functionality designed to analyze price dynamics in the proximity of these relevant levels. The objective is to identify discrete values in close vicinity, which exhibit a higher likelihood of serving as authentic support and resistance zones.
This processing approach assists traders in precisely locating the central mean-weighted level within a given zone and identifies proximate quantized levels.
Note: This method becomes especially relevant during phases of price retesting, where market participants converge, contributing to a further refinement of levels, indicative of an asymmetric balance between supply and demand.
*Source: Prof. Mitchell, Jason. "Clustering and Psychological Barriers: The Importance of Numbers." Journal of Futures Markets, vol. 21, no. 5, 2001, pp. 395-428.
VI. Customizable Pivot Analysis for Accurate Zone Identifications
The indicator employs pivot points to pinpoint key price zones where price dynamics could encounter buying or selling pressure.
Essential components of this method involve comparing time units both to the left and right within a designated phase of support or resistance, effectively defining the search range for pivotal points.
For instance, in the analysis below, the search is for the highest price point that hasn't been surpassed within a certain resistance zone in the last 10 time units to the left and 10 time units to the right:
ta.pivothigh(10, 10)
Potential Trade Management Applications of blackOrb Zone
- Reversal Trading : Robust support zones with bullish signals can indicate opportune moments for buying or long position entries, whereas confirmed resistance zones can be identified for selling or short position entries.
- Breakout Trading : Anticipating price surges as price breach support or resistance level. A resistance breakout can signal a bullish price dynamic, while a support breakdown may suggest a bearish price dynamic.
- Range Trading : In lateral sideways markets, users can capitalize on support zones for buying and resistance zones for selling, profiting from price fluctuations.
- Take-Profit Management : For buying or long positions, resistance zones can be identified to determine suitable take-profit levels either within or near these zones - for short positions, vice versa with support zones.
- Stop-Loss Management : For buying or long positions, support zones can be identified to determine appropriate stop-loss levels beneath these zones - for short positions, vice versa with resistance zones to determine stop-loss levels above these zones.
Note on Usability
blackOrb Zone can have synergies with blackOrb Price as both indicators combined can give a bigger picture for supporting comprehensive and multifaceted data-driven trading analysis.
This tool was meticulously created to serve as an additional frame for the seamless integration of other more granular trading indicators. This indicator isn't intended for standalone trading application. Instead, it is serving as a supplementary tool for orientation within broader trading strategies.
Irrespective of market conditions, it can harmonize with a wider range of trading styles and instruments / trading pairs / indices like Stocks, Gold, FX, EURUSD, SPX500, GBPUSD, BTCUSD and Oil.
Inspiration and Publishing
Taking genesis from the inspirations amongst others provided by TradingView Pine Script Wizard Kodify, blackOrb Zone is a multi-encompassing script meticulously forged from scratch. It aspires to furnish a comprehensive approach, borne out of personal experiences and a strong dedication in supporting the trading community. We eagerly await valuable feedback to refine and further enhance this tool.