NSDT ES Asia Open TargetsThis indicator provides potential entries and targets (both long and short) for the ES/MES Asian session. It creates potential target lines on the chart as well as a gray box with the potential levels in text format. Both options can be turned on or off at the discretion of the trader. You may need to adjust the chart width so the box shows on the screen. It's position is adjustable.
The lines and the text box are updated after the first 1 MINUTE bar closes for Asian session. The Asian session open is defined as 6:00PM - 6:01PM, Eastern time.
Place the chart on a 1 MIN time interval for best results. You can change the chart timeframe after the 1st min bar closes and the data is updated.
To get access to this indicator, use the link in the profile signature or private message us here in Tradingview.
Levels

NSDT NQ Asia Open TargetsThis indicator provides potential entries and targets (both long and short) for the NQ/MNQ Asian session. It creates potential target lines on the chart as well as a gray box with the potential levels in text format. Both options can be turned on or off at the discretion of the trader. You may need to adjust the chart width so the box shows on the screen. It's position is adjustable.
The lines and the text box are updated after the first 1 MINUTE bar closes for Asian session. The Asian session open is defined as 6:00PM - 6:01PM, Eastern time.
Place the chart on a 1 MIN time interval for best results. You can change the chart timeframe after the 1st min bar closes and the data is updated.
To get access to this indicator, use the link in the profile signature or private message us here in Tradingview.

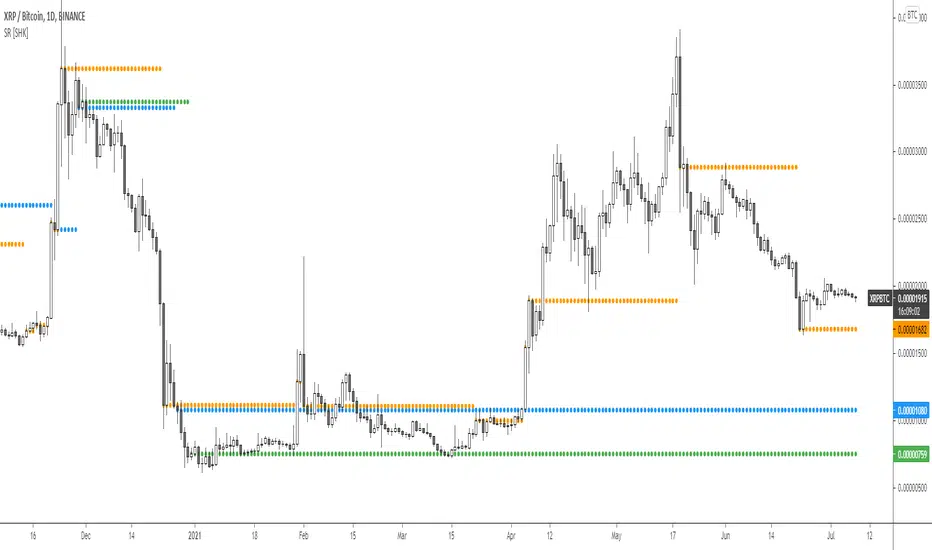
Support and Resistance MTF levels [SHK]A new way of drawing multi timeframe support and resistance !
This tool doesn't get the last high and lows, otherwise it tries to detect highly liquid levels with pending orders .
Share your opinion and result.
Enjoy!
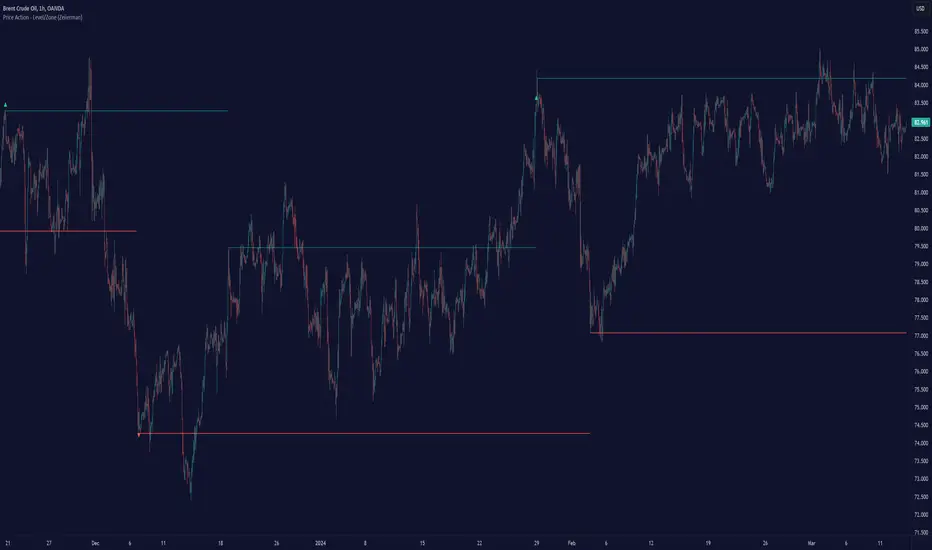
Price Action - Level/Zone (Expo)Price Action - Level/Zone (Expo) indicator identifies buying and selling pressure that has an impact on the price movement. This is visualized by a Zone, or Levels or with Barcolors depending on which settings are used.
Depending on the selected settings the indicator can identify buying and selling pressure which pushes the price further in the trend direction and it can show exhausted buyers/sellers which is seen in reversal points.
HOW TO USE
1. Use the indicator to identify buying and selling pressure.
2. Use the indicator to identify exhausted buyers and sellers.
3. Use the indicator to identify reversal points, pullbacks, or trend shifts.
4. Use the indicator to buy/short-sell breakouts of the zones.
5. Use the indicator to buy/short-sell when the price re-test the zones.
-> Try the indicator on Heikin Ashi Candles , but it works as good at any type of candlestick, bars, Renko, or line break.
INDICATOR IN ACTION
4 hour chart
4 hour chart
I hope you find this indicator useful , and please comment or contact me if you like the script or have any questions/suggestions for future improvements. Thanks!
I will continually work on this indicator, so please share your experience and feedback as it will enable me to make even better improvements. Thanks to everyone that has already contacted me regarding my scripts. Your feedback is valuable for future developments!
ACCESS THE INDICATOR
• Contact me on TradingView or use the links below
-----------------
Disclaimer
Copyright by Zeiierman.
The information contained in my scripts/indicators/ideas does not constitute financial advice or a solicitation to buy or sell any securities of any type. I will not accept liability for any loss or damage, including without limitation any loss of profit, which may arise directly or indirectly from the use of or reliance on such information.
All investments involve risk, and the past performance of a security, industry, sector, market, financial product, trading strategy, or individual’s trading does not guarantee future results or returns. Investors are fully responsible for any investment decisions they make. Such decisions should be based solely on an evaluation of their financial circumstances, investment objectives, risk tolerance, and liquidity needs.
My scripts/indicators/ideas are only for educational purposes!
Buy Sell SignalsWill be making more enhancements to the Buy Sell indicator in the coming days..
The main idea of the indicator is to pick up small but powerful ups and downs in the market.
I personally use 1 min Time Frame as it works the best for me. These are quick entries, you can either exit quickly or trail your stoplosses for a nice profit.
The design is to provide possible entry points. It is not designed to provide you with Exit points.
Also added the Current Day High & Current Day Low (CDH & CDL can change when new highs or new lows are made in intraday).
PDH & PDL denotes the Previous Day High and Low (these are static lines that do not change)
This gives you a sense of how the day is moving.
Please do your own analysis before you take up entries. Trade at your own risk..!
Time Frame: works best in intra day time frames like 1 min, 3 min and 5 mins
Signal:
Possible Long Trend: Background color is GREEN, there is a high possibility that the price would shoot up
Possible Short Trend: Background color is RED, there is a high possibility that the price would take a nose dive
A continued GREEN or RED background does not indicate a fresh entry, it merely shows that the conditions still haven't changed.
Risky traders can still take up a new position or add to their positions when there is a continuous same color - GREEN or RED
When there is no background color, it means that not all conditions are met to give a clear direction. In short the view is neutral.
Recommended Stop Loss or Take Profit:
I personally use 0.5% as the SL and 0.5% as TP. You can use multiples of 0.5% to keep trailing your profits. I've seen some very good results with this. By default, 0.5% for both SL & TP is shown with a grey dotted line for both the Long positions and Short positions.
Alternatively, you can also use the Resistance levels and Support levels as your SL and TP areas too.
Do backtest and find your sweet spot.
Good luck..!

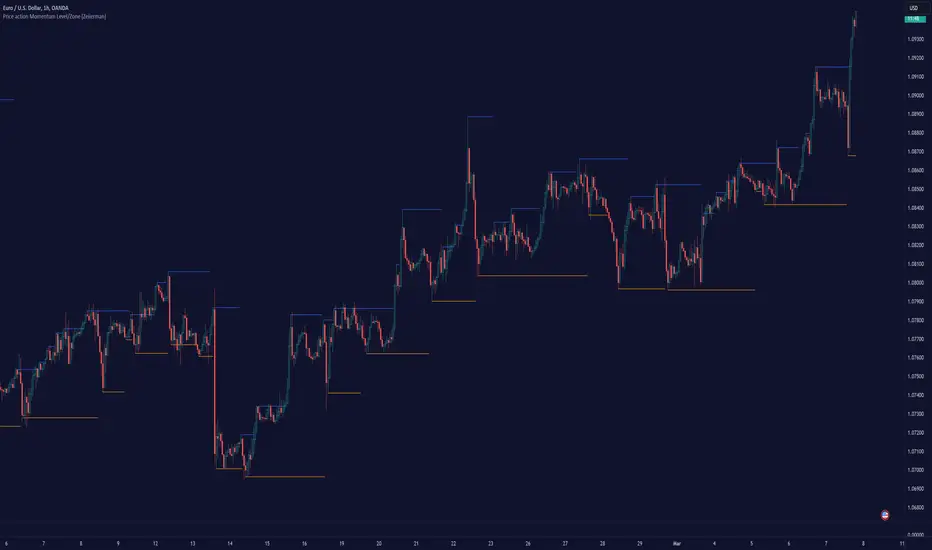
Price action Momentum Level/Zone (Expo) Price action Momentum Levels/Zones (Expo) indicator identifies relatively stronger Up and Down Momentum. This is visualized by a Zone, or Levels or with Barcolors depending on which settings are used.
When the market has relatively stronger momentum it can be a sign that the sellers or buyers are exhausted and the market has to pause, make a pullback, or make a trend shift.
HOW TO USE
1. Use the indicator to identify relatively stronger momentum.
2. Use the indicator to identify pullbacks or trend shifts.
3. Use the indicator to buy/short-sell breakouts of the zones.
4. Use the indicator to buy/short-sell when the price re-test the zones.
INDICATOR IN ACTION
4 hour chart
I hope you find this indicator useful , and please comment or contact me if you like the script or have any questions/suggestions for future improvements. Thanks!
I will continually work on this indicator, so please share your experience and feedback as it will enable me to make even better improvements. Thanks to everyone that has already contacted me regarding my scripts. Your feedback is valuable for future developments!
ACCESS THE INDICATOR
• Contact me on TradingView or use the links below
-----------------
Disclaimer
Copyright by Zeiierman.
The information contained in my scripts/indicators/ideas does not constitute financial advice or a solicitation to buy or sell any securities of any type. I will not accept liability for any loss or damage, including without limitation any loss of profit, which may arise directly or indirectly from the use of or reliance on such information.
All investments involve risk, and the past performance of a security, industry, sector, market, financial product, trading strategy, or individual’s trading does not guarantee future results or returns. Investors are fully responsible for any investment decisions they make. Such decisions should be based solely on an evaluation of their financial circumstances, investment objectives, risk tolerance, and liquidity needs.
My scripts/indicators/ideas are only for educational purposes!
Month Open Price LevelThis tool plots a dynamic level that represents the opening price of each month.
Labels provide additional information about closing price and % change for a particular month and allow micro customizations.

Fearzone & Greedzone Levels - Contrarian & Breakout (Expo)"Be fearful when others are greedy, and greedy when others are fearful" - Warren Buffett. Fearzone & Greedzone Levels - Contrarian & Breakout (Expo) is a contrarian and breakout indicator that gives us an indication when fear and greed begins to take over in the market. Traders should be prepared for increased volatility and good trading opportunities.
This indicator can both be used to identify potential reversal points and be used to identify breakouts from previous Fear and Greed Levels.
The Fearzone and Greedzone can be visualized with candlesticks or with circles depending on what you prefer.
Alert conditions are added.
HOW TO USE
1. Use the indicator to identify when investors are fearful and greedy.
2. Use the indicator to identify potential reversal points.
3. Use the indicator to identify potential breakouts.
INDICATOR IN ACTION
4 hour chart
4 hour chart
I hope you find this indicator useful , and please comment or contact me if you like the script or have any questions/suggestions for future improvements. Thanks!
I will continually work on this indicator, so please share your experience and feedback as it will enable me to make even better improvements. Thanks to everyone that has already contacted me regarding my scripts. Your feedback is valuable for future developments!
-----------------
Disclaimer
Copyright by Zeiierman.
The information contained in my scripts/indicators/ideas does not constitute financial advice or a solicitation to buy or sell any securities of any type. I will not accept liability for any loss or damage, including without limitation any loss of profit, which may arise directly or indirectly from the use of or reliance on such information.
All investments involve risk, and the past performance of a security, industry, sector, market, financial product, trading strategy, or individual’s trading does not guarantee future results or returns. Investors are fully responsible for any investment decisions they make. Such decisions should be based solely on an evaluation of their financial circumstances, investment objectives, risk tolerance, and liquidity needs.
My scripts/indicators/ideas are only for educational purposes!

Pivot LinesThis indicator provides possible short, medium, and long-term support and resistance levels based on recent highs and lows. The furthest the level is, the thicker its line is, making it easy to spot stronger levels where 2 lines overlap. It can be configured to use open/close values instead of high/low for tighter levels.
Default settings:
- Short Period: 20
- Medium Period: 50
- Long Period: 100
This script also provides alerts for when the price crosses over/under a given level or pulls back.
Note: It sometimes displays supports above the price and resistances below it, I still have to figure out why (and fix it if possible), but it's still useful.


CoGrid ManagementThis strategy uses grid levels determined by pivot points based on the selected time period.
It's useful for swing trading without leverage, spot trading or for Hold management.
If the price goes down we buy and if it continues to go down we keep buying improving the average price.
When the price rises above the average entry price, we sell and if it continues to rise, we continue to sell.
It works for any pair as long as Buys and Sells quantities are adjusted correctly.
In these times of great economic change, good luck to everyone 🍀

Key price levelsFunction: labelling recent highs and lows automatically. Easy and clean.
In this example, we can see the previous low of the ticker is around 105.5, the previous high is around 120.
We can set up our entries and exits by referring to the last lows and highs.
Users can adjust the searching bar range by themselves.

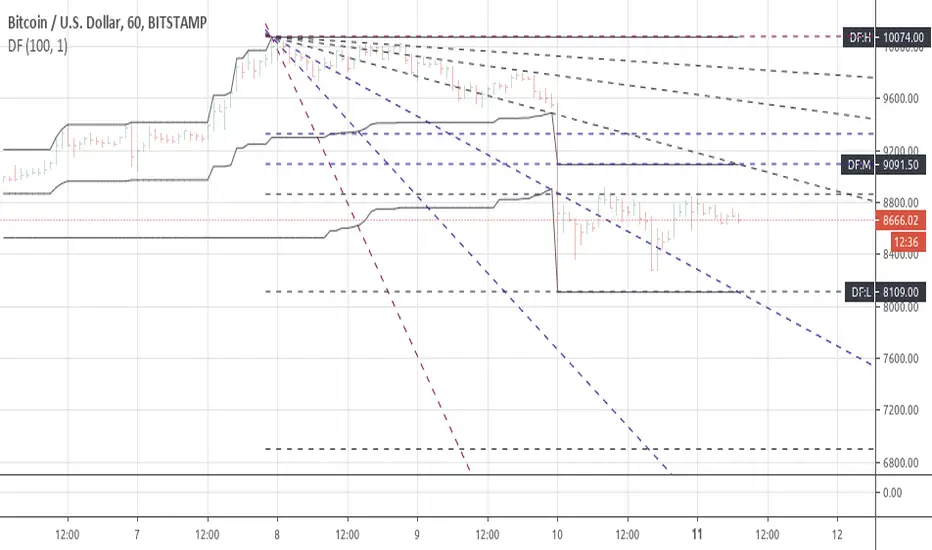
Auto Fibonacci Levels and DMA WMA Resistances by Ahmad DukhanHi,
This indicator will give you from -100% to 300% of the Fibonacci levels that is carefully calculated that doesn't change with frame change and is very reliable regardless which symbol you are trading (Ask for screenshot proof for symbol you trade)
Also included with
- Fibonacci Levels
Daily S/R
- 20 DMA
- 50 DMA
- 100 DMA
- 200 DMA
Weekly S/R
- 20 WMA
- 50 WMA
- 100 WMA
- 200 WMA
With options to toggle/enable/disable any of the above
For more details on how to get this indicator DM me
Thanks

All past LevelsContains all past levels that we need
1. Previous Monthly High
2. Previous Monthly Low
3. Previous Weekly High
4. Previous Weekly Low
5. Previous Daily High
6. Previous Daily Low
7. Previous Monthly Range Average (PMH+PML)/2
8. Previous WeeklyRange Average (PWH+PWL)/2
9. Previous Daily Range Average (PDH+PDL)/2
10. Monthly Open
11. Weekly Open
12. Daily Open
NSDT Auto Support / Resistance LevelsSimple script that automatically plots support and resistance lines based on the pivot points of the number of candles you choose to look back upon.
All options are editable.

NSDT Horizontal MA LinesDisplays up to 5 moving averages as horizontal lines based on the most recent candle. It is important to remember that the line is drawn from right to left.
This gives the chart a nice clean look.
Moving average lengths can be adjusted. Line lengths can be adjusted.

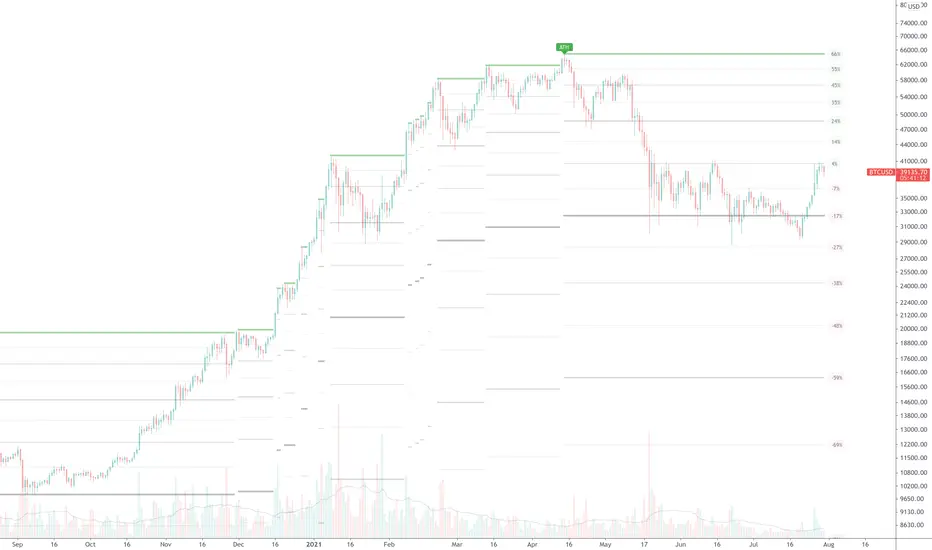
True ATH/ATL w/ labelsPlots the All Time High and All Time Low, with optional labels when a new ATH/ATL is created. Reaches all the way back in history for the true high/low, not limited to the most recent 5000 candles like most scripts. Works on all time frames.
Cuban's Price Action ChannelThe latest in the indicator series tailored to discretionary traders.
This script draws a channel by using the highs and lows of previous timeframes. The H1 and H4 fill is extremely useful for taking low timeframe front-side reversals in a ranging environment, while providing high timeframe levels to take profit at, and plan your next trade.
I believe this script provides a solid fundamental price action understanding and foundation to anyone's discretionary trading setup.

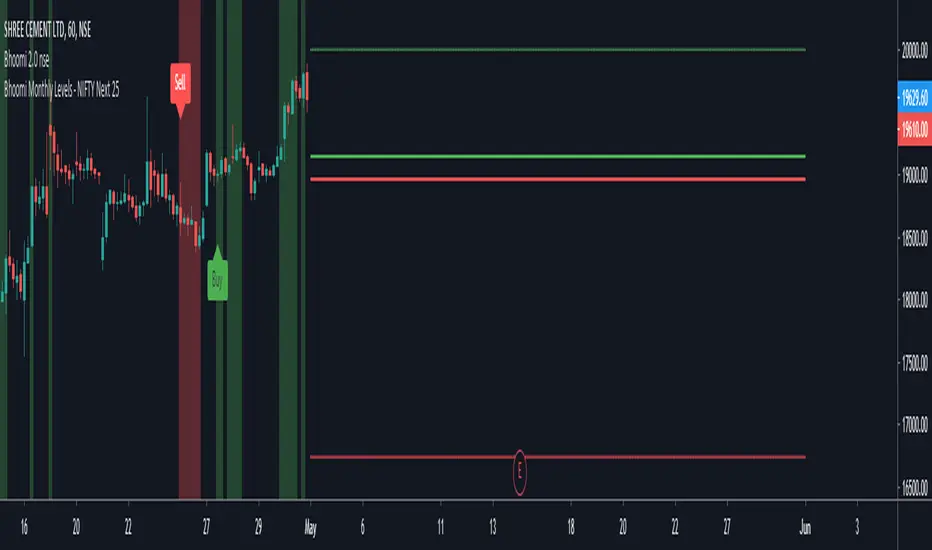
Bhoomi Monthly Levels - NIFTY Next 25This is a custom indicator which assists with monthly levels of Next25 stocks of NIFTY 50.
Bhoomi Monthly Levels - NIFTY 25This is a custom indicator which assists with monthly levels of first 25 stocks of NIFTY 50.

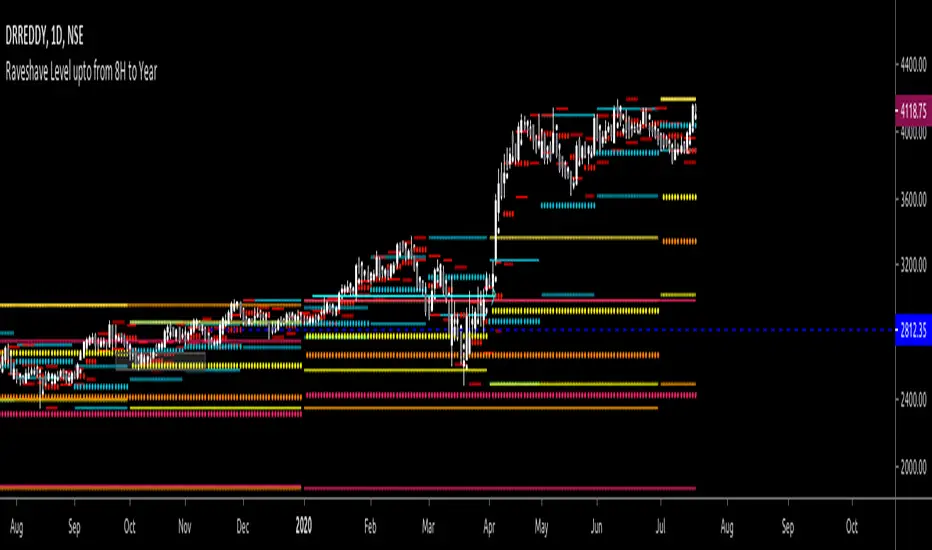
Level KingShows key historical support & resistance (S/R) levels on multiple timeframes
Shows two nearest levels below and above current close price on 2 selected time frames
Option to select timeframes (daily, weekly, monthly, current)
Option to display moving average S/R levels as well (daily and weekly)
Option to display levels for current bar only, or to show all historic S/R levels as they occurred
Strategies include:
Enter or add to long positions on "support" (when price touches a green/blue line)
Enter or add to short positions on "resistance" (when price touches a red/purple line)
Take profit from a long position when a "resistance" level is touched for the first time
Take profit from a short position when a "support" level is touched for the first time

Chonky Initial Balance (crypto)Plots the Initial Balance for crypto assets.
I use it for XBTUSD specifically.
The Initial Balance range is an area watched by Market/Volume Profile traders.
The idea behind it is that participants will start the day with a premeditated bias towards the market, and this is the first glimpse into how the rest of the day may unfold.
Access: DM me and I will consider granting access
