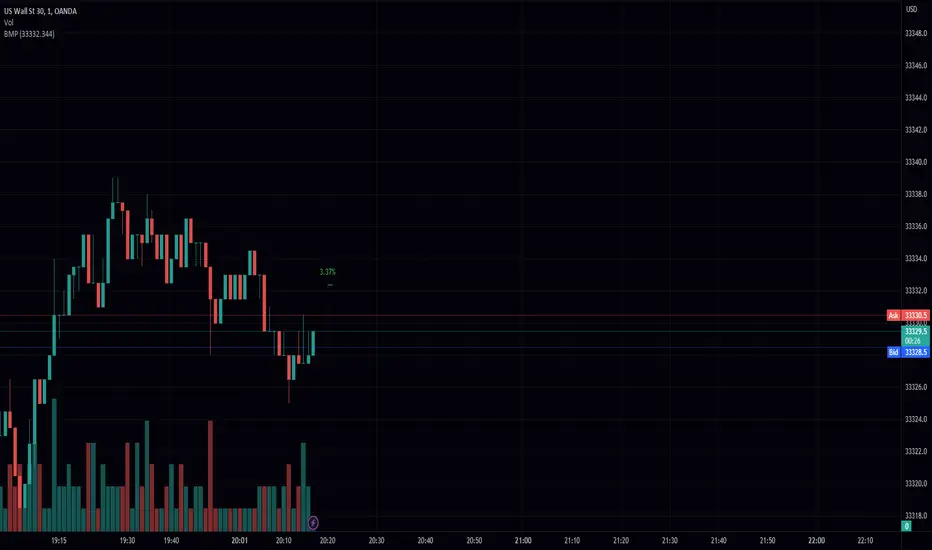
Bar Move Probability (BMP)Hello fellow traders! I am excited to share with you my latest creation, the Bar Move Probability (BMP) indicator. This powerful tool is designed to give you a statistical edge in your trading by helping you understand the likelihood of price movements based on historical data. In this blog post, I'll give you an overview of the indicator, its features, and how it can help you make more informed trading decisions. Let's dive in!
What is the Bar Move Probability Indicator?
The Bar Move Probability (BMP) indicator is a unique tool that calculates the probability of a bar's price movement, either up or down, based on past occurrences of similar price movements. This can give you valuable insights into the potential direction of the market, allowing you to make better-informed trading decisions.
One of the key features of the BMP indicator is that it allows you to choose the price you want to determine the probability of. By inputting your desired price, the indicator will analyze historical data and provide you with the likelihood of reaching that price, offering a more personalized approach to trading.
How Does the BMP Indicator Work?
The BMP indicator calculates the probability of a bar's price movement by comparing the current price change (in percentage) to historical price changes. It does this by maintaining separate arrays for green (bullish) and red (bearish) price movements, as well as corresponding arrays for the count of each movement.
Whenever a new bar is formed, the indicator checks whether the price movement (in percentage) is already present in the respective array. If it is, the corresponding count is updated. Otherwise, a new entry is added to the array, with an initial count of 1.
After analyzing the historical data, the BMP indicator calculates the probability of each price movement by dividing the count of each movement by the sum of all counts. These probabilities are then stored in separate arrays for green and red movements.
Finally, the indicator displays the probability of the current price movement as a label on the chart. The label is color-coded, with green indicating a bullish price movement and red indicating a bearish price movement.
How Can the BMP Indicator Benefit Your Trading?
The primary benefit of the BMP indicator is its ability to provide you with a statistical edge in your trading. By analyzing historical price data, the indicator helps you understand the likelihood of a certain price movement occurring, allowing you to make more informed decisions about your trades.
The customizable nature of the BMP indicator, allowing you to input your desired price, makes it a valuable tool for traders with specific price targets in mind. By understanding the probability of reaching your target price, you can better manage your risk and optimize your trading strategy.
For example, suppose the BMP indicator shows a high probability of a bullish price movement towards your target price. In that case, you may consider entering a long position or tightening your stop loss on an existing short position. Conversely, if the indicator displays a high probability of a bearish price movement away from your target price, you may consider entering a short position or taking profit on an existing long position.
The BMP indicator can be used in conjunction with other technical analysis tools and indicators to further strengthen your trading strategy. For example, you can combine the BMP indicator with support and resistance levels, trend lines, and moving averages to better time your entries and exits.
Wrapping Up
In conclusion, the Bar Move Probability (BMP) indicator is a powerful and customizable tool that can help you gain a statistical edge in your trading. By analyzing historical price data and allowing you to input your desired price, the indicator provides valuable insights into the likelihood of price movements, enabling you to make better-informed trading decisions.
I hope you find the BMP indicator useful
Levels
Swing BoxesHey, folks!
Sorry for not posting anything for such a long time. Don't have enough ideas and resources to get inspiration, so trying to brainstorm good stuff in my free time from university studies.
But despite my absence more I now have 300+ people subscribed to me! Thanks, guys, for keeping interest for my work, as I still do value each boost on my script, for real :)
So here is new script , enjoy!
Swing Boxes is pretty simple indicator, which plots signals with "boxes", that help you determine price targets.
What is the idea behind?
I wanted to make indicator, that could help me make swing trades with nice accuracy (as all we want, lol), and for signal criteria I decided to use highs and lows of the price . Then I started coding some ideas to see which of them could be worthy. And, actually, Swing Boxes appeared to be good. But the thing is, that I didn't intend to build them, they appeared as an anomaly from my code :)
I started to explore this anomaly (it looked super cool, but was repainting hard) to fix it and I succeeded, now Swng Boxes don't repaint.
The main idea is that when price goes above it's highest value of p-bars back or below it's lowest value p-bars back, then there is a some god probability, that price will continue to follow current direction.
And the things about Swing Boxes is that when there is a good trend movement, the boxes become super small to track price movement and when price breaks out in the counter-trend direction, then you will be able to almost perfectly catch a top or a bottom! But most of the signals won't be so high-quality, so don't think that is this some holy grail to trade swing-trading, because it is not.
Signal logic
Quick hint:
- epsilon(variable e ) = ATR * ATR_Factor . It is used to determine box's sensitivity to price changes.
If previous close is higher than variable, which contains previous HIGHEST value (variable h in the code), then update the this variable by taking up-to-date highest value and add epsilon( e ) to it;
If previous close is lower than variable, which contains previous LOWEST value (variable l in the code), then update the this variable by taking up-to-date lowest value and substract epsilon( e ) from it.
Variables decribed above ( h and l ) are box's top and bottom respectively, so if price cross them, it is logical to update it is value.
Settings and what is what
Swing Box Period - numbers fo bars in the past to find highest and lowest price from. The bigger the input, the bigger the boxes will be;
ATR Period;
ATR Factor - multiplier for ATR, determines sensitivity for price changes. The bigger this input, the more accurate signals will be, but less the probability that the signal will be on the top or a bottom.
Show Boxes? - when chosen, plots box's top and bottom. Used to determine price targets.
Show Baseline? - when chosen, plot's baseline, which midline between box's top and bottom.
How to use?
This indicator plots green and red triangles by default.
- Green triangle --> Buy ;
- Red triangle --> Sell ;
As I've said before, many signals from indicator will probably be garbage, so you need to tune settings for youself, so it could satisfy you .
You can enable showing boxes to see box's top and bottom. Box's bottom --> your entry, top --> your profit target.
If you find a way to sort bad signals, you will be able to trade with super cool RR, because the signal from Swing Boxes appear to be a good one, there is almost 95% probability, that price will not even come close to your stop loss, so you can trade with super small stop-losses! Smaller stop-loss --> smaller risk --> smaller loss --> bigger profit, it is that easy.
Also you can enable baseline to use at as your 1st TP, and box's top/bottom as 2nd TP, closing 25% on TP1 and the rest on TP2 (but that is just mine recommendation, you can use different RM (risk-management), if you want).
Also you can use baseline as your S/R (Support/Resistance) line, test it out on your charts.
And please, hear me out: as all other indicators out here on the TradingView, Swing Boxes ARE NOT meant to be traded in solo! Many bad signal can go in a row, so PLEASE find your way to filter out bad signals with other indicators.
You can see here the example of a garabge-class signal in a row, so be don't be deluded!
I do hope that somebody will suggest and idea to improve this thing, as I personally don't have enough time to think about it because of my university studies, but I will probably try it make this thing better throughout the time.
And that's it for now, folks! If you have any ideas for scripts, strategies or anything else, feel free to DM me or leave a comment, I will check it.
Hope you will find this script useful.
Take your profits!
- Tarasenko Fyodor

Break Levels – Peaks and Valleys – Market StructureDescription
An experimental script, designed as a visual aid, to highlight two consecutive green candles after a red candle, and two consecutive red candles after a green candle. We can assume these formations to be potential candidates as an origin of a peak and valley. The highest point of the 1st red candle and lowest point of the 1st green candle is to be considered as break levels.
How to use
Expect attacks/tests or a break of these levels in the future. A solid break through these levels may produce a potential retest in the opposite direction. The greater the number of times a zone is tested, the more likely it is to break.
By using them as reference points, traders are expected to follow their own set of rules and mark higher probability supply and demand zones in the area.
Alerts are added for either a candle close or wick through the levels. For the alerts the script only trails the latest high and low break levels.
This can be used as an alternative to those who use fractals for market structure.
Indicator in use

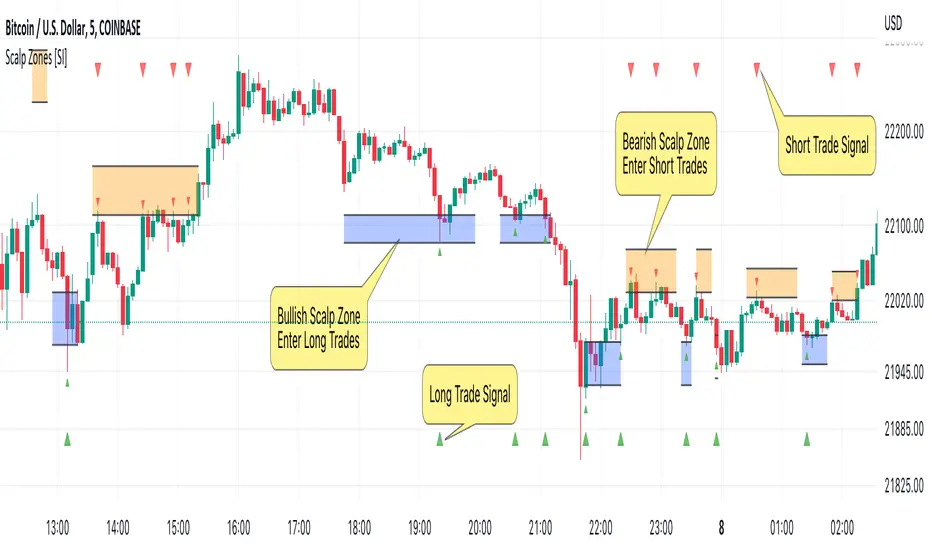
Scalp Zones [SI]The Scalp Zones indicator provides traders with visual ranges or "zones" on their charts, which can be used to quickly identify potential entry points for their trades in real time. Once price action enters the designated zone, trade signals and alerts will be generated, making it easier for both scalpers and swing traders to identify promising trading opportunities with greater confidence.
Although Scalp Zones is relatively easy to use, its simplicity is the end result of some interesting and rather complex analysis of price action and market structure.
█ CONCEPTS
Price Action vs Market Structure
For our purposes, “price action” refers to the movement of a security's price over time, whereas “market structure”, which is built upon price action, includes trends and support/resistance levels, breakouts, reversals of trend, etc. All of which can help traders identify potential entry and exit points for their trades.
Scalp Zone
A “Scalp Zone” is an area just above resistance or just below support that is deemed to be part of a trend that is exhausted or part of a “whipsaw” in the price action.
█ FEATURES
Can be combined with other indicators
Scalp Zones displays color-coded rectangles or "zones" that indicate areas of potential volatility, trend reversals and consolidation in price action. These zones can be used in conjunction with other indicators to more effectively identify trade opportunities.
Can also serve as an exit signal
Since Scalp Zones identifies areas where market participants are likely to enter or exit positions, they can offer some traders a way to spot good exits for their trades. For instance, if the price fails to surpass a significant resistance level (identified by a “scalp Zone”) and begins to decline, this may serve as a sell signal for traders who intend to lock in profits on a potential trend reversal.
Automatically adjusts to market conditions
Scalp Zones uses Average True Range (ATR) to dynamically adjust the size of the color-coded zones based on the current market conditions. By factoring in the ATR, the tool can produce zones that reflect the volatility of the market and adjust to changing levels of price movement.
█ LIMITATIONS
The Scalp Zones indicator is designed to provide traders with signals for potential entry points in the market, but it should not be used as the sole basis for making trading decisions. As with any trading indicator, it is important to acknowledge and understand that past performance does not guarantee future outcomes and that several other variables contribute to achieving success as a trader, especially proper risk management.
Ticker Ratio LevelsIndicator for constructing levels of price ratios from other tickers.
The user can choose from predefined tickers such as Gold(XAU), DXY, BTC, etc.
How it works:
Takes the important extremum of the closing candle from your current chart and builds a level based on the chart selected in the settings.
This function allows you to determine the price level based on the current price and the price at the time of a certain date. To do this, it first determines the time when the last candle before the specified date occurred. Then the price at the time of this candle and at the current moment is calculated. Finally, the price level is calculated relative to the price at the time of the candle. The result of this calculation will be the price level.
How to Use:
By default, the indicator is set to 1D for the BTC chart. But you can adjust any levels on the assets you are interested in.
You can adjust the levels both in the settings and by moving them around the chart.
Simply click on the indicator name or level, and vertical lines will appear, which you can drag to any location. (The vertical lines serve as the beginning of the calculation point)
Example of work on ETH paired with DXY.
Rail Line Levels [s3]Plots support/resistance lines based on a neutral signal (white portion) of the Rail Line (variable moving average) for a period of time designated by the user (defaults to 9 bars). Support/Resistance lines will be removed after a period of tests and can be determined by the user (defaults to 26). Support/Resistance is deemed not as important or strong after several touches or tests. The trailer uses a combination of the calculation for the Rail Line (variable moving average) and an ATR to show the overall trend direction.
The indicator is centered around a Variable Moving Average. The Variable Moving Average (VMA) is a study that uses an Exponential Moving Average being able to automatically adjust its smoothing factor according to the market volatility.
In addition to the VMA, the indicator makes use of the ATR which measures market volatility by decomposing the entire range of an asset price for that period. The true range is taken as the greatest of the following: current high less the current low; the absolute value of the current high less the previous close; and the absolute value of the current low less the previous close.

30 Second Futures Session Open RangeThis indicator displays 30 second opening ranges from Globex, Europe, and RTH sessions.
From the RTH session range, it also displays infinitely generating Price Targets based on a % of the opening range size.
I am retrieving the 30 second data using the new "request.security_lower_tf()" function.
The importance of these levels is based on the idea that when the market opens, algorithms establish their positions within the first 30 seconds.
These areas can also be seen as potential areas of support and resistance throughout the sessions.
Enjoy!

Fibonacci Levels Based on Supertrend [By MUQWISHI]A “ Fibonacci Levels Based on Supertrend ” indicator is supertrend indicator planned with Fibonacci retracements levels. Fibonacci retracements provides a sequence of levels starting from 0% to 100% in addition to extension levels. 0% is measured to be the initial Supertrend line, and 100% is the previous Supertrend line where it has been broken by candle. This tool could be valuable in terms of managing trades by setting targets and reducing the risk in the trend direction.
█ OVERVIEW
█ INDICATOR SETTINGS
Please let me know if you have any questions.
Thank you.

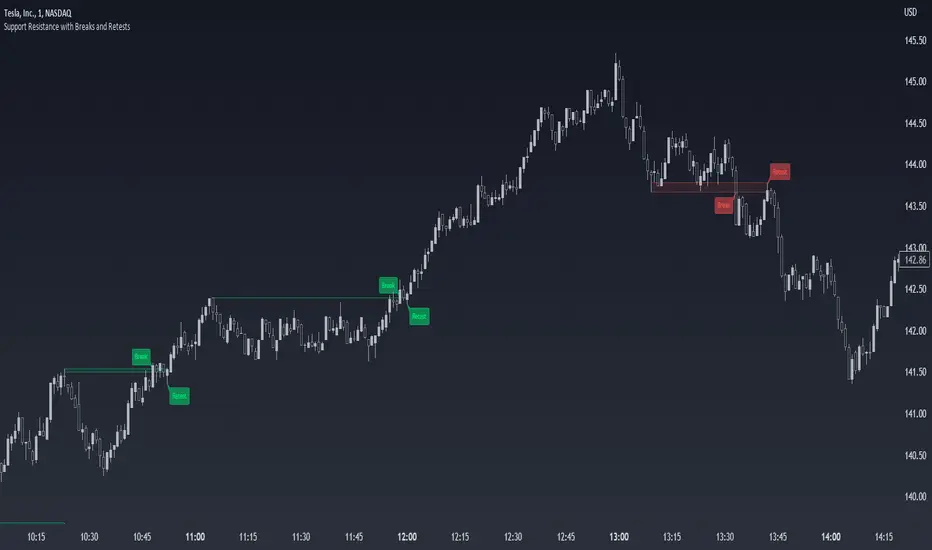
Support Resistance with Breaks and RetestsThe Break and Retest indicator strives to provide a visual aid for spotting areas of continuation and pullbacks. Support and resistance levels are drawn out automatically and have sequential conditions in place to determine a breakout following an eventual retest. Additionally, there are methods in place that try and detect liquidation events and still output a retest.
Although there are options to adjust repaint settings, "potential labels" are structured in a way to detect live ongoing retest events and therefore will be the only thing in the script that will be forced to repaint.
🔳 Settings
Lookback Range: Lookback period to trigger a new support/resistance level when pivot conditions are met.
Bars Since Breakout: How many bars since breakout in order to detect a retest.
Retest Detection Limiter: Whenever a potential retest is detected, the indicator knows that a retest is about to happen. In that given situation, this input grants the ability to raise the limit on how many bars are allowed to be actively checked while a potential retest event is active. For example, if you see the potential retest label, how many bars do you want that potential retest label to be active for to eventually confirm a retest?
🔳 Repaint Options
By default, the break and retest system uses the current close value to determine a condition. (Repaints by default)
On: Allows repainting
Off - Bar Confirmation: Prevents repainting and generates alerts when the bar closes. (1 candle later)
Off - High & Low: Prevents repainting, but in return utilizes both the high and low values instead of the close which may yield a higher outcome and inaccurate results.
🔳 How it works
In the background, calculations aren't searching for the perfect retest within the zone but instead focuses its attention towards price fluctuation around the zones. This allows the indicator to yield more results than it would otherwise.
The chart below provides an example of how potential retests are established. These are updated constantly until a retest is confirmed, and deleted if not. If a potential retest is active and the next candle drops below the value when the potential retest was detected, a retest is placed..
🔳 Alerts
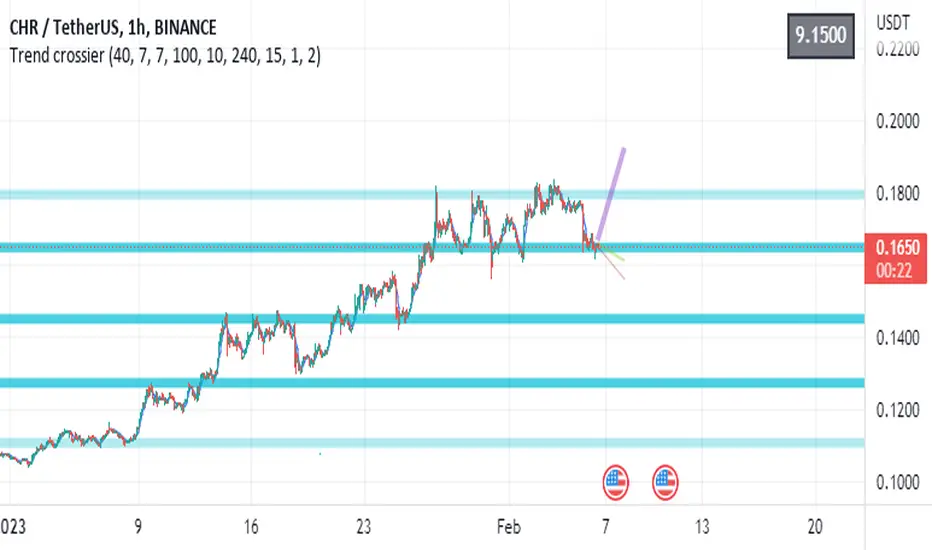
Trend crossierHello there!
I would like to share my script.
This is S/R levels indicator based on custom range for each step used for computing minimum/maximum of the range.
For example - we predefined step with 50 candles as one, after we have got the minimum and maximum of it - we come to the next 50 candles and do the same to it.
Finaly - we have got 20 lines for 10 steps.
After that - we set the ( SMA * mult) to have step between lines and if N of lines in range of step from eachother(if a+step > b and b+step > c ...) we call it a strong level.
It is not my idea(but my code), so I do not claim the uniqueness of this idea (the customer asked me to code it, but I also read about this method in open sources before).
The second thing - vectors of current trend direction on different timeframes.
For this task I took the same ranges, but ema () of each range. After first step it has an array with N values.
The next thing it does is take out "chain" one by one on each iteration. How does it do that? We take new AVG with neighbor values.
If we have 10 length at start - after iteration it becomes 9. So it repeats computing till length is 2.
After we have 2 points left - we can plot the line using indexes.
This way we can see the trend direction on different timeframes.
Feel free to use, change, put into another scripts. You can even never use it!
The right to publish this particular code was issued by the customer.
Have fun!
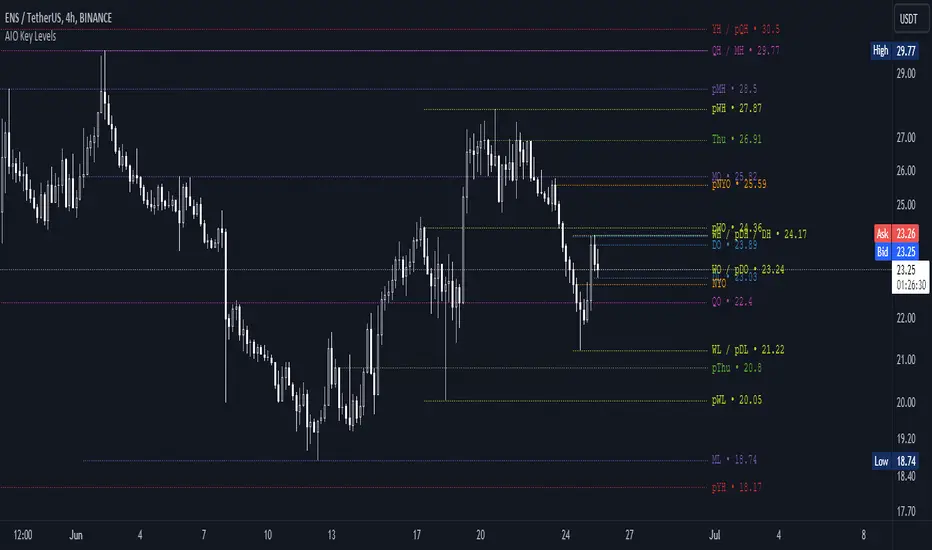
AIO Key LevelsAll In One Key Levels - Displays key levels for any type of chart.
Over 30 levels at your complete disposal.
Filled with a host of features that allow you to customise the appearance and display of the indicator to suit your individual trading style.
The result is a clear and concise indicator that helps traders easily identify key levels.
- The indicator is easy to use and does not need a detailed description.
- With customisable input parameters such as display style, line style, font style, offset, threshold and index.
- The colours for the key levels can also be customised.
- The script uses a 'switch' function and selected input parameters to set display, line and font styles.
- The key levels are constructed using the data received and the selected styles and colours.
- A unique cycle helps to improve the readability of the levels without "polluting" the graph with multiple labels
- In addition, I have left hints in the indicator to help you understand it better.
For Pine coders.
Why did I create it when there are many counterparts?
Simply because counterparts have very large and complex code and modest functionality and flex.
Here I have managed to fit it into 100 lines still readable.
You can learn how to call lots of lines and marks with just one function.
I also created a unique loop that connects labels if they are too close together for better visibility on a plot.
I have left detailed comments for each action.
I would be glad if someone could tell me how to make it more easier.
Candle LevelsCandle Levels
Allows chart levels to be plotted automatically, simply add tool to chart and the interactive mode will prompt for candle selection, timeframe anchor and some label choices such as displaying time, price or disabling labels altogether.
Also a note can be supplied that will be shown in the labels if they're displayed, if not it'll be up in the indicator values if those are enabled. Colors and individual labels can be customized, encourage saving over defaults for repeated usage.
Levels calculated:
Standard OHLC
Close to open mid point
High to low mid point
High wick mid point (either between close or open, whichever is higher)
Low wick mid point (either between close or open, whichever is lower)
I have plans to better detected levels and labels overlap to perhaps do something with that, for now manually toggling display of label should suffice.
I've tested with various markets such as futures, standard stock markets and also various higher and lower timeframes, if something is found to not be working please let me know.
Enjoy!
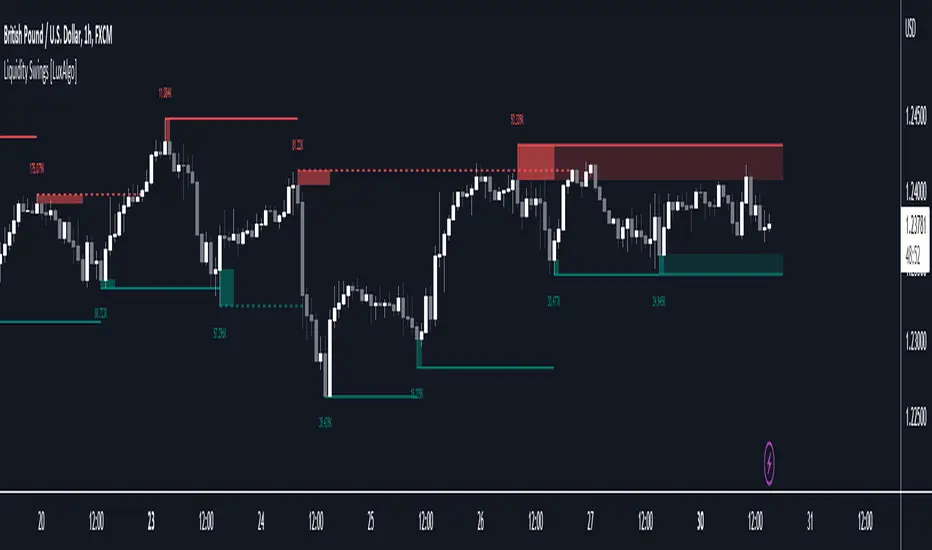
Liquidity Swings [LuxAlgo]The liquidity swings indicator highlights swing areas with existent trading activity. The number of times price revisited a swing area is highlighted by a zone delimiting the swing areas. Additionally, the accumulated volume within swing areas is highlighted by labels on the chart. An option to filter out swing areas with volume/counts not reaching a user-set threshold is also included.
This indicator by its very nature is not real-time and is meant for descriptive analysis alongside other components of the script. This is normal behavior for scripts detecting pivots as a part of a system and it is important you are aware the pivot labels are not designed to be traded in real-time themselves.
🔶 USAGE
The indicator can be used to highlight significant swing areas, these can be accumulation/distribution zones on lower timeframes and might play a role as future support or resistance.
Swing levels are also highlighted, when a swing level is broken it is displayed as a dashed line. A broken swing high is a bullish indication, while a broken swing low is a bearish indication.
Filtering swing areas by volume allows to only show significant swing areas with an higher degree of liquidity. These swing areas can be wider, highlighting higher volatility, or might have been visited by the price more frequently.
🔶 SETTINGS
Pivot Lookback : Lookback period used for the calculation of pivot points.
Swing Area : Determine how the swing area is calculated, "Wick Extremity" will use the range from price high to the maximum between price close/open in case of a swing high, and the range from price low to the minimum between price close/open in case of a swing low. "Full Range" will use the full candle range as swing area.
Intrabar Precision : Use intrabar data to calculate the accumulated volume within a swing area, this allows obtaining more precise results.
Filter Areas By : Determine how swing areas are filtered out, "Count" will filter out swing areas where price visited the area a number of time inferior to the user set threshold. "Volume" will filter out swing areas where the accumulated volume within the area is inferior to the user set threshold.
🔹 Style
Swing High : Show swing highs.
Swing Low : Show swing lows.
Label Size : Size of the labels on the chart.
Note that swing points are confirmed after Pivot Lookback bars, as such all elements are displayed retrospectively.
Fibonacci Breakout Target LevelsFibonacci Extension
Fibonacci Extension is a powerful technical analysis tool that traders use to predict where the market might find support and resistance. It is based on the Fibonacci sequence and uses levels that are found by extending the 23.6%, 38.2%, 50%, 61.8%, and 100% Fibonacci ratios from a swing high or low. These levels can be used to find possible areas of support and resistance, and traders often use them to figure out when to get into or get out of a trade.
What does this indicator do?
This indicator gets five levels of the Fibonacci Extension and uses it for both the low and the high. The default lookback period is 10 days, and it checks for the highest and lowest price in that period. Then it calculates the extension levels and plots them, and it also adds a line that shows you the current breakout target levels.
How to use?
The primary use intended for this indicator is to be used to determine possible breakout target levels. Let's say you are trading a range and a breakout happens. You can use this indicator to determine possible take-profit zones and possible support and resistance zones.
Features:
Change the lookback period for the Fibonacci Extension levels.
Disable the Fibonacci Bands if you just want to see the FIB levels.
You can also change the 5 levels and add different Fibonacci numbers.
In this image, you can see how you can use this indicator to determine take-profit levels. The Fibonacci Extensions will determine potential support and resistance levels, which could be good places to exit your long or short positions.

Lines and Table for risk managementABOUT THIS INDICATOR
This is a simple indicator that can help you manage the risk when you are trading, and especially if you are leverage trading. The indicator can also be used to help visualize and to find trades within a suitable or predefined trading range.
This script calculates and draws six “profit and risk lines” (levels) that show the change in percentage from the current price. The values are also shown in a table, to help you get a quick overview of risk before you trade.
ABOUT THE LINES/VALUES
This indicator draws seven percentage-lines, where the dotted line in the middle represents the current price. The other three lines on top of and below the middle line shows the different levels of change in percentage from current price (dotted line). The values are also shown in a table.
DEFAULT VALUES AND SETTINGS
By default the indicator draw lines 0.5%, 1.0%, and 1.5% from current price (step size = 0.5).
The default setting for leverage in this indicator = 1 (i.e. no leverage).
The line closest to dotted line (current price) is calculated by step size (%) * leverage (x) = % from price.
Pay attention to the %-values in the table, they represent the distance from the current price (dotted line) to where the lines are drawn.
* Be aware! If you change the leverage, the distance from the closest lines to the dotted line showing the current price increase.
SETTINGS
1. Leverage: set the leverage for what you are planning to trade on (1 = no leverage, 2 = 2 x leverage, 5 = 5 x leverage...).
2. Stepsize is used to set the distance between the lines and price.
EXAMPLES WITH DIFFERENT SETTINGS
1) Leverage = 1 (no leverage, default setting) and step size 0.5 (%). Lines plotted at (0.5%, 1%, 1.5%, and –0.5%, –1%, –1,5%) from the current price.
2) Leverage = 3 and stepsize 0.5(%). Lines plotted at (1.5%, 3.0%, 4.5%, and –1.5%, –3.0%, –4.5%) from the current price.
3) Leverage = 3 and stepsize 1(%). Lines plotted at (3%, 6%, 9%, and –3%, –6%, –9%) from the current price.
The distance to the nearest line from the current price is always calculated by the formula: Leverage * step size (%) = % to the nearest line from the current price.

Support Resistance - Dynamic v2 w/ Timeframe optionThis script is a modification from the awesome "Support Resistance - Dynamic v2" by @LonesomeTheBlue
This script is very similar to the original indicator mentioned above, but with a modification that, in my opinion, would be very useful for many traders. It enables the option to choose different timeframe to calculate the S/R levels. Very often, traders would like to use higher timeframes to define S/R levels, rather than using the same timeframe that they are trading at. For example, if trading at 5min, we often use 15min, 30min or 1hr timeframe to define our S/R levels.
For example, below shows S/R levels from three different timeframes:
Hope you find value in this indicator~ Enjoy~
OHLC ToolOHLC Tool allows you to display Current or Historical OHLC Values as horizontal lines that extend to the right on your chart.
Features
Variable Lookback to display a specific historical bar's values. Default = 1 (Previous Candle)
Customizable Timeframe to view HTF Candle values.
Custom Line Colors, Styles, and Thicknesses.
Price Scale Value Display Capability.
For displaying the line values and labels on the price scale you will need to enable:
"Indicator and financials name labels"
and
"Indicator and financials value labels"
These options are found in the Price Scale Menu under Labels. Price Scale Menu > Labels
When you do this you will notice your other indicator values will also be on the price scale,
if you wish to disable these, go to the indicator settings under the "Style" Tab, Uncheck the "Labels on price scale" box.
Indicator Settings > Style > "Labels on price scale"
Enjoy!

Big Poppa Code Strat & Momentum Strategy IndicatorThis indicator is a combination of a few things in order to work with a unique trading style gleaned from Callme100k, jrgreatness, TrustMyLevels , FaithInTheStrat, Rob Smith and Saty Mahajan.
This Indicator is created to help you day trade using, ATR Fibonacci Levels, Price Action and Momentum.
It displays Fibonacci Levels Based on ATR to indicate when a security is 0.236, 0.382 +- the Days Open, +- the Days Open, 0.618 +- the Days Open and 1.0 +- Days Open.
To understand this script you need to understand
Average True Range (ATR)
1 Bar Inside Bar
2 Bar Outside Bar (Break either the top or bottom)
3 Bar Engulfing Bar
Strat Setups - 212, 322, 312
Fibonacci - 0.236, 0.382, 0.618, 1.0
Moving Averages
A Trend is considered bullish when (green)
Current Price is greater than the Fast EMA Value (8)
Fast EMA is greater than PIVOT EMA Value (21)
Pivot EMA is greater than SLOW EMA Value (34)
OR Hull is trending up and the Price is above the Volume Weighted Moving Average and price is above VWAP
A trend is considered Bearish when (red)
Current Price is less than the Fast EMA Value (8)
Fast EMA is less than PIVOT EMA Value (21)
Pivot EMA is less than SLOW EMA Value (34)
OR Hull is trending down and the Price is below the Volume Weighted Moving Average and price is below VWAP
If these conditions are not met then the Momentum is in Conflict (orange)
The Momentum band will match the color of the current trend
The table that is present can be turned off at any time lets you see
1) If Moving Averages are showing bullish, bearish or in conflict
2) If There us Time Frame Continuity, (if 5 min up, are all the other timeframes up also)
3) How much of the ATR have we moved on the day
4) Are we in Call or Put range for the day based on ATR Fib Levels
The Ideal situation for entering a call
1) Momentum is Green
2) FTFC on Green
3) A Strat Actionable Signal is present
4) You are in the call range, 0.236 - 0.618 ATR + the Price
5) The ATR still has room, I.e only 50% of the ATR has been run already
Ideal situation from entering a put
1) Momentum is red
2) FTFC on Red
3) A Strat Actionable Signal is present
4) You are in the put range, 0.236 - 0.618 ATR - the Price
5) The ATR still has room, I.e only 50% of the ATR has been run already
Exit the trade for these reasons you entered (for profit or loss)
1) ATR has no more room
2) FTFC is now in conflict
3) Momentum has shifted
Take Profit when
1) You reach a new ATR Level 0.618, 1.0 , -0.618, -1, etc
Passive Stop Loss
1) Open Price if you are aggressive
2) Next ATR Level Down or Up
Feel free to take profit and leave runners
This script does not give signals, you should do your own research, I am not a financial advisors, I am simply applying principles of seasoned veterans to code. You make all decisions about how you buy, sell and trade. The creator of this script makes no promises and takes no responsibility for your personal trading.
To research the methods described above look up
Rob Smith : The Strat
Saty Mahajan : ATR Levels
Fibonacci
Using the HULL Moving Average
Exponential Moving Averages
VWAP
VWMA

VIX Rule of 16There’s an interesting aspect of VIX that has to do with the number 16. (approximately the square root of the number of trading days in a year).
In any statistical model, 68.2% of price movement falls within one standard deviation (1 SD ). The rest falls into the “tails” outside of 1 SD .
When you divide any implied volatility (IV) reading (such as VIX ) by 16, the annualized number becomes a daily number
The essence of the “rule of 16.” Once you get it, you can do all sorts of tricks with it.
If the VIX is trading at 16, then one-third of the time, the market expects the S&P 500 Index (SPX) to trade up or down by more than 1% (because 16/16=1). A VIX at 32 suggests a move up or down of more than 2% a third of the time, and so on.
• VIX of 16 – 1/3 of the time the SPX will have a daily change of at least 1%
• VIX of 32 – 1/3 of the time the SPX will have a daily change of at least 2%
• VIX of 48 – 1/3 of the time the SPX will have a daily change of at least 3%
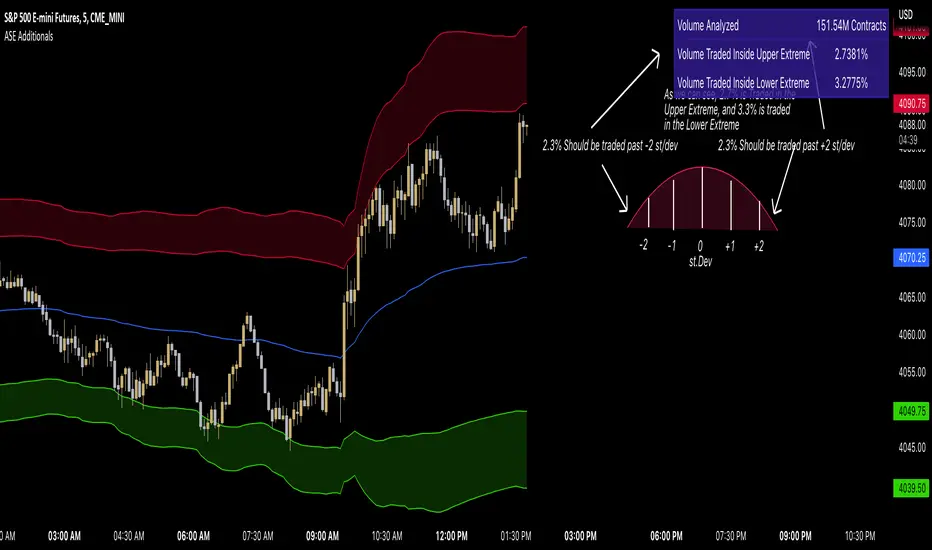
ASE Additionals v1ASE Additionals is a statistics-driven indicator that combines multiple features to provide traders with valuable statistics to help their trading. This indicator offers a customizable table that includes statistics for VWAP with customizable standard deviation waves.
Per the empirical rule, the following is a schedule for what percent of volume should be traded between the standard deviation range:
+/- 1 standard deviation: 68.26% of volume should be trading within this range
+/- 2 standard deviation: 95.44% of volume should be trading within this range
+/- 3 standard deviation: 99.73% of volume should be trading within this range
+/- 4 standard deviation: 99.9937% of volume should be trading within this range
+/- 5 standard deviation: 99.999943% of volume should be trading within this range
+/- 6 standard deviation: 99.9999998% of volume should be trading within this range
The statistics table presents five different pieces of data
Volume Analyzed: Amount of contracts analyzed for the statistics
Volume Traded Inside Upper Extreme: Calculated by taking the amount of volume traded inside the Upper Extreme band divided by the total amount of contracts analyzed
Volume Traded Inside Lower Extreme: Calculated by taking the amount of volume traded inside the Lower Extreme band divided by the total amount of contracts analyzed
Given the user’s inputs, they will see the upper and lower extremes of the day. For example, if the user changed the inner st. dev input to 2, 95.44% of the volume should be traded within the inner band. If the user changed the outer st. dev input to 3, 99.73% of the volume should be traded within the outer band. Thus, statistically, 2.145% ((99.73%-95.44%)/2) of volume should be traded between the upper and lower band fill.
In the chart above, the bands are the 2nd and 3rd standard deviation inputs. We notice that out of the 151 Million Contracts , the actual percentage of volume traded in the upper extreme was 2.7% , and the actual percentage of the volume traded in the lower extreme was 3.3% . Given the empirical rule, about 2.145% of the volume should be traded in the upper extreme band, and 2.145% of the volume should be traded in the lower extreme band. Based on the statistics table, the empirical rule is true when applied to the volume-weighted average price.
The trader should recognize that statistics is all about probability and there is a margin for error, so the bands should be used as a bias, not an entry. For example, given the +/-2 and 3 standard deviations, statistically, if 2.145% of the volume is traded within the upper band extreme, you shouldn’t look for a long trade if the current price is in the band. Likewise, if 2.145% of the volume is traded within the lower band extreme, you shouldn’t look for a short trade if the current price is in the band.
Additionally, we provide traders with the Daily, Weekly, and Monthly OHLC levels. Open, High, Low, and Close are significant levels, especially on major timeframes. Once price has touched the level, the line changes from dashed/dotted to solid.
Features
VWAP Price line and standard deviation waves to analyze the equilibrium and extremes of the sessions trend
Previous Day/WEEK/Month OHLC levels provide Major timeframe key levels
Settings
VWAP Equilibrium: Turn on the VWAP line
VWAP Waves: Turn on the VWAP standard deviation waves
Inner St. Dev: Changes the inner band standard deviation to show the percentage of volume traded within
Outer St. Dev: Changes the outer band standard deviation to show the percentage of volume traded within
Upper Extreme: Change the color of the upper VWAP wave
Lower Extreme: Change the color of the lower VWAP wave
Wave Opacity: Change the opacity of the waves (0= completely transparent, 100=completely solid)
Statistics Table: Turn on or off the statistics table
Statistics Table Settings: Change the Table Color, Text Color, Text Size, and Table Position
Previous Day/Week/Month OHLC: Choose; All, Open, Close, High, Low, and the color of the levels
OHLC Level Settings: Change the OHLC label color, line style, and line width
How to Use
The VWAP price line acts as the 'Fair Value' or the 'Equilibrium' of the price session. Just as the VWAP Waves show the session's upper and lower extreme possibilities. While we can find entries from VWAP , our analysis uses it more as confirmation. OHLC levels are to be used as support and resistance levels. These levels provide us with great entry and target opportunities as they are essential and can show pivots in price action.
Fixed Fibonacci Support ResistanceI took the formula of the fibonacci from LonesomeTheBlue and made this script. You can take a look at his indicator here:
When you first add the indicator on the chart, click on the chart to select the first date and then the second date. It will then calculate the fibonacci support and resistance of the range you choose. You can also choose the date inside the inputs.
Be sure the first date is before the second date, otherwise it won't be able to show the fibonacci. If that happen, choose a correct date in the inputs.
Session High and Low IndicatorThis script is meant for stocks that have a pre-market session. It is meant to be used on the 1 min time frame. This script will draw a green line at the high of pre-market, and a red line at the low of pre-market and extend these lines across the regular session day
This makes it easy to see if price action during regular market has broken above pre-market high or broken below pre-market low.
The high/low skips any quick spikes in price action (similar to what happens at 8:30 am every day).

Liquidation Levels v2 [LG]The main premise of this indicator is to identify when large cryptocurrency futures positions are opened, and then plot the liquidation levels of those positions. Market makers know this data and tend to push price towards these levels, as there is guaranteed liquidity at or approaching those levels.
Remember, we want to buy when others are forced to sell, not when they want to sell, and vice versa. Whales want to position, but need to do so in areas of larger liquidity, as they want to minimize slippage and detection as much as possible.
This indicator is very useful during times of chop, when the market is taking liquidity anywhere it exists as whales are forcing retail players out of their positions.
This indicator will also plot where positions with a total value in excess of the user-defined threshold are opened or closed, so you are able to better gauge how market participants are reacting to price levels.
Commonly used leverage levels are 100x, 50x, and 25x, but can be adjusted by the user depending on what they are noticing is attracting price levels.
This indicator is recommended for use on the 1 minute chart of the Binance BTCUSD perpetual contract pair. This will allow for as much precision as possible for the majority of users. Note: The only supported coin at this point is BTC - other coins to follow soon.
SUMMARY
1) View liquidation levels of large positions opened
2) View exact moments where large positions are opened or closed
3) Gauge available liquidity to upside or downside to better assist in determining longer term reversal points
COMING SOON
1) Additional coins
2) VPVR inspired vertical histogram or other visualization tool summarizing total available liquidity at specific price level
3) Total delta of available long and short liquidity
4) Push notifications when price takes liquidity
5) Requests as outlined in the comments
This indicator was inspired by the Hyblock Capital liquidation levels and offers an improvement upon the popular existing Liquidation Levels indicator by mlapplications.
