Pine Script® Indikator
Color

Stochastic color PMF alert [PlungerMen]The Stochastic Oscillator is a range bound momentum oscillator.
The Stochastic indicator is designed to display the location of the close compared to the high/low range over a user defined number of periods.
Typically, the Stochastic Oscillator is used for three things: Identifying overbought and oversold levels, spotting divergences and identifying bull and bear set ups or signals.
Pine Script® Indikator
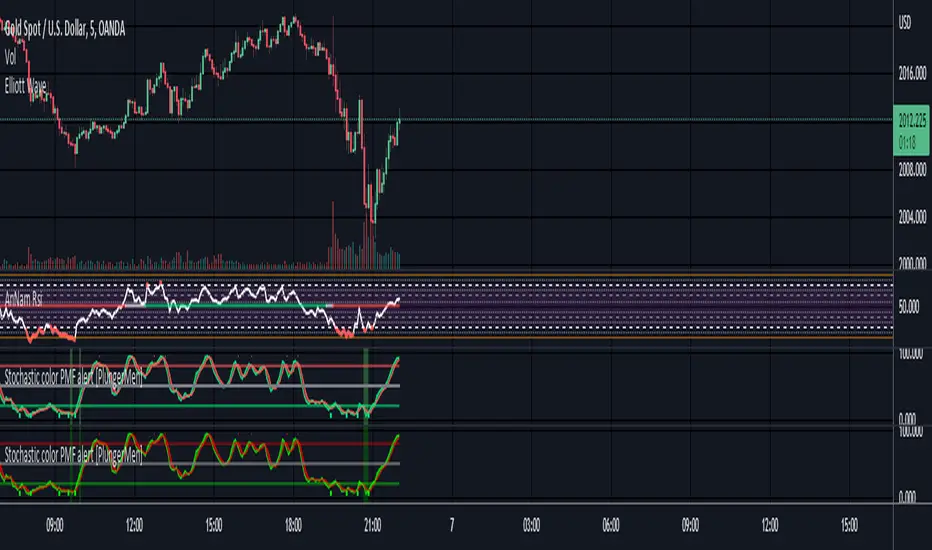
RSI BAR COLOR (KETT)RSI BAR COLOR
1) White - looking for a long
2) Orange - looking for a short
3) Gray - think
//-----------
1) Белый - ищем вход в LONG
2) Оранжевый - ищем вход в SHORT
3) Серый - думаем
Pine Script® Indikator
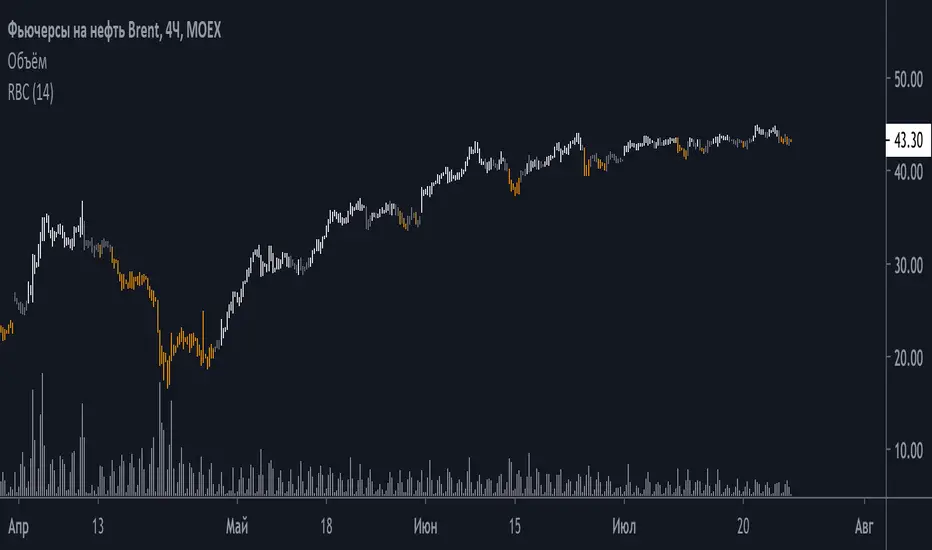
Volume Color Bar (KETT)Highlights important bars with increased volume during the selected period. It is convenient to use for building a trend line or strong levels.
Pine Script® Indikator

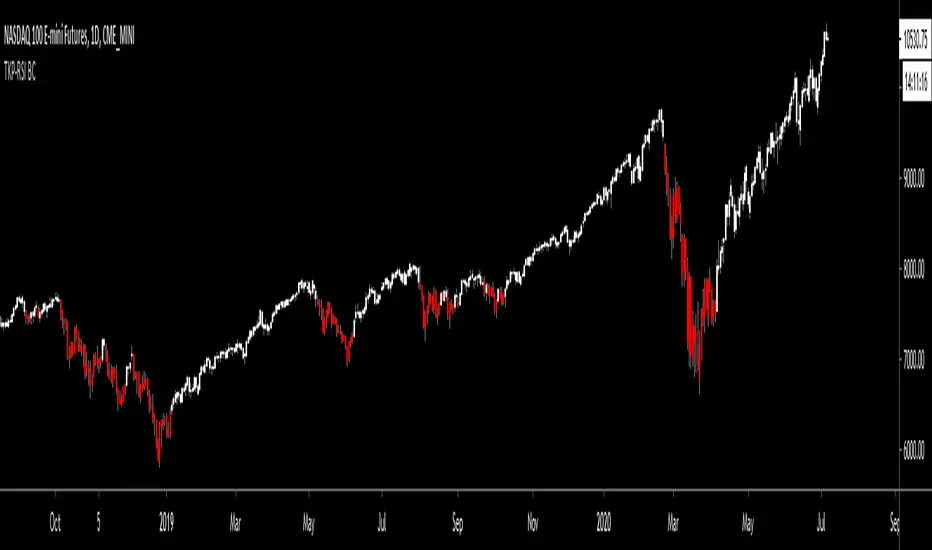
TKP RSI BAR COLORThis script was influenced by Scilentor's- "RSI Bar Colors / Scilentor". I improved upon the Idea by adding the ability to change the full range of RSI (Between 0 through 100) to any color you want within 5 point increments.
Traditional use of RSI is to use it as an "Overbought" and "Oversold" indicator. A more uncommon/unknown use, especially among new traders, is to use is as a "Momentum" indicator. I personally like to look for stocks where RSI>50
Default settings are set to color all bars red when below 50, and white when above 50, but try for your self setting different colors above 70, and below 30 to better see overbought and oversold conditions. I got a lot of requests for this script and I hope it helps you in your trading journey :-)
Pine Script® Indikator
Candle Color GeneratorCandle Color Generator:
This indicator is designed to highlight the candle colors based on the combinations of Parabolic SAR (PSAR) and 2 Hull Moving Averages (HMA).
Colors:
Yellow, Red, and Green colors are used to describe the candle colors depends on its position to PSAR and 2 HMAs.
PSAR:
PSAR position above or below candle position is differentiated by Red and Green colors
HMAs:
As default settings 20 HMA is considered as lower period and 50 HMA is considered period for the calculation
Trade What You See:
This indicator will help to see how the setup of particular instrument coming up. Users/Traders can use and trade based on what they see and interpret from it.
Disclaimer:
Idea of publishing this script is to identify the strength of the instrument using multiple confirmation.
Using this indicator, changing inputs (show/hide/change period), and trading decisions are up to the users/traders.
Courtesy:
Thanks to inventors of HMA (Alan Hull), PSAR(Welles Wilder) as these inputs are used to make some calculations
Pine Script® Indikator

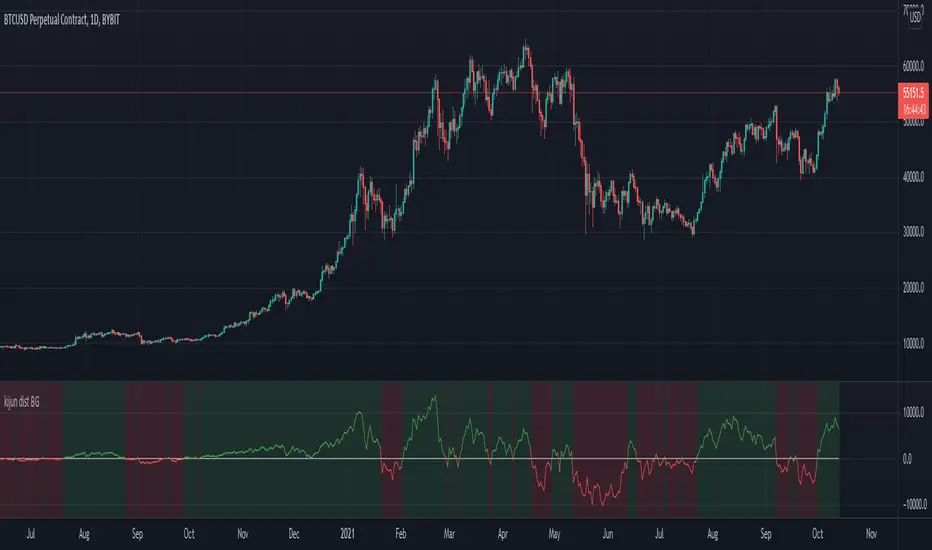
Kijun-Price DistanceThis script shows optional:
- distance between close price and Kijun-Sen
- distance btween Tenkan-Sen and Kijun-Sen
- Background color of current time frame
- Background color of the next higher time frame
Pine Script® Indikator
Multi MA on candlestick volume indicatorUses 5 volume moving averages to change the candlestick color depending on how high above average volume is.
The volumes plotted at the bottom of the chart are set to the same settings as the indicator, you can see the volume bars that stick higher above the orange moving average are a different color on the chart to the smaller ones.
Any volume bar that is below the moving average is colored purple.
Pine Script® Indikator

[LunaOwl] Rainbow Color Gradient作品: 色彩漸變-彩虹帶
This script is about rainbow color gradient, there are 35 colors from red to purple. The color changes with the time series, from light to dark, and then to light, repeat. Maybe it's visually beautiful. Compared to practicality, I prefer to use it as a color gradient reference. for the later works.
色彩漸變彩虹帶,從紅到紫有35種色調,隨著時間序列進行而變化,由淺到深再到淺,或許視覺上很美。
相比於實用性,我覺得應該當成色彩漸層的參考,對於以後作品可以使用上。
--------------------------*
The changing process of the rainbow (resolution = 63).
彩虹帶的時序變化過程,分辨度是63格,充滿 (✪ω✪) 圖表藝術!
Pine Script® Indikator

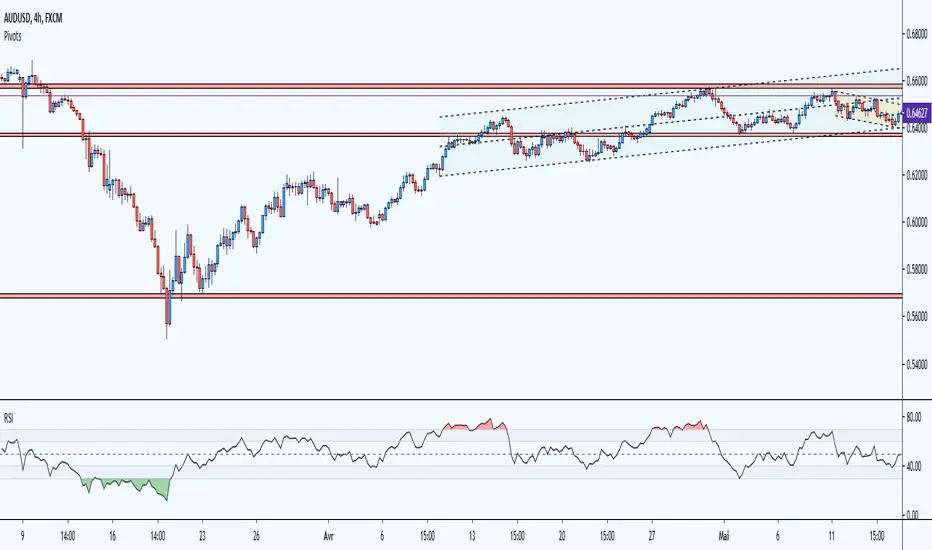
RSI Multicolor editableEN:
RSI with overbought and oversold area in color and editable level. visually more interesting than the basic version the overbought and oversold areas catch the eye quickly. Depending on the strategies and your personal use of the RSI, you can modify all the lines and add colors to each defined zone.
overbought zone, oversold and editable noise zone
I wanted to have a modifiable RSI like some trading platforms.
please excuse me for my english and my code, i'm just getting started.
FR:
RSI avec zone de surachat et survente en couleur et niveau éditable. visuellement plus intéressant que la version basique les zones de surachat et survente attirent l’œil rapidement. Selon les stratégies et l'utilisation personnel que vous faite du RSI, vous pouvez modifier toutes les lignes et ajouter des couleurs à chaque zone défini.
zone de surachat, survente et zone de bruit éditable
je souhaitais avoir un RSI modifiable comme certaines plateforme de trading.
veuillez m'excuser pour mon anglais et mon code, je débute.
Pine Script® Indikator
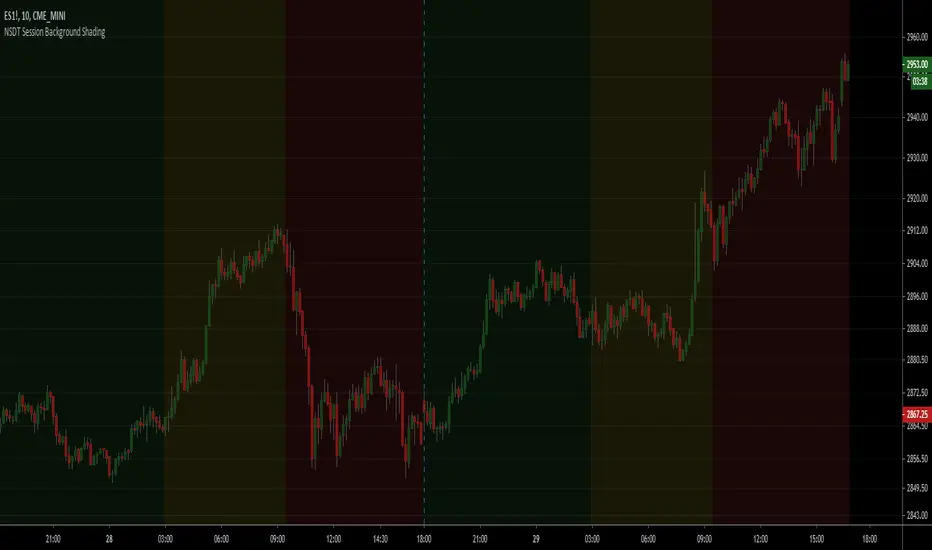
NSDT Session Background ShadingA simple script to add background colors to specific timeframes. Great for trading futures so you can separate sessions for easier viewing. Use for stocks to separate pre, open, and post market times.
There are three timeframes that can be set and all colors can be modified.
Pine Script® Indikator
How To Color Prior BarsExample how to color the trigger bar of the condition and n-1 prior bars using only 1 barcolor() function.
Currently when offsets are used in barcolor(), bgcolor(), plot(), plotarrow(), plotchar(), or plotshape(), the offset only works with a simple (static) integer. If series (dynamic) integers are used instead, there is not an error, but the series values are ignored. Because of this limitation of offset being constrained to using only fixed offsets, the normal way to paint 3 Black Crows would be to use 3 barcolor() functions. Since there are a known number of bars to be painted in that scenario, this can be easily accomplished.
If a condition encompassed a variable length of n bars, then the number of barcolor() functions needed to use would be unknown. How to color the trigger bar of the condition and n-1 prior bars using only 1 barcolor() function? Dual examples below solves issue but requires n "future" bars, because of this it will not paint the most recent condition in realtime and may not be applicable for use in certain realtime situations. It paints similar in behavior to how a pivot does. Special thanks to LucF and RicardoSantos for illumination!
NOTICE: This is an example script and not meant to be used as an actual strategy. By using this script or any portion thereof, you acknowledge that you have read and understood that this is for research purposes only and I am not responsible for any financial losses you may incur by using this script!
Pine Script® Indikator

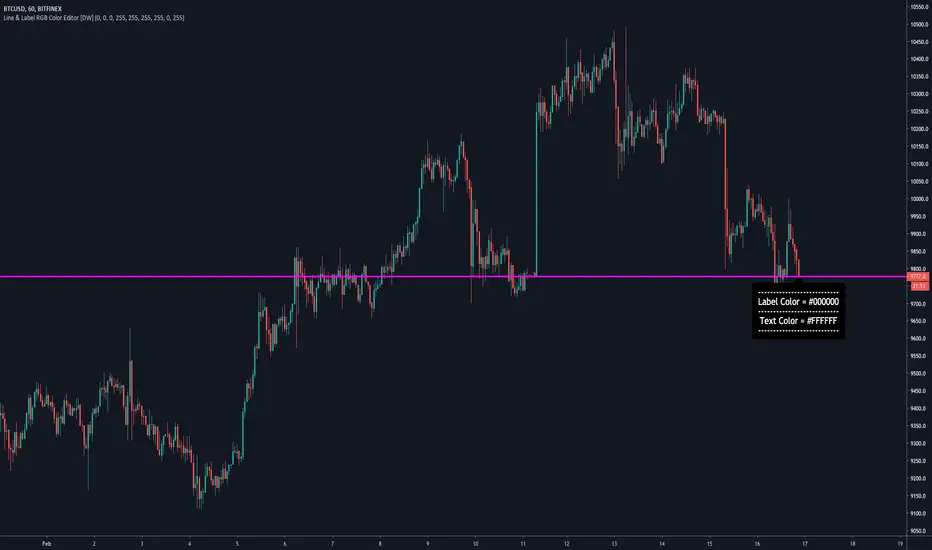
Line & Label RGB Color Editor [DW]This script is a template designed to provide developers with UI color customization for v4 lines and labels.
The color pallete used within this script is a full spectrum "web safe" format with 216 colors to choose from.
Colors are easily modified via the RGB inputs. The designated color selector function takes in the RGB values and returns the corresponding hex color.
Transparency can be modified as well. However, the color.new function only supports constant integers for transparency value, so it has to be manually adjusted within the code.
On line 42, you'll see a variable within the color selector function named trans. This is the transparency value, which can be set to any integer from 0 to 100. I have it set to 0 by default.
I included a sample label to demonstrate how the color editor works. It also displays the hex codes for the current label and text colors for some additional reference.
Implementing this in your own script is pretty straightforward.
All you need to do is copy the color selector function and inputs (feel free to name them whatever you want) into your desired script. Then, you can use them to declare your color variables.
Pine Script® Indikator
Multicolor Bollinger Bands - Market PhasesHi everyone
Hope you're all doing well 😘
Today I feel gracious and decided to give to the community. And giving not only an indicator but also a trading method
This trading method shows how a convergence based on moving averages is tremendous
Multicolour Bollinger Bands indicator that indicates market phases.
It plots on the price chart, thanks to different color zones between the bands, a breakdown of the different phases that the price operates during a trend.
The different zones are identified as follows:
- red color zone: trend is bearish, price is below the 200 periods moving average
- orange color zone: price operate a technical rebound below the 200 periods moving average
- yellow color zone: (phase 1 which indicate a new bearish cycle)
- light green zone: (phase 2 which indicate a new bullish cycle)
- dark green zone: trend is bullish, price is above the 200 periods moving average
- grey color zone: calm phase of price
- dark blue color zone: price is consolidating in either bullish or bearish trend
- light blue zones: price will revert to a new opposite trend (either long or short new trend)
By identifying clearly the different market phases with the multicolor Bollinger bands, the market entries by either a the beginning of a new trend or just after a rebound or a consolidating phase is easier to spot on.
Trade well and trade safe
Dave
Pine Script® Indikator

CryptoJJ - SSL indicatorThe SSL indicator with colour change. Tool for spotting trends and finding good entry points. I recommend using it for higher timeframes, from 4h to 1D.
Play with the settings, you can change the moving avarage type, its length, if you prefer having the default
bar colours in your chart, disable the colouring function in the script.
Good luck crypto traders!
CryptoJJ
Pine Script® Indikator

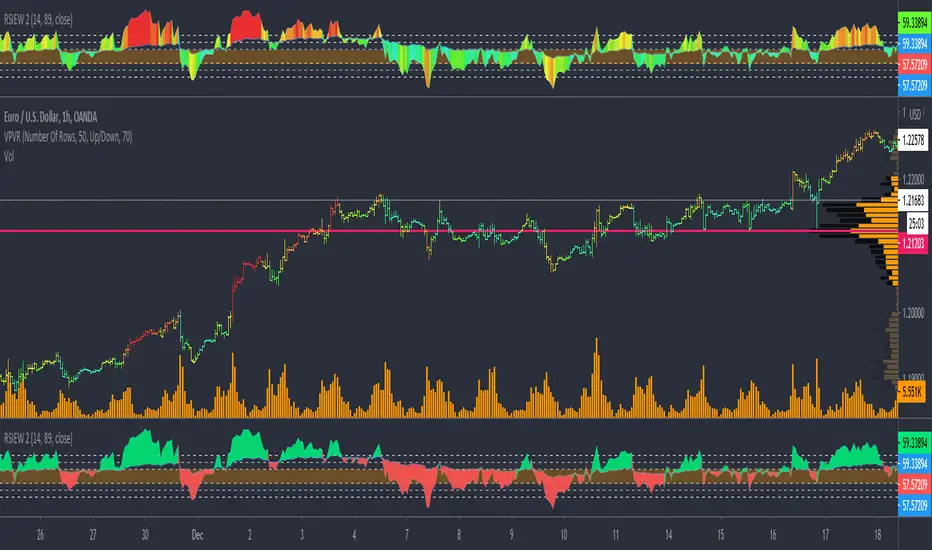
RSIEW V2 Thermal Falsecolor show Hot (Impulse) Cold (Correction)HI BIG PLAYER AROUND THE WORLD,
here is my new creation of modified RSI Indikator.
In order to the RSIEW Version 1 (look below this text) I build a thermal rainbow chart that shows the spectrum with all overbought and oversell phases. The colour spectrum can be compared with a thermal imaging camera.
In one hand, the hottest candles (going into red) show the extrem points of the chart. In trend direction this is often wave 3 of Elliott Waves theory and in correction phase it show the bounce period.
In other hand, the coldest candles (going into blue) show the weak points of the chart. In trend direction this is often a "cooling down" and in big correction phases it demonstrate frozen prices (really unattractive trading time).
Have fun with this and give me a feedback.
Of course, you are invited to follow me.
KIND REGARDS
NXT2017
Pine Script® Indikator
Pine Script® Indikator

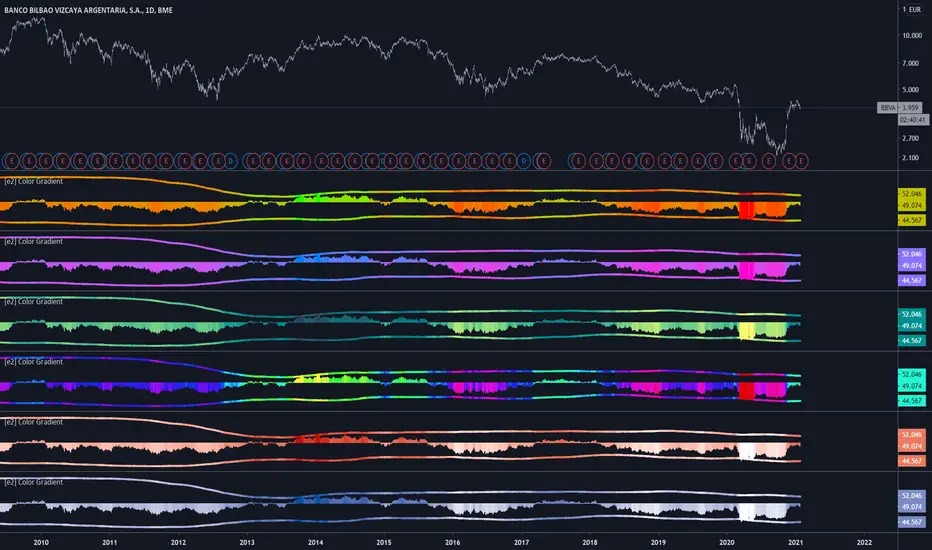
[e2] Color Gradient Function20 step red/green gradient function
The color gradient function allow colorize any source in 5% steps.
Define the source, minimum and maximum value (constant or , for example, bb (or any other channel)).
Pine Script® Indikator
Polychromatic Pine MagicFor all Pine Script enthusiasts out there, I present my "Polychromatic Pine Magic" employing PSv4.0. This is NOT an indicator, and I would describe it as an articator that absolutely doesn't indicate anything at all. It's just a display of the " Power of Pine " to inspire other developers and maybe a few members or possibly non-members debating switching platforms to TV. I have long pondered this script as a goal, starting about a year ago, and was unable to conceive of how I might replicate my member avatar in Pine Script... until now!
With recent changes to Pine color, I wanted to explore how far I could take color with Pine. Writing this color coding over the course of a few hours by employing over a hundred separate colors in hex(#XXXXXX) combined with a large amount of conditional ternary operators(?:) in succession, Pine Script version 4.0 seems to handle this monster color script with ease surprisingly. I didn't provide this open source because implementing this kind of color technology would be a burden on the TV servers if everyone started making indicators like this. Sorry in advance, to those of you who are code hungry. Maybe in the future when TV has an abundance of cloud computing power, I shall release it, but I only foresee that occurring in quite a few years to a decade from now.
I would personally like to thank the talented individuals at TV for recently providing us with outstanding color functionality, enabling this pleasing eye candy display above.
Included are a few adjustments listed below for "Settings" that seem fun to play with, for those of you who are curiously minded. I figured that I should have it do something, in order to receive any thumbs up for this script. Imagery is great, but mutating imagery is a short lived thrill to enjoy.
Features List Includes:
"Period" adjustment
"Mutate Color Fill" tweak
"Transparency" control
Showcased in the chart below is my free to use "Enhanced Schaff Trend Cycle Indicator", having a common appeal to TV users frequently. The comments section below is solely just for commenting and other remarks, ideas, compliments, etc... regarding only this indicator, not others. If you do have any general questions or comments regarding this indicator, I will consider your inquiries, thoughts, and ideas presented below in the comments section, when time provides it. As always, "Like" it if you simply just like it with a proper thumbs up, and also return to my scripts list occasionally for additional postings. Have a profitable future everyone!
Pine Script® Indikator

2 Moving Average Color Direction Detection 2 Moving Average Color Direction Detection, possibility to configure:
- Type: SMA , EMA , WMA , VWMA , SMMA , DEMA , TEMA , HULLMA, ZEMA, TMA, SSMA
- Lenght
- Source
- Color direction
Pine Script® Indikator

Triple Moving Average HeatmapHi everyone
I didn't publish on Friday because I was working on an Expert Advisor in MT4. The day I don't publish, some scripts spamming guys published many (not useful) scripts the same to kick me out of the TOP #1 ranking.
So what I'm going to do about it? crying or sharing more quality scripts than before? :)
I guess you know the answer :) I'm gonna share a few quality scripts that I have in my library. I noticed that you guys tend to like more the scripts useful for your trading actually making you money rather than a copy-paste (of another copy-paste)
Alright, enough for the trolling now let's introduce the Three MA heatmap which is an upgrade of that script : MA-heatmap-Double-cross-edition/
The challenge was to keep the heatmap not rolling and to make it match with the MA cross. I did it using this
```
since_ma_buy = barssince(macrossover)
since_ma_sell = barssince(macrossunder)
heatmap_color() =>
since_ma_buy < since_ma_sell ? color.new(color.green, 20) : since_ma_buy > since_ma_sell ? color.new(color.red, 20) : na
```
This is a technique that I found after drinking three glasses of red wine (#french) to keep the heatmap stable and not rolling.
To get what I'm saying I invite you to replace the piece of code above by what everyone would normally do
```
heatmap_color() =>
macrossunder() ? color.new(color.green, 20) : macrossover() ? color.new(color.red, 20) : na
```
Ah and I'm not done sharing for the day, a few scripts are coming also after that one and tonight !!!!! I want to live in a world where you guys can enjoy quality scripts (mostly) :)
PS
____________________________________________________________
Feel free to hit the thumbs up as it shows me that I'm not doing this for nothing and will motivate to deliver more quality content in the future.
- I'm an officially approved PineEditor/LUA/MT4 approved mentor on codementor. You can request a coaching with me if you want and I'll teach you how to build kick-ass indicators and strategies
Jump on a 1 to 1 coaching with me
- You can also hire for a custom dev of your indicator/strategy/bot/chrome extension/python
Pine Script® Indikator

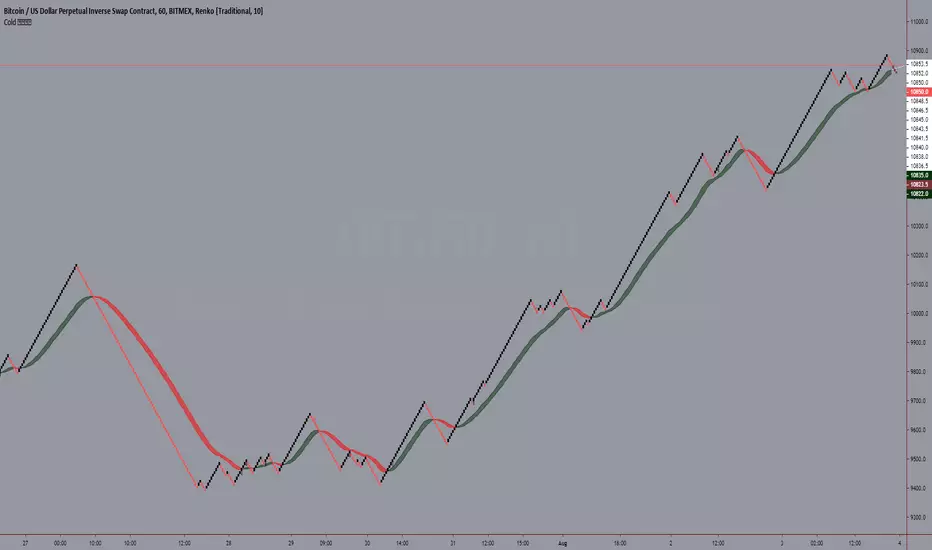
Cold 𝕃𝔼𝔾𝕆MA Ribbon
An Attempt For Smoother trend
Optional next candle forecaster for ma and its signal
Optional MA from coloring experimentation
Pine Script® Indikator
Adaptive Autonomous Recursive Moving AverageIntroduction
Using conditions in filters is a way to make them adapt to those, i already used this methodology in one of my proposed indicators ARMA which gave a really promising adaptive filter, ARMA tried to have a flat response when dealing with ranging market while following the price when the market where trending or exhibiting volatile movements, the filter was terribly simple which is one of its plus points but its down points where clearly affecting its performance thus making it almost impractical.
Today i propose a new filter A2ARMA which aim to correct all the bad behaviours of ARMA while having a good performance on various markets thanks to the added adaptivity.
Fixes And Changes
ARMA was dealing with terribles over/under-shoots which affected its performance, adding a zero-lag option made the thing even worse, in order to fix those mistakes i first cleaned the code, then i removed the offset for src in d , this choice is optional but the filter is sometimes more accurate this way.
The major change is the use of an adaptive moving average instead of the triangular moving average that smoothed the output, this adaptive moving average is calculated using exponential averaging while using the efficiency ratio as smoothing variable, this choice surprisingly removed the majority of overshoots while adding more adaptivity to the filter.
The Indicator
The Indicator work the same way as ARMA, not reacting during flat market periods while following the price when this one is volatile or trending. length control the smoothing amount while gamma determine how the filter is affected during flat market periods, gamma = 0 is just a double smoothed adaptive moving average, higher values of gamma will filter flat markets with a certain degree.
On Intel Corp with gamma = 0, i want to filter the flat period starting at July 10, gamma = 3 will certainly help us on this task.
Hooray, the problem appear to be solved ! Lower values of gamma also produce desirable effect as shown below :
gamma = 2
So far so good, but gamma or length might have different optimal values depending on the market, also problems still exists as shown here :
Seagate is tricky, gamma at 2.4 might help
The relationship between length and gamma is somewhat complicated.
On Different Markets
While some filters will process market price the same way no matter the market they are affected, A2ARMA will change drastically depending of the market.
On AMD
On EURUSD
On BTCUSD
Comparison With ARMA
ARMA with parameters roughly matching A2RMA, overall most of the problems i wanted to fix where indeed fixed.
Conclusion
A huge thanks for the support i received during this "Blank Page" period i'am suffering, ARMA was an indicator i really wanted to further develop without giving up on the code simplicity and i think this version might provide useful results, we can also notice that the decision making is easier with this version of the indicator thanks to the added coloring (which would have been impossible with ARMA).
My work don't have license attached to it, feel free to modify and share your findings, mentioning is appreciated :)
Thanks for reading !
Pine Script® Indikator
