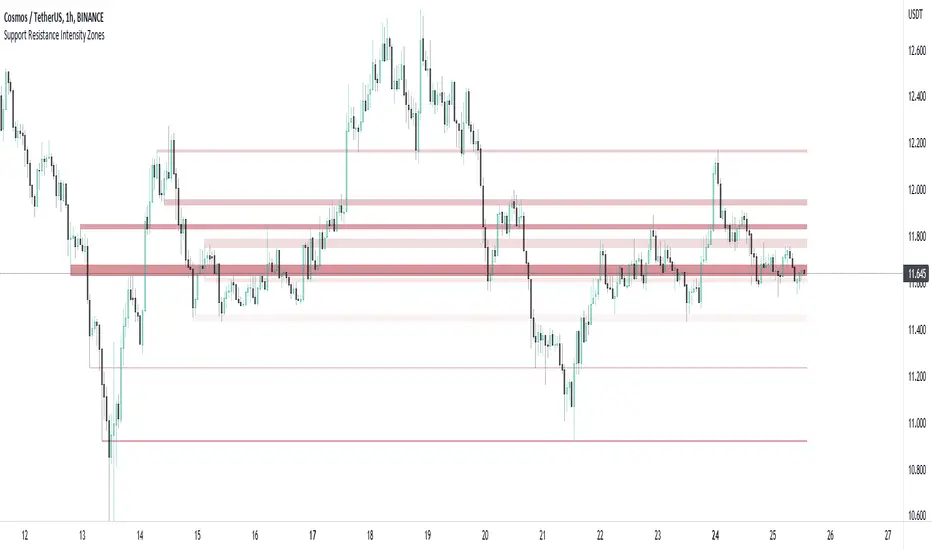
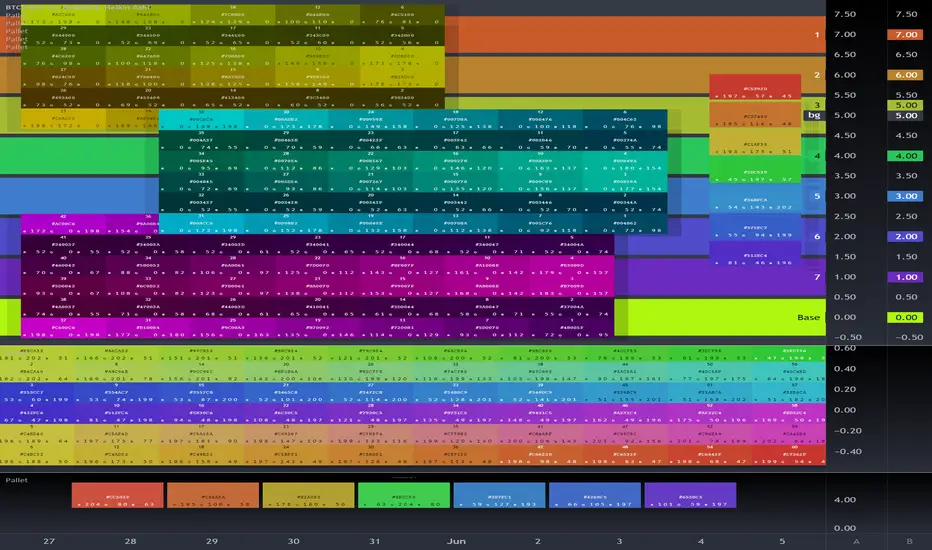
Support and Resistance Intensity ZonesSupport and resistance are often drawn using lines. This is too simple and doesn't give a clear idea of the market sentiment at these particular levels. What is strong support and resistance? What is weak support and resistance. How can either be defined by a single price point?
Using a simple, clean and configurable solution, this indicator not only shows these support and resistance levels as zones, it also gives them a colour gradient based on their intensity.
It does this by letting you choose the pivot highs and lows within a chosen range back. Then you choose one of two options to display how these multiple pivots at the same levels look. You can either group these pivots together into 'zones', where grouped pivots are all separated by a chosen price percentage, choosing how many zones to display, the most grouped pivots being the most intense colour.
Alternatively you display the pivots by 'gradient', where the closer the pivots are together in price the more intense the colour. As pivots diverge apart, the colour weakens.
Both of these options have to be seen to realise how much more there is to support and resistance than a single line.
Color
HSV and HSL gradient Tools ( Built-in Drop-in replacement )Library "hsvColor"
HSV and HSL Gradient Tool Alternatives and helpers. Demo'd is built-in in the middle with HSL/HSV gradients on top/bottom
TODO: Solve for #000000 issue
rgbhsv(_col)
RGB Color to HSV Values
Parameters:
_col : Color input (#abc012 or color.name or color.rgb(0,0,0,0))
Returns: values
rgbhsv(_r, _g, _b, _t)
RGB Color to HSV Values
Parameters:
_r : Red 0 - 255
_g : Green 0 - 255
_b : Blue 0 - 255
_t : Transp 0 - 100
Returns: values
hsv(_h, _s, _v, _a)
HSV colors, Auto fix if past boundaries
Parameters:
_h : Hue Input (-360 - 360) or further
_s : Saturation 0.- 1.
_v : Value 0.- 1.
_a : Alpha 0.- 1.
Returns: Color output
hue(_col)
returns 0-359 hue on color wheel
Parameters:
_col :
Returns: 360 degree hue value
hsv_gradient(signal, _startVal, _endVal, _startCol, _endCol)
Color Gradient Replacement Function for HSV calculated Gradents
Parameters:
signal : Control signal
_startVal : start color limit
_endVal : end color limit
_startCol : start color
_endCol : end color
Returns: HSV calculated gradient
hsl_gradient(signal, _startVal, _endVal, _startCol, _endCol)
Color Gradient Replacement Function for HSV calculated Gradents
Parameters:
signal : Control signal
_startVal : start color limit
_endVal : end color limit
_startCol : start color
_endCol : end color
Returns: HSV calculated gradient
Consolidation Breakout [Indian Market Timing]OK let's get started ,
A Day Trading (Intraday) Consolidation Breakout Indication Strategy that explains time condition for Indian Markets .
The commission is also included in the strategy .
The basic idea is ,
1) Price crosses above upper band , indicated by a color change (green) is the Long condition .
2) Price crosses below lower band , indicated by a color change (red) is the Short condition .
3) ATR is used for trailing after entry
// ═══════════════════════════════//
// ————————> TIME CONDITION <————————— //
// ═══════════════════════════════//
The Indian Markets open at 9:15am and closes at 3:30pm.
The time_condition specifies the time at which Entries should happen .
"Close All" function closes all the trades at 2:57pm.
All open trades get closed at 2:57pm , because some brokers dont allow you to place fresh intraday orders after 3pm.
NSE:NIFTY1!
// ═══════════════════════════════════════════════ //
// ————————> BACKTEST RESULTS ( 114 CLOSED TRADES )<————————— //
// ═══════════════════════════════════════════════ //
LENGTH , MULT (factor) and ATR can be changed for better backtest results.
The strategy applied to NIFTY (3 min Time-Frame and contract size 5) gives us 60% profitability , as shown below
It was tested for a period a 8 months with a Profit Factor of 2.2 , avg Trade of 6000Rs profit and Sharpe Ratio : 0.67
The graph has a Linear Curve with consistent profits.
NSE:NIFTY1!
Save it favorites.
Apply it to your charts Now !!
Thank me later ;)

RSI mid partition color changeWhen RSI is above 50 our default bias is on buy side and when below 50 our bias is on sell side.
Therefore created 2 zones for easy identification.
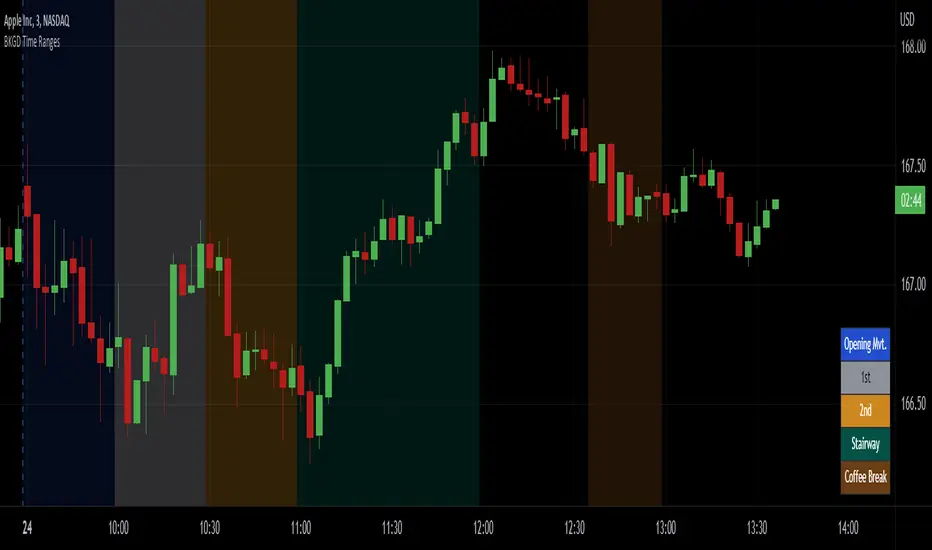
Intraday Background Time RangesThis simple script was written for studying recurring intraday behaviours of financial instruments. With it, you can highlight up to 13 customizable time ranges on your chart, filling the corresponding background space with colors you prefer. You can then write a note for each range and it will be shown in the optional related table.
The experience shows that every financial instrument has its own personality. With this in mind, the script can be useful to study intraday charts with the purpose of discovering recurring behaviours of specific instruments over a certain time range and under specific circumstances (normal days, earnings days, days with catalysts, etc.) This can help the trader to deeply understand the instrument personality, and therefore also to decide whether to enter or exit the market if its behaviour meets or not his expectations.
Please note that this script only works on minute/hourly charts.
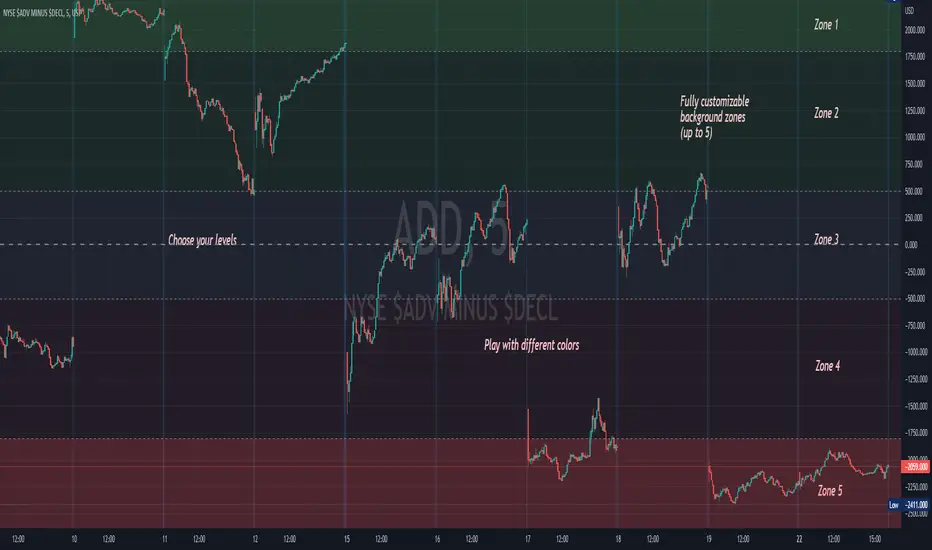
Background ZonesThis script provides up to 5 zones to apply background colors. This is especially useful for applying to indices such as USI:TICK , USI:ADD , and USI:VOLD , where certain levels provides significant meaning to market sentiment and directions. This script will give you the visual cue to help with your trading.
All levels and colors are fully customizable.
Enjoy~!!
Example:
Color Library: Rainbow Index & Simplest Return ColorLibrary "Color Library!"
To help with large projects that need colors!
If you guys make the library bigger, share it so we can all have tons of colors!
2 Functions
Uppercase and Lowercase, because why not?
import library as color
1.) color.this("Brown") // or color.this("brown") both work
2.) color.rainbow(1) //Returns first index of Rainbow
this(x)
TODO: color.this(Brown)
Parameters:
x : TODO: String Color Name
Returns: TODO: Color
rainbow(x)
TODO: Return Rainbow Index
Parameters:
x : TODO: Number is index of Rainbow :)
Returns: TODO: Color

[SS]Multicolor BB with Squeez Moving Average & Colored BarsHello Followers,
Hope u guyz doing well in the market.
Came with a standalone Trading System which helps u with the trend & choppiness zone.
This system is combination of multiple stretagies which makes it better than single published indicators.
=========================================================================================================
We have used Variety-Filtered, Squeeze Moving Averages which is a chop zone indicator that identifies when price is below a specific volatility threshold calculated as the difference between a fast and slow moving average and filtered using ATR- or Pips-based threshold. This indicator can be use as both an entry and exit indicator. It identifies both chop zones and breakouts/breakdowns
Uses:-
When the candles turn white and the threshold bands appear on the chart, this is indicative of low volatility
When price exits the threshold bands, price will usually explode up or down giving a long or short signal. This acts as a sort of squeeze momentum.
Included:
Bar coloring
Signals
Alerts, 4 types of alerts: Squeeze started, Squeeze ended, long, and short
<<------------------------------------->>
Multicolour Bollinger Bands indicator that indicates market phases.
It plots on the price chart, thanks to different color zones between the bands, a breakdown of the different phases that the price operates during a trend.
The different zones are identified as follows:
- red color zone: trend is bearish , price is below the 200 periods moving average
--> orange color zone: price operate a technical rebound below the 200 periods moving average
- yellow color zone: (phase 1 which indicate a new bearish cycle)
- light green zone: (phase 2 which indicate a new bullish cycle)
--> dark green zone: trend is bullish , price is above the 200 periods moving average
- grey color zone: calm phase of price/low volatility
- dark blue color zone: price is consolidating in either bullish or bearish trend
- light blue zones: price will revert to a new opposite trend (either long or short new trend)
By identifying clearly the different market phases with the multicolor Bollinger bands , the market entries by either a the beginning of a new trend or just after a rebound or a consolidating phase is easier to spot on.
<<==========================>>
The credit of above indicator souce goes to loxx & Deveatt. I just backtested and modified it to increase accuracy of trade and clear visual representation for trades.
Modified the trend based SMA and BB period and entry criteria.
<<===========================>>
<>
1) Look for BB COLOR and SMA for trend either up or down.
2) Look Bar coloring, enter when price above sma and green for long else short.

HarmonicSwitches█ OVERVIEW
This library is complementary for XABCD Harmonic Pattern Custom Range Interactive
TupleSwitchHL()
: Tuple Switch for High Low
Parameters:
: : _bool, low_X, high_X, low_A, high_A, low_B, high_B, low_C, high_C
Returns: : price_X, price_A, price_B, price_C
TupleSwitchStyleColor()
: Tuple switch for style and color
Parameters:
: : _bool
Returns: : style0, style1, col_dir
TupleSwitchString()
: Tuple switch for string
Parameters:
: : _bool
Returns: : str_dir, str_X, str_A
TupleSwitchValid()
: Tuple switch for valid
Parameters:
: : _str
Returns: : str_invalid, str_valid
TupleSwitchTime()
: Tuple switch for time
Parameters:
: : _str, time_1, time_2, time_3
Returns: : E1, E2
SwitchColor()
: Switch color
Parameters:
: : _str
Returns: : col_valid
SwitchExtend()
: Extend line
Parameters:
: : _str
Returns: : _extend
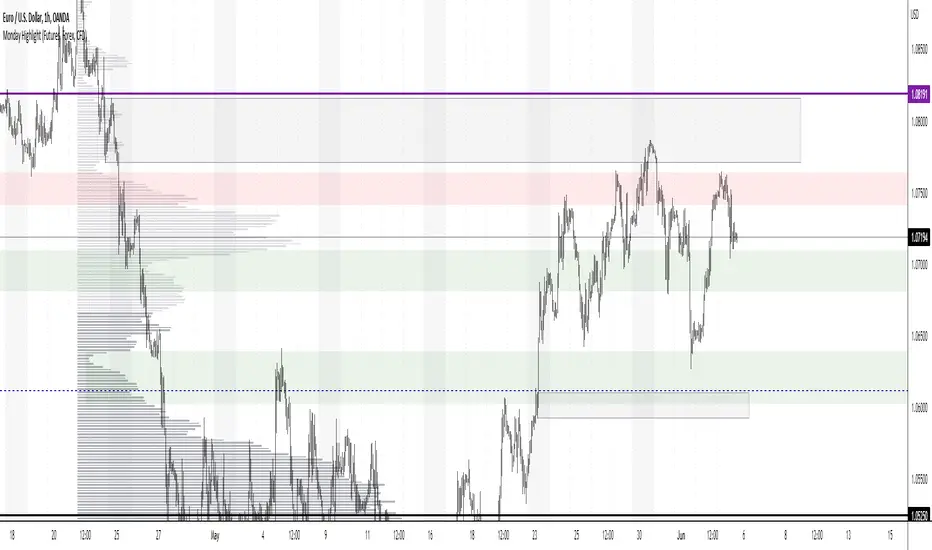
Monday Highlight (Futures, Forex, CFD)Hello Traders
This is a very simple indicator that will highlight the background vertically over every Monday for Futures, Forex and CFD markets. I use this indicator in all my technical analysis as it lets me very quickly see where each week begins without being too distracting. It can be easily customizable to whatever color, transparency level and visibility you want. Because of the way closing times are processed in different markets I could not make a single indicator to include all markets, but check out my second Monday Highlight indicator for Crypto and Stock markets.
Hope you find them useful and don't forget to add them to your "favorites" list for easy access.
Monday Highlight (Crypto & Stocks)Hello Traders
This is a very simple indicator that will highlight the background vertically over every Monday for Crypto and Stock markets. I use this indicator in all my technical analysis as it lets me very quickly see where each week begins without being too distracting. It can be easily customizable to whatever color, transparency level and visibility you want. Because of the way closing times are processed in different markets I could not make a single indicator to include all markets, but check out my second Monday Highlight indicator for Futures, Forex and CFD markets.
Hope you find them useful and don't forget to add them to your "favorites" list for easy access.

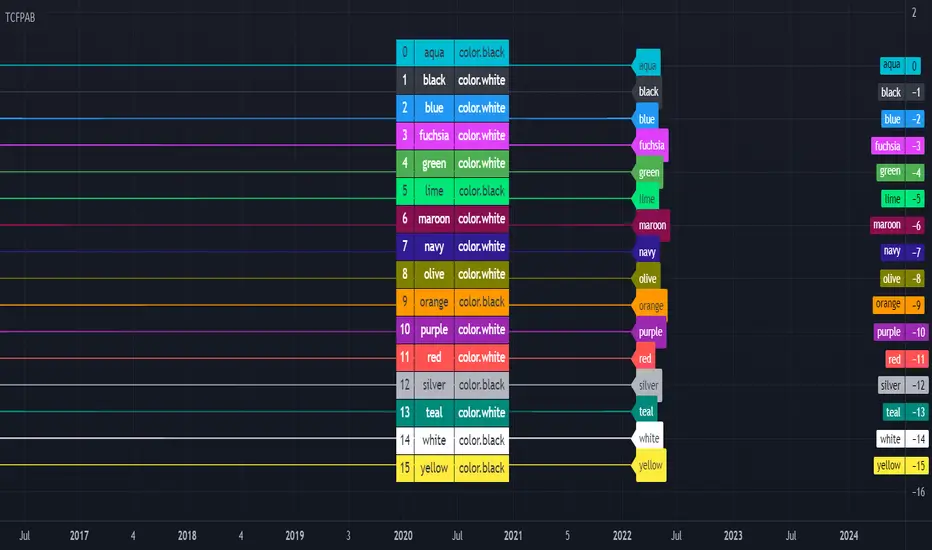
Old Buddy Old Pal... Color Scheme Pallet GeneratorFor the Tasteful Pine Coder, Find your inner rainbow.
Color pallet tool with 7 standard colors as per syntax highlighters typical scheme.
Hue, Sat, Lum adjustments, transparency, and 4 different modes.
Please Share in comments any Chart Captures showcasing your designs if his tool helped you.
a library version is in the works as of may 2022. will enable a 7 color standard output direct into script with floating color input shifting of the whole pallet or partials.
(( next level past gradients)
ColorArrayLibrary "ColorArray"
Simple color array gradient tool.
makeGradient(size, _col1, _col2, _col3, _col4, _col5) Color Gradient Array from 5 colors.
Parameters:
size : : default 10
_col1 : : default #ff0000
_col2 : : default #ffff00
_col3 : : default #00ff00
_col4 : : default #00ffff
_col5 : : default #0000ff
Returns: array of colors to specified size.

Multiple Indicator 50EMA Cross AlertsHere’s a screener including Symbol, Price, TSI, and 50 ema cross in a table output.
The 50 Exponential Moving Average is a trend indicator
You can find bullish momentum when the 50 ema crossed over or a bearish momentum when the 50 ema crossed under we are looking to take advantage by trading the reversion of these trends.
True strength index (TSI) is a trend momentum indicator
Readings are bullish when the True Strength Index shows positive values
Readings are bearish when the indicator displays negative values.
When a value is above 20, we look for selling overbought opportunity and when the value is under 20, we look for buying oversold opportunity.
You can select the pair of your choice in the settings.
Make sure to create an alert and choose any alerts then an alert will trigger when a price cross under or cross over the 50 ema for every pair separately.
This allow the user to verify if there is a trade set up or not.
Disclaimer
This post and the script don’t provide any financial advice.

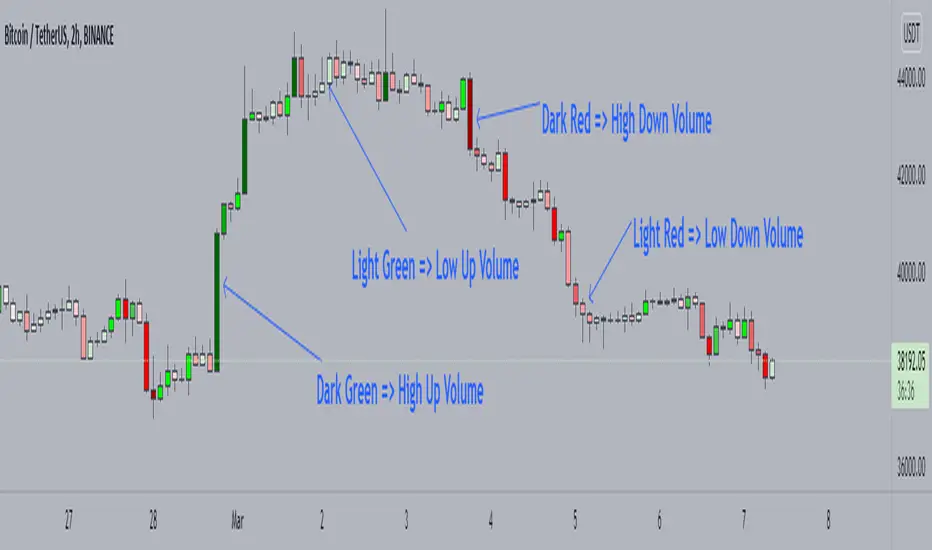
Candle Colored by Volume Z-score [Morty]This indicator colors the candles according to the z-score of the trading volume. You can easily see the imbalance on the chart. You can use it at any timeframe.
In statistics, the standard score (Z-score) is the number of standard deviations by which the value of a raw score (i.e., an observed value or data point) is above or below the mean value of what is being observed or measured. Raw scores above the mean have positive standard scores, while those below the mean have negative standard scores.
This script uses trading volume as source of z-score by default.
Due to the lack of volume data for some index tickers, you can also choose candle body size as source of z-score.
features:
- custom source of z-score
- volume
- candle body size
- any of above two
- all of above two
- custom threshold of z-score
- custom color chemes
- custom chart type
- alerts
default color schemes:
- green -> excheme bullish imbalance
- blue -> large bullish imbalance
- red -> excheme bearish imbalance
- purple -> large bearish imbalance
- yellow -> low volume bars, indicates "balance", after which volatility usually increases and tends to continue the previous trend
Examples:
* Personally, I use dark theme and changed the candle colors to black/white for down/up.
Volume as Z-score source
Any as Z-score source, more imbalances are showed

4c ATR ThresholdThe 4C ATR Threshold is a simple indicator that paints the chart background red when the ATR goes below the user defined ATR minimum.
Some trading setups have specific criteria that require a minimum ATR on a certain timeframe for the instrument to be playable.
The painting of the chart background based on the ATR value is useful as a quick visual reference.
The minimum ATR value can be adjusted to any specific level for any timeframe.
If the ATR dips below the user defined minimum, the trader can quickly see that the ATR is below the minimum criteria, and should not trade that instrument (based on their personal trade criteria).
If the background is not painted by the indicator, then the ATR is above the user defined minimum.
Parts of this script used the default/stock Tradingview ATR indicator to build from.
Candle Color by VolumeA simple but effective indicator that paints candles with different shades of colors based on the volume transacted.
-> Supports 6 levels of sensitivity at present. Might enhance the granularity later.
-> Darkest indicates the most volume transacted. Lightest, the least. Change it around however you see fit and based on your theme.
-> Use it for your Volume Spread Analysis and/or in conjunction with any other strategies that you employ.
-> Note that the volume ratio is calculated relative to the average volume of the last n candles ( EMA 20 by default).
SuperJump Multi Time Frame Heiken Ashi ColorThis is my first public simple script.
It expresses the color of Heiken ashi Candle on a different time chart.
As you already know about it, If you change your chart directly to Heiken ashi, the value of candle changes.
For eaxmple, moving average lines change little by little from Non Heiken ashi Candle.
I was very uncomfortable with this.
If you use this, you can check the Heiken ashi color while using a Non Heiken ashi Candle.

[HELPER] Table Color For Pairing Black And White█ OVERVIEW
This helper intend to simplify which color pair better with black or white color, may help some pine coders.
█ INSPIRATION
This color choice was inspired during plot especially user enable dark color theme.
Color displayed at table and label are based on Indicator name label and Indicator last value label displayed at Scales.
█ FEATURES
Color can be tick to be inverted color.
Display table by changing table position and font size.
4-Way EMA Trend4 separate EMAs that are used to determine trend, colored appropriately to reflect the trend to make it easy to tell what the trend is. All 4 EMAs are not needed, you can turn each one on and off individually and the indicator will adjust itself accordingly. Having a single EMA will use the closing price to determine the trend. There are 2 different types of trend detection; EMA Flip and EMA Confluence. EMA Flip is dependent on all active EMAs rising or falling in the correct hierarchical order. The EMA Confluence option is if all EMAs are moving in the same direction. I've found that this second option, EMA Confluence, is more accurate in getting in early before strong movements because the EMAs will more often move in the same direction before they "flip".

RGB Color FiddlerKEEP YOUR COINS FOLKS! I DON'T NEED THEM, DON'T WANT THEM. Many other talented authors on TV deserve them.
INTRODUCTION:
This is my "RGB Color Fiddler", intended as a toy to play with. This colorcator is rated 'E' for every TV member. With this you can quickly generate about 1.67 million potential colors from color.rgb(). While I have a few preferred colors that are ideal for use, this allows you to finely tune colors to anything that pleases your eye on your canvas.
TIPS:
The overlay chart can be peppered with colors of all varieties, so it's necessary to have properly distinguished coloring and contrast separation. If you employ light charts, you can tweak colors to just the right shade you desire on your display. Not all LCDs are created equal, even when color calibrated. With specific discovered colors tailored to your liking, you may uniquely color code ALL of your indicators.
UTILITY:
The input()s in Settings allow up to 4 different colors to tinker with and compare. After selecting focus of an input, you can easily use the up/down keyboard keys to make swift adjustments numerically or with options. The color combos you are creating will be displayed in color hex or a RGB representation within the labels.
Also of great benefit, is the ability to cycle through the currently available plot() styles. Some styles will require you to zoom in closeup to observe their behaviors. There is a few other ways to finagle plot() parameters to also achieve other acrobatic effects that are not demonstrated here. Closer study of plot() parameters in the reference can reveal those. Anyhow, I won't bother you with more elaborate technical jargon, now is the time to fiddle with this toy to your benefit!
CODE REUSE:
Any member has the freedom to use any of the code in this script any way they see fit. It's specifically intended for all. There is absolutely no need for accreditation for any of this code reuse ever, in the present case. Don't worry about, I'm certainly not.
When available time provides itself, I will consider your inquiries, thoughts, and concepts presented below in the comments section, should you have any questions or comments regarding this indicator. When my indicators achieve more prevalent use by TV members , I may implement more ideas when they present themselves as worthy additions. Have a profitable future everyone!

PSv5 Color Magic and Chart Theme SimulatorKEEP YOUR COINS FOLKS! I DON'T NEED THEM, DON'T WANT THEM. Many other talented authors on TV deserve them.
INTRODUCTION:
This is my "PSv5 Color Magic and Chart Theme Simulator" displayed using Pine Script version 5.0. The purpose of this PSv5 colorcator is to show vivid colors that are most suitable in my opinion for modifying or developing Pine scripts. Whether you are new to Pine or an experienced Pine poet, this should aid you in developing indicators with stunning color from the provided color list that is easily copied and pasted into any novel script you should possess. Whichever colors you choose, and how, is up to your imagination's capacity.
COMMENTARY:
I have a thesis. Pine essentially is a gigantor calculator with a lot of programmable bells and whistles to perform intense analytics. Zillions of numbers per day are blended up into another cornucopia of numbers to analyze. The thing is, ALL of those numbers are moot unless we can informatively portray them in various colorized forms with unique methods to point out significant numeric events. By graphically displaying them with specific modes of operation, only then do these numbers truly make any sense to us and become quantitatively beneficial.
I have to admit... I hate numbers. I never really liked them, even before I knew what an ema() was. Some days I almost can't stand them, and on occasion I feel they deserve to be flushed down the toilet at times. However, I'm a stickler for a proper gauge of measurements. Numbers are a mental burden, but they do have "purpose and meaning". That's where COLOR comes in! By applying color in specific ways in varying dynamic forms, we can generate smarter visual aids from these numerics. Numbers can be "transformed" into something colorful it wasn't before, into a tool, like a hammer. But we don't need a hammer, we need an impressive jack hammer for BIG problem solving that we could never achieve in the not to distant past.
As time goes on, we analytically measure more, and more, and more each year. It's necessary to our continual evolution. That's one significant difference between us and cave men, and the pertinent reason why we are quickly evolving as a species, while animals haven't. Humankind is gifted to enumerate very well AND blessed to see in color. We use it for innumerable things in the technological present for purpose and pleasure. Day in and day out, we take color for granted, because it's every where we can look. The fact is, color is the most important apparatus in humankind's existence EVER. We wouldn't have survived this far without it.
By utilizing color to it's grand potential, greater advancements can be attained while simultaneously being enjoyed visually. Once color is transformed from it's numeric origins into applicable tools, we can enjoy the style, elegance, and QUALITATIVE nature of the indication that can be forged. Quantities can't reveal all. Color on the other hand has a handy "quality" factor to it, often revealing things we can't ordinarily recognize. When high quality tools provide us with obtained goals, that's when we will realize how magical color truly is, always has been, and shall always be.
The future emerging economies and future financial vessels of people around the globe are going to be dependent on the secured construction of intelligent applications with a rock solid color foundation, not just math alone. I have no doubt about that. I can envision that with my eyes closed. To make an informed choice, it should be charted or graphed somehow prior to a final executive decision to trade. Going back to abysmal black and white with double decimal points placed next to cartoons within extinction doomed newspapers is not a viable option any more.
OBSERVATIONS AND UTILITY:
One thing you will notice is the code is very dense. Looks almost hideous right? Well, the variable naming is lengthy, but it's purpose is to be self explanatory, even for those who don't know how to program, YET. I'm simply not a notation enthusiast. My main intention was to provide clearly identifiable variables from their origin of assignment to their intended destination of use, clearly visible for anyone visiting. The empowerment of well versed words that are easier to understand, is a close rival to the prominent influence color has.
Secondly, I'm displaying hline() and label.new() as prime candidates to exemplify by demonstration how the "Power of Color" can be embraced with the "Power of Pine". Color in Pine has been extensively upgraded to serve novel purposes to accomplish next generation indicators that do and WILL come to exist. New functions included with PSv5 are color.rgb(), color.from_gradient(), color.r(), color.g(), color.b(), and color.t() to accompany color.new() in our mutual TV adventures. Keep in mind, the extreme agility of color also extends to line.new(), the "entirely new" linefill.new(), table.new(), bgcolor() and every other function that may utilize color.
There's a wide range of adjustability in Settings to make selections to see how they perform on different backgrounds, with their size and form. As you curiously toy with those, you're going to notice how some jump out like laser beams while others don't. Things that aren't visually appealing, still have very viable purposes, even if they don't stand out in the crowd. Often, that's preferable. The important thing is that when pertinent information relative to indication is crucial, you can program it with distinction from an assortment of a potential 1.67 million colors that can be created in Pine. "These" are my chosen favorite few, and I hope you adopt them.
PURPOSES:
For those of you who are new to Pine Script, this also may help you understand color hex/rgb and how it is utilized in Pine in a most effective manner. The most skilled of programmers can garner perks as well. There is countless examples of code diversity present here that are applicable in other scripts with adequate mutation. Any member has the freedom use any of this code in this script any way they see fit. It's specifically intended for all. There is absolutely no need for accreditation for any of this code reuse ever, in the present case. Don't worry about, I'm not.
The color_tostring() will be most valuable in troubleshooting color when using color.rgb() and becoming adept with it. I'm not going to be able to use color.rgb() without it. Chameleon indicators of the polychromatic variety are most likely going to be fine tuned with color_tostring() divulging it's results to label.new() or even table.new() maybe. One the best virtues of this script in chart, is when you hover over the generated labels, there's a hidden gift for those who truly wish to learn the intricate mechanics of diverse color in Pine. Settings has informative tooltips too.
AFTERTHOUGHTS:
Colors are most vibrant on the "Black Chart" which is the default, but it doesn't currently exist as a chart theme. With the extreme luminous intensity of LCDs in millicandela( mcd ), you may notice "Light" charts may saturate the colors making charts challenging to analyze. Because of this, I personally use "Dark Charts" and design my indicators specifically for these. I hope this provides inspiration for the future developers who are contemplating the creation of next generation indicators and how color may enhance their usefulness.
When available time provides itself, I will consider your inquiries, thoughts, and concepts presented below in the comments section, should you have any questions or comments regarding this indicator. When my indicators achieve more prevalent use by TV members , I may implement more ideas when they present themselves as worthy additions. Have a profitable future everyone!
