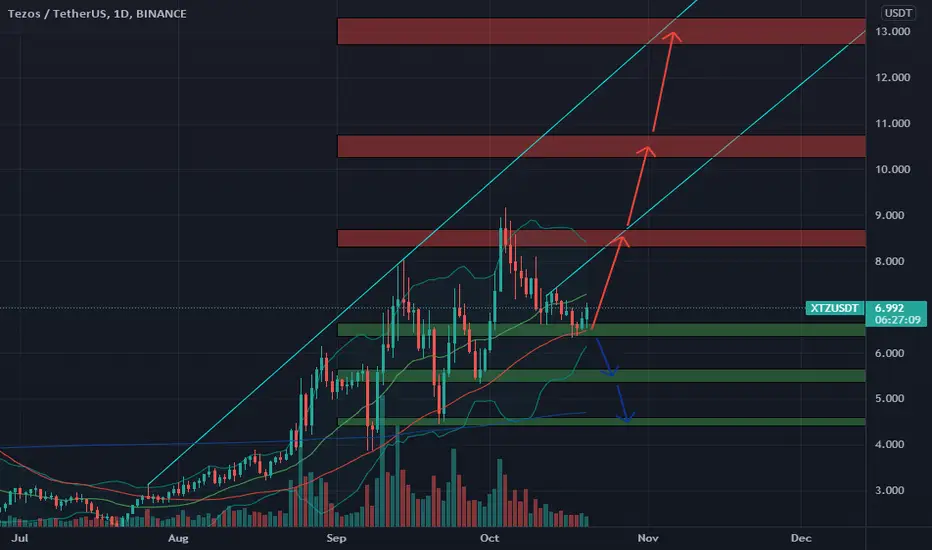
XTZ has good support at 6.5$ zone and it could move towards 8.5$, 10.5$ and 13$ zones in next days. But if it loses this 6.5$ zone, it will fall sharply to 5.5$ and 4.5$ zones
📈RED PLAN
♻️Condition : If 1-Day closes ABOVE 6.5$ zone
🔴Buy : 6.5
🔴Sell : 8.5 - 10.5 - 13
📉BLUE PLAN
♻️Condition : If 1-Day closes BELOW 6.5$ zone
🔵Sell : 6.5
🔵Buy : 5.5 - 4.5
❓Details
🚫Stoploss for Long : 10%
🚫Stoploss for Short : 5%
📈Red Arrow : Main Direction as RED PLAN
📉Blue Arrow : Back-Up Direction as BLUE PLAN
🟩Green zone : Support zone as BUY section
🟥Red zone : Resistance zone as SELL section
🅰️A : The Close price of 1-day candlestick is Above the zone
🅱️B : The Close price of 1-day candlestick is Below the zone
Haftungsausschluss
Die Informationen und Veröffentlichungen sind nicht als Finanz-, Anlage-, Handels- oder andere Arten von Ratschlägen oder Empfehlungen gedacht, die von TradingView bereitgestellt oder gebilligt werden, und stellen diese nicht dar. Lesen Sie mehr in den Nutzungsbedingungen.
Haftungsausschluss
Die Informationen und Veröffentlichungen sind nicht als Finanz-, Anlage-, Handels- oder andere Arten von Ratschlägen oder Empfehlungen gedacht, die von TradingView bereitgestellt oder gebilligt werden, und stellen diese nicht dar. Lesen Sie mehr in den Nutzungsbedingungen.