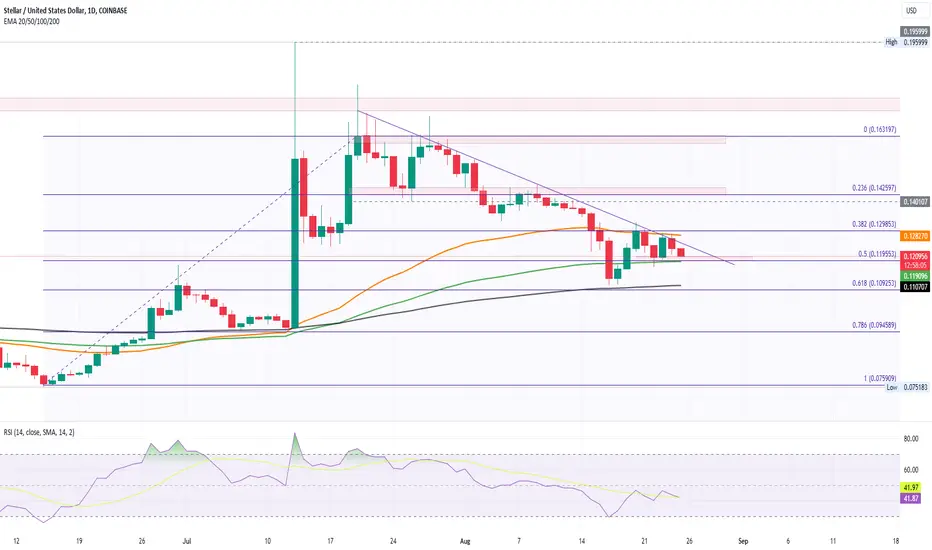
XLM price moves sideways between 50 and 100-day EMA.
Resistance trendline indicates strong selling pressure.
Break below 100-day EMA could push XLM below $0.10.
XLM faces significant resistance at $0.16, with sellers controlling bullish momentum.
Downtrend exerts pressure on 100 and 200-day EMA.
Price trapped between 50% and 38.2% Fibonacci levels, consolidating between $0.119-$0.129.
Intraday fall of 2.15% sees XLM testing $0.119 support.
Breakout from current Fibonacci levels will indicate next move.
Potential double top formation suggests possible downtrend.
If price drops below 100-day EMA, 200-day EMA buyers may step in, stressing the $0.10 mark.
Bullish scenario: If XLM breaks 50-day EMA, it could target $0.142.
Haftungsausschluss
Die Informationen und Veröffentlichungen sind nicht als Finanz-, Anlage-, Handels- oder andere Arten von Ratschlägen oder Empfehlungen gedacht, die von TradingView bereitgestellt oder gebilligt werden, und stellen diese nicht dar. Lesen Sie mehr in den Nutzungsbedingungen.
Haftungsausschluss
Die Informationen und Veröffentlichungen sind nicht als Finanz-, Anlage-, Handels- oder andere Arten von Ratschlägen oder Empfehlungen gedacht, die von TradingView bereitgestellt oder gebilligt werden, und stellen diese nicht dar. Lesen Sie mehr in den Nutzungsbedingungen.