Gold (XAU/USD) Analysis – Ascending Channel with Resistance Rejection 📉
📊 Timeframe: 4H
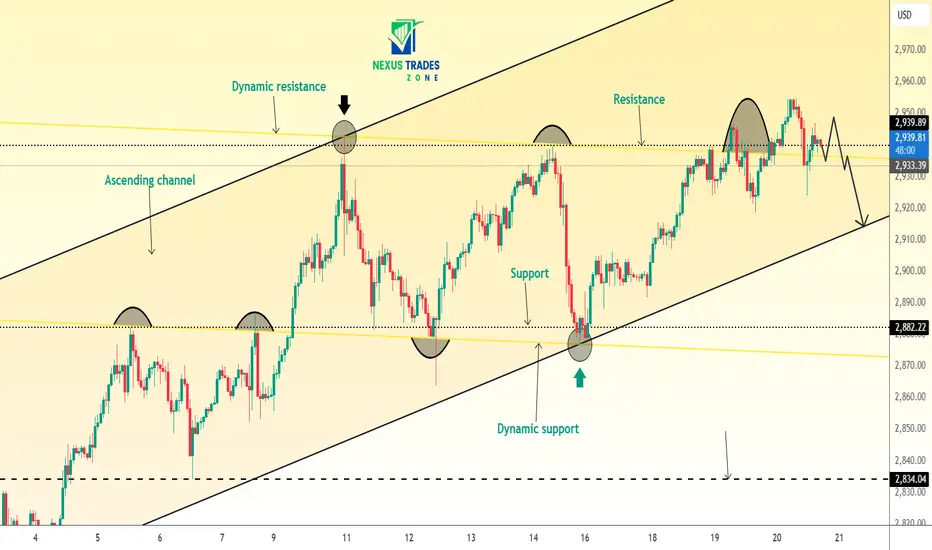
💰 Current Price: $2,939
📈 Trend: Uptrend within an ascending channel
Market Overview:
Gold is currently trading inside an ascending channel, respecting both dynamic support and resistance. However, the price has shown multiple rejections at the resistance zone, indicating a potential pullback.
Key Levels to Watch:
✅ Resistance Zone: $2,950 - $2,960 (Strong rejection area)
✅ Support Levels: $2,920 (Dynamic support), $2,882 (Major support)
✅ Critical Breakdown Level: Below $2,882 could signal a deeper correction
Technical Pattern:
🔹 Double Top Formation at Resistance: Price failed to break higher, showing a bearish reaction.
🔹 Dynamic Support Retest: The price could test the ascending channel support near $2,920.
🔹 Lower Highs Forming: A sign of weakening bullish momentum.
Trade Plan:
🔹 Bearish Scenario:
If price rejects the resistance again, expect a pullback towards $2,920 - $2,910.
A breakdown below the ascending channel could trigger a drop to $2,882 or lower.
🔹 Bullish Scenario:
If price holds above $2,920, bulls may attempt another breakout towards $2,960+.
📊 Timeframe: 4H
💰 Current Price: $2,939
📈 Trend: Uptrend within an ascending channel
Market Overview:
Gold is currently trading inside an ascending channel, respecting both dynamic support and resistance. However, the price has shown multiple rejections at the resistance zone, indicating a potential pullback.
Key Levels to Watch:
✅ Resistance Zone: $2,950 - $2,960 (Strong rejection area)
✅ Support Levels: $2,920 (Dynamic support), $2,882 (Major support)
✅ Critical Breakdown Level: Below $2,882 could signal a deeper correction
Technical Pattern:
🔹 Double Top Formation at Resistance: Price failed to break higher, showing a bearish reaction.
🔹 Dynamic Support Retest: The price could test the ascending channel support near $2,920.
🔹 Lower Highs Forming: A sign of weakening bullish momentum.
Trade Plan:
🔹 Bearish Scenario:
If price rejects the resistance again, expect a pullback towards $2,920 - $2,910.
A breakdown below the ascending channel could trigger a drop to $2,882 or lower.
🔹 Bullish Scenario:
If price holds above $2,920, bulls may attempt another breakout towards $2,960+.
Verbundene Veröffentlichungen
Haftungsausschluss
Die Informationen und Veröffentlichungen sind nicht als Finanz-, Anlage-, Handels- oder andere Arten von Ratschlägen oder Empfehlungen gedacht, die von TradingView bereitgestellt oder gebilligt werden, und stellen diese nicht dar. Lesen Sie mehr in den Nutzungsbedingungen.