Gold - Key Weekly Trendline Tested - Volatility in Days Ahead
Gold is likely to see similar volatility over the next few days....
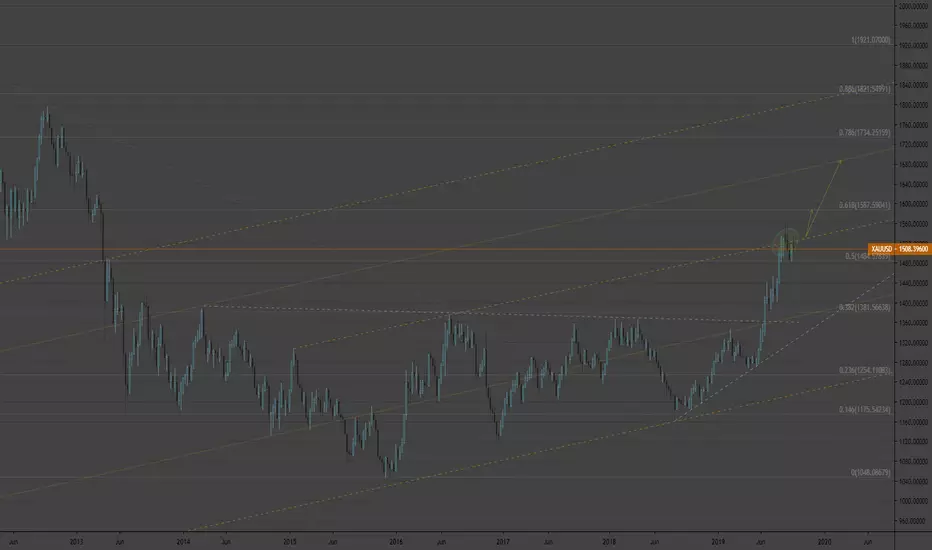
Key trend-line, which I pointed out in a previous idea, was tested again and rejected. As the chart shows, the ascending channel resistance is associated with other key swing highs in the past. Bears will (and still are) defending this trend-line as (imo) it is the key resistance that need to be held in order for bulls to extend the rally.
I'm more implied to suggest when it will be broken, opposed to if it will be broken. Heading into the end of the month, end of the quarter, expect a lot of volatility and keep your eye on the trend-line. Monthly candles (while not practical for most of us to trade) show important key levels bulls / bears are looking at. I'll prove this by posting a quarterly chart dating back to 1976 in the comments (You will see how clean the lines are)
I will be posting DXY chart and XAG chart which support a move higher into months end.
$1485 which is the 0.5 Fib is currently support.
Anmerkung
Gold quarterly back to 1976; equal distance parallel channel.Anmerkung
The black trend-line is the main bullish trend-line supporting all the swing lows the whole bull run up from $1200's..... Bulls need to regain this level and we should see some short covering...Haftungsausschluss
Die Informationen und Veröffentlichungen sind nicht als Finanz-, Anlage-, Handels- oder andere Arten von Ratschlägen oder Empfehlungen gedacht, die von TradingView bereitgestellt oder gebilligt werden, und stellen diese nicht dar. Lesen Sie mehr in den Nutzungsbedingungen.
Haftungsausschluss
Die Informationen und Veröffentlichungen sind nicht als Finanz-, Anlage-, Handels- oder andere Arten von Ratschlägen oder Empfehlungen gedacht, die von TradingView bereitgestellt oder gebilligt werden, und stellen diese nicht dar. Lesen Sie mehr in den Nutzungsbedingungen.