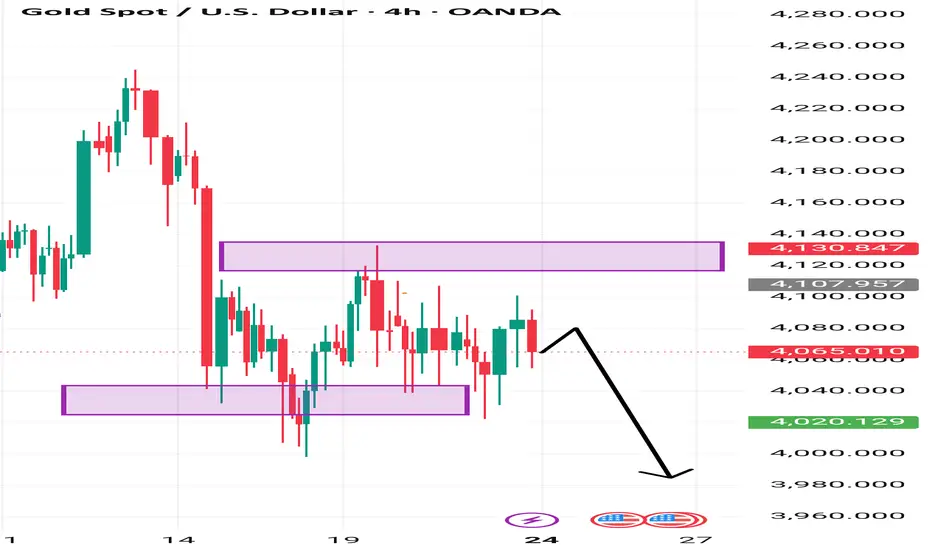
Why a Drop Makes Sense (Bearish Bias)
✔ Repeated rejections from the upper supply zone
The large purple zone around 4120–4130 has already rejected price multiple times
→ showing strong sellers there.
✔ Lower highs forming
The candles show a series of lower highs, meaning bulls are failing to push up.
✔ Price failing to break 4080–4090
This zone is acting as strong intraday resistance.
Your arrow shows price retesting it — that is a typical retracement before continuation down.
We share XAUUSD (Gold) signals based on market analysis.
Educational content to help traders make informed decisions.
Educational content to help traders make informed decisions.
Haftungsausschluss
Die Informationen und Veröffentlichungen sind nicht als Finanz-, Anlage-, Handels- oder andere Arten von Ratschlägen oder Empfehlungen gedacht, die von TradingView bereitgestellt oder gebilligt werden, und stellen diese nicht dar. Lesen Sie mehr in den Nutzungsbedingungen.