The first time WDAY crossed $300 was way back in November 2021, when the bullish trend, which started after the 2020 fall, made the stock rise almost 200%. The stock retested its ATH and managed to create a new ATH just above $311 in February 2024, but failed to sustain above it.
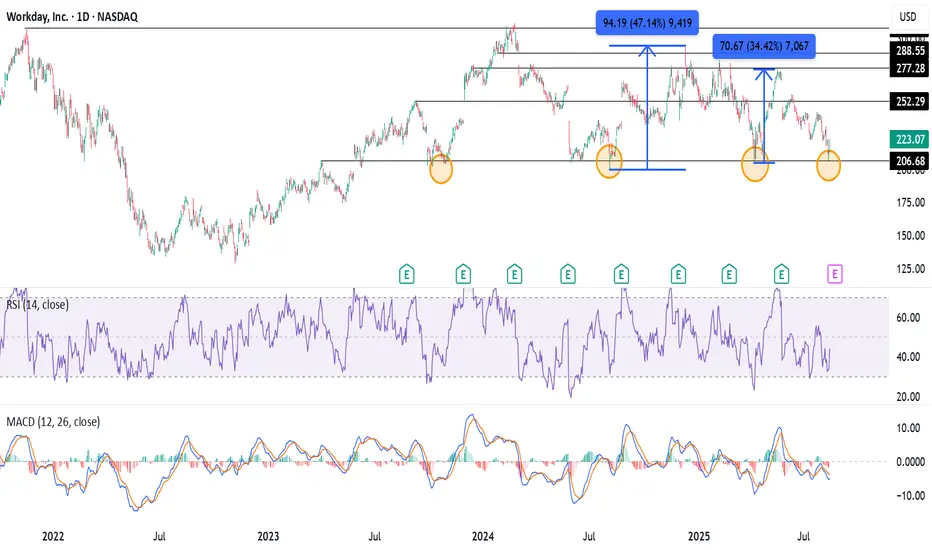
Since then, the stock has corrected and tested $200 multiple times in August 2024, April 2025, and now in August 2025. The $200 seems to be a strong support base. On previous occasions, when the price tested $200, the stock rose ~47% from August to December 2024 and ~34% in April-May 2025.
The price has now once again retested its strong support base around $200, with a low of $206.77, followed by a pin-bar day candlestick on August 12. The bulls seem to have come at the right time, as the price rose 3.95% on the following session.
The support base $200 with a pin-bar candle followed by a bullish momentum on the next day sets the perfect long setup for the trade.
Potential Swing Targets- $250-252, $275-277, and $288-290.
Stop-loss around $200-198.
Haftungsausschluss
Die Informationen und Veröffentlichungen sind nicht als Finanz-, Anlage-, Handels- oder andere Arten von Ratschlägen oder Empfehlungen gedacht, die von TradingView bereitgestellt oder gebilligt werden, und stellen diese nicht dar. Lesen Sie mehr in den Nutzungsbedingungen.
Haftungsausschluss
Die Informationen und Veröffentlichungen sind nicht als Finanz-, Anlage-, Handels- oder andere Arten von Ratschlägen oder Empfehlungen gedacht, die von TradingView bereitgestellt oder gebilligt werden, und stellen diese nicht dar. Lesen Sie mehr in den Nutzungsbedingungen.