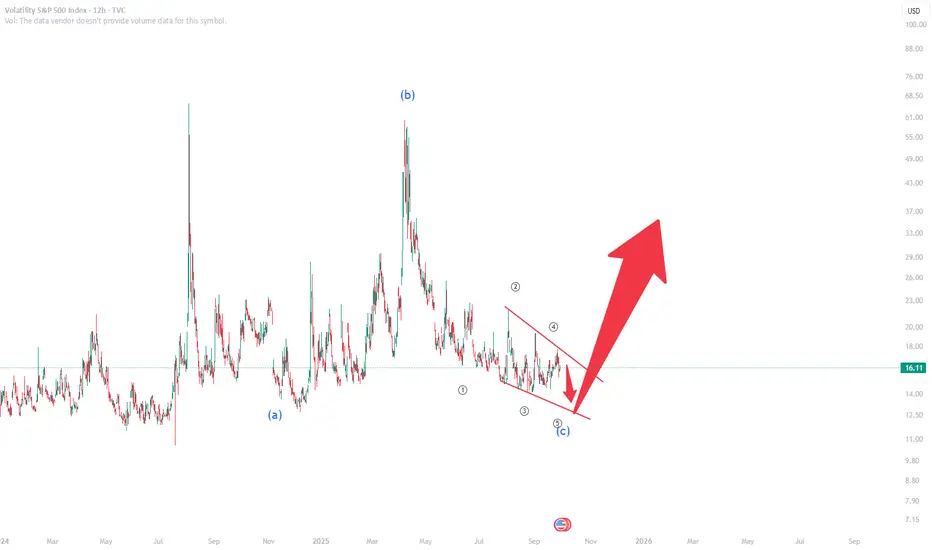
The VIX index is finalizing an A-B-C corrective structure, with the C-leg forming as a diagonal. Price action suggests this structure is close to completion. Once the diagonal ends, the probability of a sharp upside move in volatility becomes highly likely.
Why does this matter?
A rising VIX reflects fear and risk aversion in the market.
Historically, VIX moves inversely with equities – higher volatility often coincides with S&P 500 weakness.
When VIX breaks out, it signals hedging demand and uncertainty, pushing option premiums higher and increasing market stress.
📌 Trading view: A confirmed breakout from the diagonal would mark the start of a new impulsive leg higher in volatility. This could align with risk-off flows in equities and broader corrections across risk assets.
Patience and confirmation remain key — once VIX turns, it usually accelerates quickly, not quietly.
💼 Professional market insights & charts:
cakirinsights.com/
cakirinsights.com/
Haftungsausschluss
Die Informationen und Veröffentlichungen sind nicht als Finanz-, Anlage-, Handels- oder andere Arten von Ratschlägen oder Empfehlungen gedacht, die von TradingView bereitgestellt oder gebilligt werden, und stellen diese nicht dar. Lesen Sie mehr in den Nutzungsbedingungen.