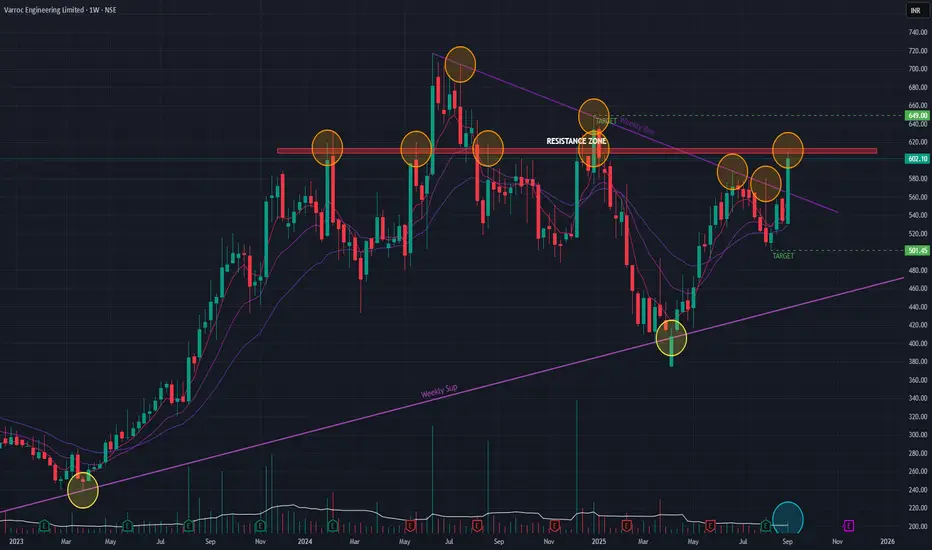
Varroc has been mostly in a sideways trend since Dec 2023. Key horizontal resistance zone was brokenout couple of times but that could not be sustained for long. Last week the stock surged by 12.68% with decent volume. With the surge it was able to breakout of a major angular resistance. Short-term EMAs are in PCO state as of last week.
If momentum continues, we may see the stock surge past the resistance zone and may reach 649 levels. On the downside, we may see the stock at 501 levels.
If momentum continues, we may see the stock surge past the resistance zone and may reach 649 levels. On the downside, we may see the stock at 501 levels.
Disclaimer: This analysis is my personal view & for educational purposes only. They shall not be construed as trade or investment advice. Before making any financial decision, it is imperative that you consult with a qualified financial professional.
Haftungsausschluss
Die Informationen und Veröffentlichungen sind nicht als Finanz-, Anlage-, Handels- oder andere Arten von Ratschlägen oder Empfehlungen gedacht, die von TradingView bereitgestellt oder gebilligt werden, und stellen diese nicht dar. Lesen Sie mehr in den Nutzungsbedingungen.