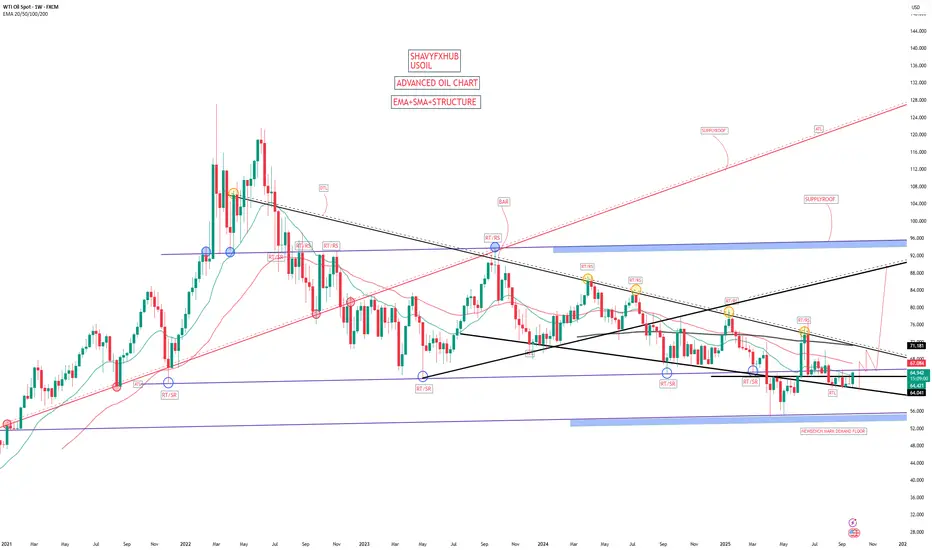
US OIL have a seen a sharp drop in price and buyers and opec kept April 2025 low at 54.93$-55$ zone and retested in the month of may 2025 at 54.93$-55$ zone ,this zone could be considered as weekly benchmark buying deman floor from our strategy.
As geopolitical tension cools off oil price surged but capped by long term descending trendline connecting as represented on the chart on weekly timeframe,at the moment we have bridged 64.041$ and it will expose 70.971$-71.82$ descending trendline acting as dynamic resistance to oil uprising for a long time .
if buyers and opec make critical change and demand exceeds supply then we are going long on the break of 70.971$-71.82$ into 88$-85$ zone before correction .
pls let me know if you like the analysis and if we have any error to help us win on oil forecast.
pls note that this is my perspective based on the strategy and it could have some error.
#oil #usoil #ukoil
Haftungsausschluss
Die Informationen und Veröffentlichungen sind nicht als Finanz-, Anlage-, Handels- oder andere Arten von Ratschlägen oder Empfehlungen gedacht, die von TradingView bereitgestellt oder gebilligt werden, und stellen diese nicht dar. Lesen Sie mehr in den Nutzungsbedingungen.
Haftungsausschluss
Die Informationen und Veröffentlichungen sind nicht als Finanz-, Anlage-, Handels- oder andere Arten von Ratschlägen oder Empfehlungen gedacht, die von TradingView bereitgestellt oder gebilligt werden, und stellen diese nicht dar. Lesen Sie mehr in den Nutzungsbedingungen.