USDT Dominance Weekly Chart Analysis
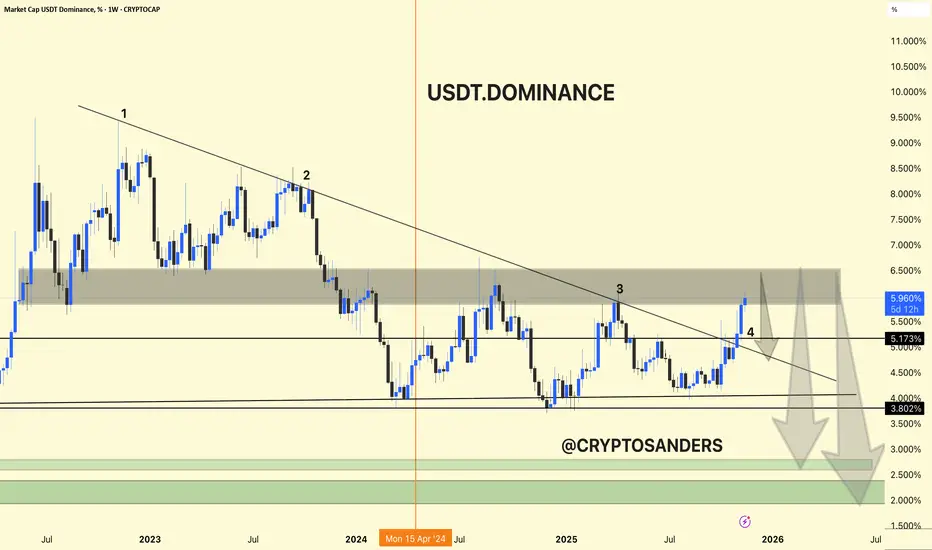
USDT dominance has been in a wide downtrend since mid-2022, repeatedly making lower highs along a major descending trendline.
Resistance Test: The dominance index is currently retesting the upper boundary of a key supply zone (5.5–6.2%), where it has previously faced sharp rejections (marked 1, 2, 3, 4).
Breakout Risk: Despite the latest rally, the price shows potential for another rejection at this supply zone, with the trendline acting as resistance.
Downside Projections: If rejected, USDT dominance may head for significant support near 4.0% and then 3.8%, with further targets at the green accumulation zone around 2.5–3.0%. This would suggest capital rotation out of stablecoins and back into crypto assets.
USDT dominance is at a major resistance, historically rejecting this trendline and zone. Another rejection here could mean reduced market fear and capital flowing back into riskier crypto assets. A sustained breakout above 6.2% would signal increased stablecoin preference and ongoing risk aversion.
DYOR | NFA
Verbundene Veröffentlichungen
Haftungsausschluss
Die Informationen und Veröffentlichungen sind nicht als Finanz-, Anlage-, Handels- oder andere Arten von Ratschlägen oder Empfehlungen gedacht, die von TradingView bereitgestellt oder gebilligt werden, und stellen diese nicht dar. Lesen Sie mehr in den Nutzungsbedingungen.