USDCAD 2-hour chart, here’s what can be observed and inferred technically:
🔍 Chart Analysis Summary:
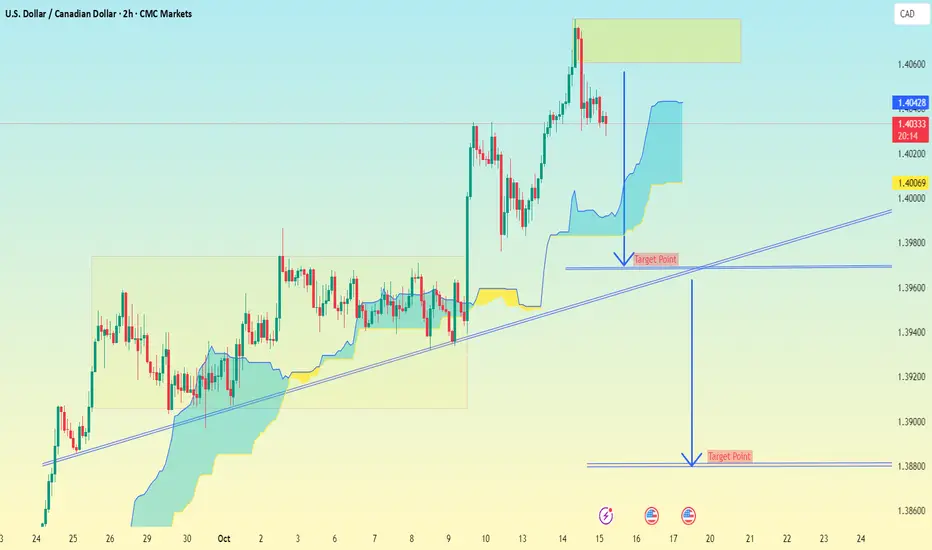
Pair: USD/CAD
Timeframe: 2H (2-hour)
Current price: ~1.4033
Trendline: Upward sloping (acting as dynamic support)
Recent action: Price broke out from consolidation, reached resistance near 1.4060–1.4080 zone, and started to pull back.
Cloud (Ichimoku): Currently price is above the Kumo cloud, but appears to be testing or potentially dipping into it.
---
🎯 Target Areas (based on your annotations and market structure)
1. Short-term target:
First Target Point: Around 1.4000–1.4009
This matches my chart annotation just above the ascending trendline.
Likely corresponds to minor support and a retest of the trendline area.
2. Extended / Swing Target:
Second Target Point: Around 1.3880–1.3890
This is marked as the lower "Target Point" on my chart.
It aligns with a deeper correction scenario if the trendline breaks cleanly and the bearish momentum extends.
That would fill the “measured move” drawn on my chart (projected from the previous range height).
---
⚠ Key Levels to Watch
Level Type Note
1.4080 Resistance Previous high / Supply zone
1.4000 Support / Target 1 Trendline + psychological round number
1.3880 Target 2 Full measured move projection
1.4060–1.4080 Sell Zone Potential retest area if price bounces
---
📉 Bias:
If the price breaks below 1.4000 (trendline support) and holds under the Kumo cloud, a move toward 1.3880 looks likely.
If it holds above 1.4000 and rebounds, the short-term correction could end there.
🔍 Chart Analysis Summary:
Pair: USD/CAD
Timeframe: 2H (2-hour)
Current price: ~1.4033
Trendline: Upward sloping (acting as dynamic support)
Recent action: Price broke out from consolidation, reached resistance near 1.4060–1.4080 zone, and started to pull back.
Cloud (Ichimoku): Currently price is above the Kumo cloud, but appears to be testing or potentially dipping into it.
---
🎯 Target Areas (based on your annotations and market structure)
1. Short-term target:
First Target Point: Around 1.4000–1.4009
This matches my chart annotation just above the ascending trendline.
Likely corresponds to minor support and a retest of the trendline area.
2. Extended / Swing Target:
Second Target Point: Around 1.3880–1.3890
This is marked as the lower "Target Point" on my chart.
It aligns with a deeper correction scenario if the trendline breaks cleanly and the bearish momentum extends.
That would fill the “measured move” drawn on my chart (projected from the previous range height).
---
⚠ Key Levels to Watch
Level Type Note
1.4080 Resistance Previous high / Supply zone
1.4000 Support / Target 1 Trendline + psychological round number
1.3880 Target 2 Full measured move projection
1.4060–1.4080 Sell Zone Potential retest area if price bounces
---
📉 Bias:
If the price breaks below 1.4000 (trendline support) and holds under the Kumo cloud, a move toward 1.3880 looks likely.
If it holds above 1.4000 and rebounds, the short-term correction could end there.
Trade ist aktiv
trade active📲 Join telegram channel free .
t.me/addlist/dg3uSwzkMSplNjFk
Forex, Gold & Crypto Signals with detailed analysis & get consistent results.
t.me/addlist/dg3uSwzkMSplNjFk
Gold Signal's with proper TP & SL for high profit opportunities.
t.me/addlist/dg3uSwzkMSplNjFk
Forex, Gold & Crypto Signals with detailed analysis & get consistent results.
t.me/addlist/dg3uSwzkMSplNjFk
Gold Signal's with proper TP & SL for high profit opportunities.
Verbundene Veröffentlichungen
Haftungsausschluss
Die Informationen und Veröffentlichungen sind nicht als Finanz-, Anlage-, Handels- oder andere Arten von Ratschlägen oder Empfehlungen gedacht, die von TradingView bereitgestellt oder gebilligt werden, und stellen diese nicht dar. Lesen Sie mehr in den Nutzungsbedingungen.
📲 Join telegram channel free .
t.me/addlist/dg3uSwzkMSplNjFk
Forex, Gold & Crypto Signals with detailed analysis & get consistent results.
t.me/addlist/dg3uSwzkMSplNjFk
Gold Signal's with proper TP & SL for high profit opportunities.
t.me/addlist/dg3uSwzkMSplNjFk
Forex, Gold & Crypto Signals with detailed analysis & get consistent results.
t.me/addlist/dg3uSwzkMSplNjFk
Gold Signal's with proper TP & SL for high profit opportunities.
Verbundene Veröffentlichungen
Haftungsausschluss
Die Informationen und Veröffentlichungen sind nicht als Finanz-, Anlage-, Handels- oder andere Arten von Ratschlägen oder Empfehlungen gedacht, die von TradingView bereitgestellt oder gebilligt werden, und stellen diese nicht dar. Lesen Sie mehr in den Nutzungsbedingungen.