Will the Dow Jones revisit the 43,340 level, or are we heading for a new high?
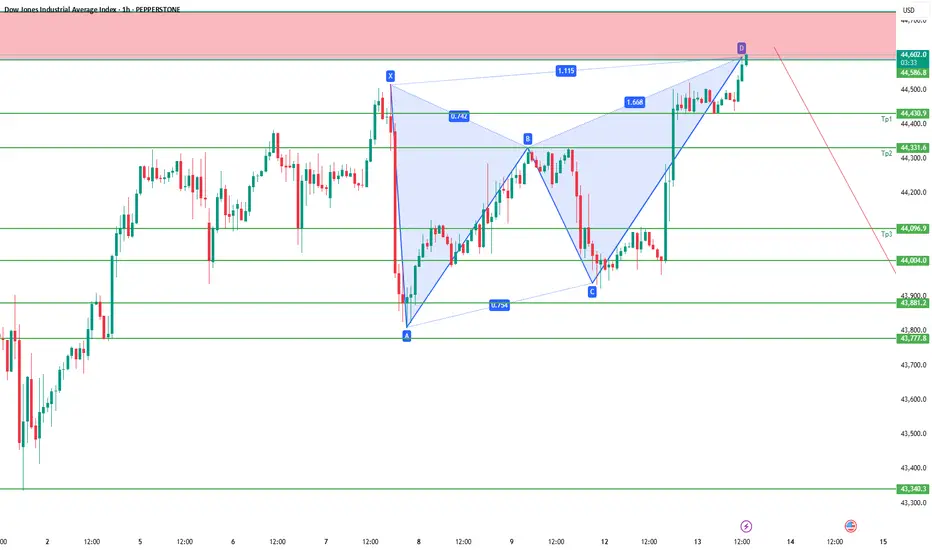
A Gartley pattern has formed on the Dow Jones, aligning with a supply zone between 44,585.00 – 44,725.00.
If the Dow stays below this zone, we will monitor price action on the 4-hour and daily charts for confirmation of a potential decline.
Expected downward targets based on price action:
1. 44,430.00
2. 44,330.00
3. 44,095.00
4. 44,000.00
5. 43,880.00
6. 43,775.00
7. 43,340.00
On the other hand, if the 44,725.00 level is broken and closed above, the Dow Jones is expected to move toward the historical high at 45,160.00.
A close above this level would signal a new high for the Dow.
Haftungsausschluss
Die Informationen und Veröffentlichungen sind nicht als Finanz-, Anlage-, Handels- oder andere Arten von Ratschlägen oder Empfehlungen gedacht, die von TradingView bereitgestellt oder gebilligt werden, und stellen diese nicht dar. Lesen Sie mehr in den Nutzungsbedingungen.
Haftungsausschluss
Die Informationen und Veröffentlichungen sind nicht als Finanz-, Anlage-, Handels- oder andere Arten von Ratschlägen oder Empfehlungen gedacht, die von TradingView bereitgestellt oder gebilligt werden, und stellen diese nicht dar. Lesen Sie mehr in den Nutzungsbedingungen.