Understanding liquidity, distribution phases and market-maker behavior
After the NASDAQ fell sharply from 25 000 to 24 000, many traders were surprised why the market suddenly stopped moving and started to “chop” around the same area.
But this behavior is not random — it’s a structural problem inside the order-flow.
1️⃣ Markets can fall fast — but they cannot continue without liquidity
Every trade in the market has a counter-party.
If traders want to buy the dip, someone must sell to them.
After a large drop, fewer participants are willing to sell at the new low prices.
Institutions are often already hedged or already sold during the fall.
Market makers cannot force liquidity out of thin air — they must create it.
This leads to a distribution phase, where price stops trending and starts rotating around a key area.
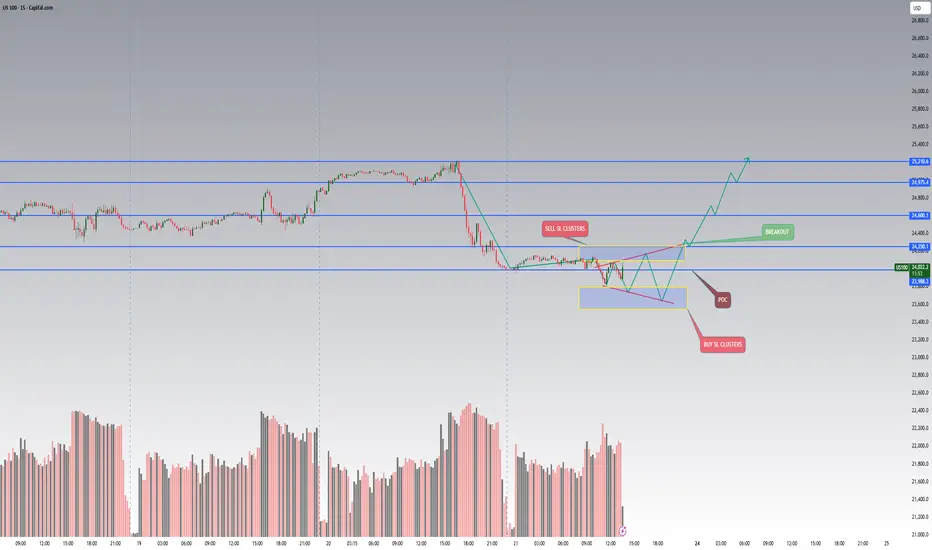
2️⃣ Why distribution forms around the Point of Control (POC)
When aggressive hedging is finished and volatility slows down, the market enters a phase where:
Price rotates around the Point of Control (POC)
Volume increases
Market makers attempt to rebuild liquidity on both sides of the range
This is not accumulation or re-accumulation — it is a liquidity-engineering phase.
Market makers need enough:
Buy-side liquidity above POC (stop losses of shorts, breakout traders, trapped buyers)
Sell-side liquidity below POC (stop losses of longs, late dip-buyers, liquidation clusters)
Without these pools, the market cannot initiate the next impulsive move.
3️⃣ The problem with sell-side liquidity after a big fall
When NAS dropped from 25k → 24k:
Most weak longs were already liquidated
Many sellers closed positions or took profit
Fresh shorts hesitate to enter at the lows
Institutions are waiting for better prices
This creates a liquidity vacuum.
To solve this vacuum, the market “mirrors” trades inside the range:
Price moves up → build stops above
Price moves down → build stops below
Repeated sweeps → fill both sides of liquidity
Only after enough stop-loss clusters form, the market is capable of moving again with real momentum.
4️⃣ What this means for traders
This is not a buy or sell signal.
It’s an explanation of why the market becomes extremely slow, sideways or manipulative after a big impulsive move.
In this phase:
Breakouts usually fail
Trend trading performs poorly
Range traps occur frequently
Market reacts strongly to liquidity pockets, not fundamentals
The key is to understand what the market is missing:
➡️ Not direction.
➡️ Not fundamentals.
➡️ But liquidity.
Until the liquidity pools are recreated, the next real directional move cannot start.
5️⃣ Final takeaway
A strong decline does not end because “buyers step in.”
It ends because no more sellers exist at those levels, forcing market makers to rotate price and rebuild the order-book.
Learning to identify these liquidity-reset periods helps traders avoid:
Chasing breakouts
Entering too early
Getting trapped during fake momentum
Misreading sideways distribution as a reversal
After the NASDAQ fell sharply from 25 000 to 24 000, many traders were surprised why the market suddenly stopped moving and started to “chop” around the same area.
But this behavior is not random — it’s a structural problem inside the order-flow.
1️⃣ Markets can fall fast — but they cannot continue without liquidity
Every trade in the market has a counter-party.
If traders want to buy the dip, someone must sell to them.
After a large drop, fewer participants are willing to sell at the new low prices.
Institutions are often already hedged or already sold during the fall.
Market makers cannot force liquidity out of thin air — they must create it.
This leads to a distribution phase, where price stops trending and starts rotating around a key area.
2️⃣ Why distribution forms around the Point of Control (POC)
When aggressive hedging is finished and volatility slows down, the market enters a phase where:
Price rotates around the Point of Control (POC)
Volume increases
Market makers attempt to rebuild liquidity on both sides of the range
This is not accumulation or re-accumulation — it is a liquidity-engineering phase.
Market makers need enough:
Buy-side liquidity above POC (stop losses of shorts, breakout traders, trapped buyers)
Sell-side liquidity below POC (stop losses of longs, late dip-buyers, liquidation clusters)
Without these pools, the market cannot initiate the next impulsive move.
3️⃣ The problem with sell-side liquidity after a big fall
When NAS dropped from 25k → 24k:
Most weak longs were already liquidated
Many sellers closed positions or took profit
Fresh shorts hesitate to enter at the lows
Institutions are waiting for better prices
This creates a liquidity vacuum.
To solve this vacuum, the market “mirrors” trades inside the range:
Price moves up → build stops above
Price moves down → build stops below
Repeated sweeps → fill both sides of liquidity
Only after enough stop-loss clusters form, the market is capable of moving again with real momentum.
4️⃣ What this means for traders
This is not a buy or sell signal.
It’s an explanation of why the market becomes extremely slow, sideways or manipulative after a big impulsive move.
In this phase:
Breakouts usually fail
Trend trading performs poorly
Range traps occur frequently
Market reacts strongly to liquidity pockets, not fundamentals
The key is to understand what the market is missing:
➡️ Not direction.
➡️ Not fundamentals.
➡️ But liquidity.
Until the liquidity pools are recreated, the next real directional move cannot start.
5️⃣ Final takeaway
A strong decline does not end because “buyers step in.”
It ends because no more sellers exist at those levels, forcing market makers to rotate price and rebuild the order-book.
Learning to identify these liquidity-reset periods helps traders avoid:
Chasing breakouts
Entering too early
Getting trapped during fake momentum
Misreading sideways distribution as a reversal
Sharing clean, logical market analysis focused on liquidity, structure and volume. No signals, no pressure — just education. If you want more insights, you’re welcome to join: t.me/CE3vdc5m72w4MjRk
Verbundene Veröffentlichungen
Haftungsausschluss
Die Informationen und Veröffentlichungen sind nicht als Finanz-, Anlage-, Handels- oder andere Arten von Ratschlägen oder Empfehlungen gedacht, die von TradingView bereitgestellt oder gebilligt werden, und stellen diese nicht dar. Lesen Sie mehr in den Nutzungsbedingungen.