📉 Chart Overview:
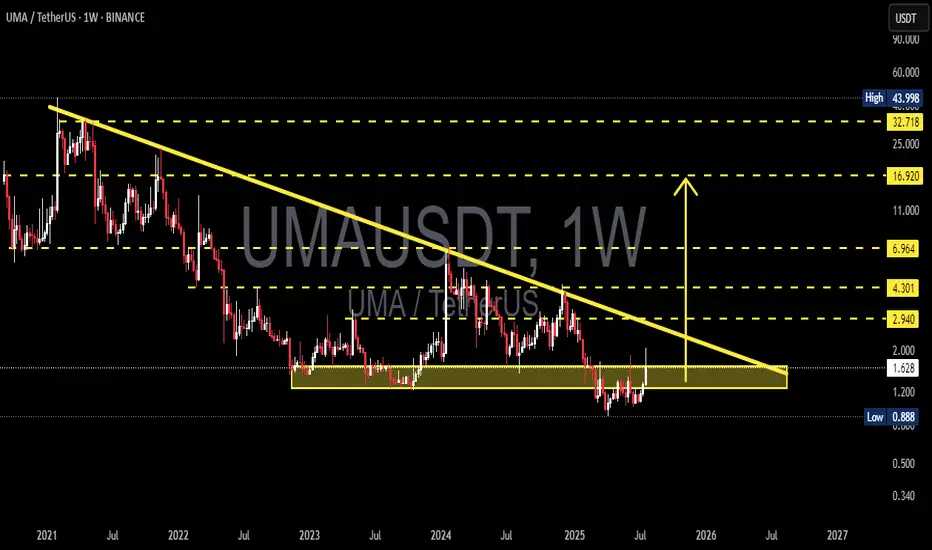
UMA/USDT has been in a long-term downtrend since its peak in 2021. For nearly three years, price action has been trapped within a descending triangle pattern, forming consistent lower highs while holding a strong horizontal support zone around $0.88 – $1.20.
Over the last two years, UMA has been consolidating sideways, creating a massive accumulation base. Now, the price is sitting just beneath the descending trendline, putting the asset in a critical compression zone — a potential breakout could trigger a major trend shift.
🔍 Technical Pattern Breakdown:
Multi-year Descending Triangle structure with a well-defined horizontal base.
Long-term accumulation zone between $0.88 – $1.20, repeatedly tested but not broken.
UMA is currently pressing against the descending resistance line, building pressure.
Setup hints at a compression breakout, often leading to explosive moves when volume confirms.
🟢 Bullish Scenario – If Breakout Confirms:
If UMA breaks out convincingly above the descending trendline (~$1.85) with a weekly candle close and strong volume, the market could start targeting these levels:
1. ✅ $2.94 – First horizontal resistance from prior breakdown zone.
2. ✅ $4.30 – Key structure from mid-2023.
3. ✅ $6.96 – Larger swing target from historical resistance.
4. 🚀 $16.92 – Mid-to-long term target if bullish momentum sustains.
5. 🎯 $32 – $43 – Potential long-term upside under extreme bullish conditions (not base scenario).
Bullish Confirmation Signs:
Weekly candle close above trendline + high volume
RSI breaks above 50 with momentum
Bitcoin remains stable or bullish
🔴 Bearish Scenario – If Rejected Again:
If UMA fails to break the trendline:
Price could drop back into support: $1.20 → $0.88
A breakdown below $0.88 would open the door to new all-time lows
Watch for wicks and volume drop as signs of weakness
When Is Breakout Considered Failed?
Strong rejection from $1.80–$1.90
Weekly close back below $1.20
Broader market (especially BTC) turns sharply bearish
🎯 Trader Strategy Outlook:
Swing traders: Wait for breakout confirmation and retest before entering.
Long-term investors: The $0.90–$1.20 range remains a solid accumulation zone with tight risk management.
Conservative traders: Avoid entry until a clear close above the descending trendline.
📌 Final Thoughts:
> UMA is now positioned at a major inflection point after two years of sideways compression. The chart structure shows clear signs of long-term accumulation, and a breakout could mark the beginning of a new bullish trend cycle. However, patience and confirmation are crucial — this is a setup worth watching, not chasing.
#UMAUSDT #UMA #CryptoBreakout #TechnicalAnalysis #DescendingTriangle #AltcoinSetup #SwingTradeOpportunity #CryptoAccumulation #BreakoutWatch #PriceAction
✅ Get Free Signals! Join Our Telegram Channel Here: t.me/TheCryptoNuclear
✅ Twitter: twitter.com/crypto_nuclear
✅ Join Bybit : partner.bybit.com/b/nuclearvip
✅ Benefits : Lifetime Trading Fee Discount -50%
✅ Twitter: twitter.com/crypto_nuclear
✅ Join Bybit : partner.bybit.com/b/nuclearvip
✅ Benefits : Lifetime Trading Fee Discount -50%
Haftungsausschluss
Die Informationen und Veröffentlichungen sind nicht als Finanz-, Anlage-, Handels- oder andere Arten von Ratschlägen oder Empfehlungen gedacht, die von TradingView bereitgestellt oder gebilligt werden, und stellen diese nicht dar. Lesen Sie mehr in den Nutzungsbedingungen.