Breakdown (what the chart shows):
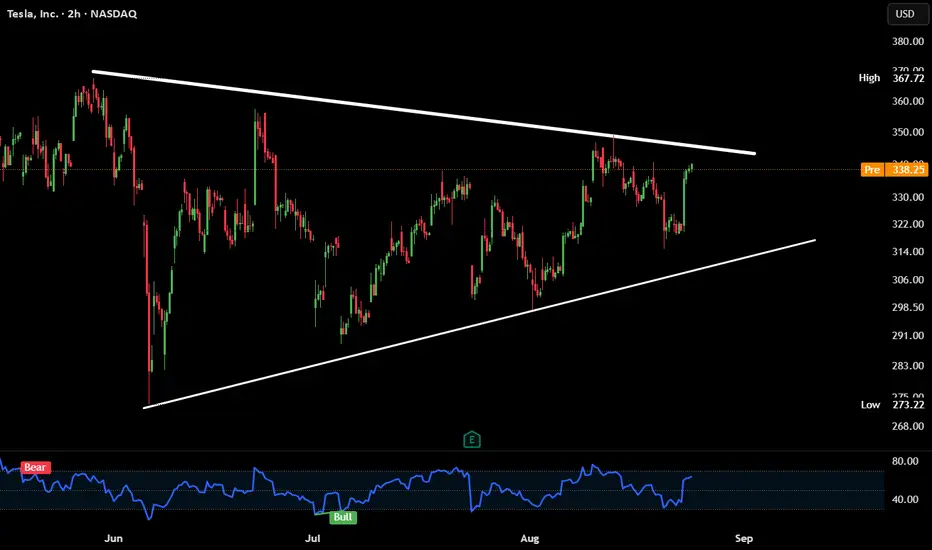
Tesla is forming a symmetrical triangle on the 2H chart. Price is squeezing between higher lows and lower highs.
Currently testing resistance near $338–340. Breakout or rejection incoming.
Confluence:
1. RSI bouncing back from near oversold → bullish momentum returning.
CTA :
Which way do you think it breaks — up or down?
Would you trade the breakout or fade the first move?
Haftungsausschluss
Die Informationen und Veröffentlichungen sind nicht als Finanz-, Anlage-, Handels- oder andere Arten von Ratschlägen oder Empfehlungen gedacht, die von TradingView bereitgestellt oder gebilligt werden, und stellen diese nicht dar. Lesen Sie mehr in den Nutzungsbedingungen.
Haftungsausschluss
Die Informationen und Veröffentlichungen sind nicht als Finanz-, Anlage-, Handels- oder andere Arten von Ratschlägen oder Empfehlungen gedacht, die von TradingView bereitgestellt oder gebilligt werden, und stellen diese nicht dar. Lesen Sie mehr in den Nutzungsbedingungen.