📊 TSLA Technical Analysis (Daily Timeframe)
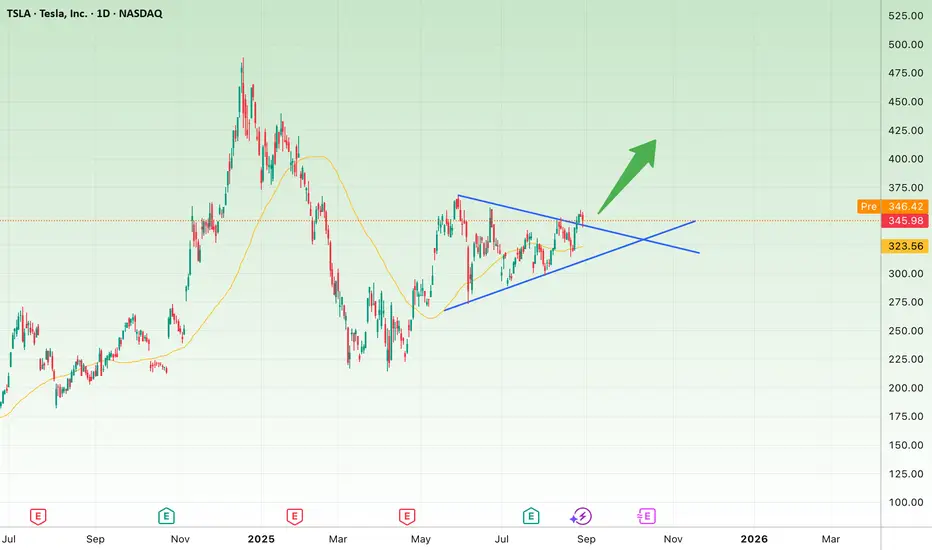
After a period of consolidation inside a Symmetrical Triangle, Tesla’s price is now showing a potential breakout to the upside. This could be an early signal for the beginning of a new bullish wave.
🔹 Key Support: $323 – $325
🔹 Next Resistances: $375 and, if broken, higher targets at $400 – $420
The 50-day moving average is currently supporting the uptrend, and a confirmed close above the $346 level would strengthen the bullish outlook.
⚠️ However, if the price fails and breaks below $323, the bullish scenario may lose validity and a corrective move could follow.
Haftungsausschluss
Die Informationen und Veröffentlichungen sind nicht als Finanz-, Anlage-, Handels- oder andere Arten von Ratschlägen oder Empfehlungen gedacht, die von TradingView bereitgestellt oder gebilligt werden, und stellen diese nicht dar. Lesen Sie mehr in den Nutzungsbedingungen.
Haftungsausschluss
Die Informationen und Veröffentlichungen sind nicht als Finanz-, Anlage-, Handels- oder andere Arten von Ratschlägen oder Empfehlungen gedacht, die von TradingView bereitgestellt oder gebilligt werden, und stellen diese nicht dar. Lesen Sie mehr in den Nutzungsbedingungen.