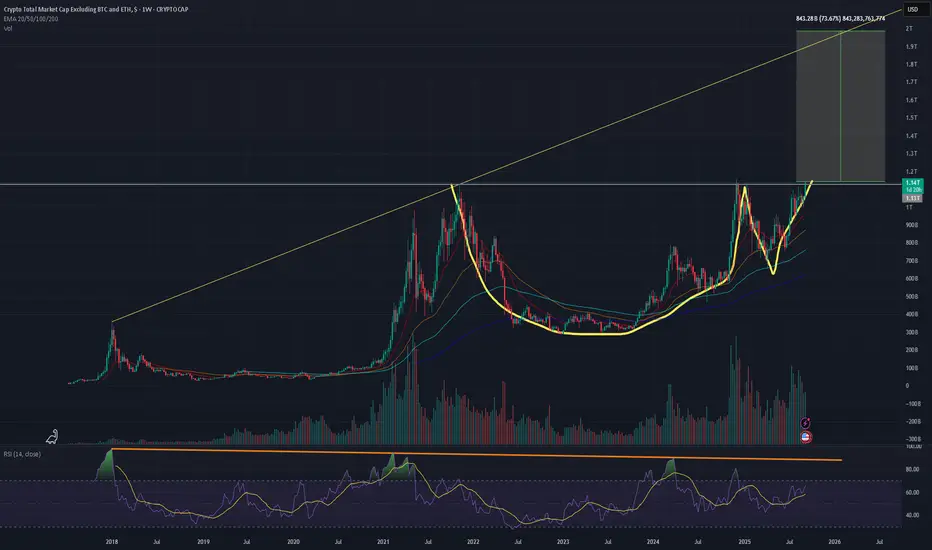
The total3 chart printed a high timeframe cup and handle formation and it looks like a breakout is imminent, but we could get some sideways action for a few weeks as well.
The measured move from this formation takes the market cap to $2 trillion, which looks like it will align with the ATH trendline, assuming the pump peaks in 3-6 months.
The BTC.D chart is breaking down as well which is a great sign.
My main concern is the USDT.D chart that's approaching strong support. Will that support stall alt season or stop it entirely? I think there's enough bullish signs to create the momentum that'll make this alt season take off.
Boost this post if you found it helpful.
Haftungsausschluss
Die Informationen und Veröffentlichungen sind nicht als Finanz-, Anlage-, Handels- oder andere Arten von Ratschlägen oder Empfehlungen gedacht, die von TradingView bereitgestellt oder gebilligt werden, und stellen diese nicht dar. Lesen Sie mehr in den Nutzungsbedingungen.
Haftungsausschluss
Die Informationen und Veröffentlichungen sind nicht als Finanz-, Anlage-, Handels- oder andere Arten von Ratschlägen oder Empfehlungen gedacht, die von TradingView bereitgestellt oder gebilligt werden, und stellen diese nicht dar. Lesen Sie mehr in den Nutzungsbedingungen.