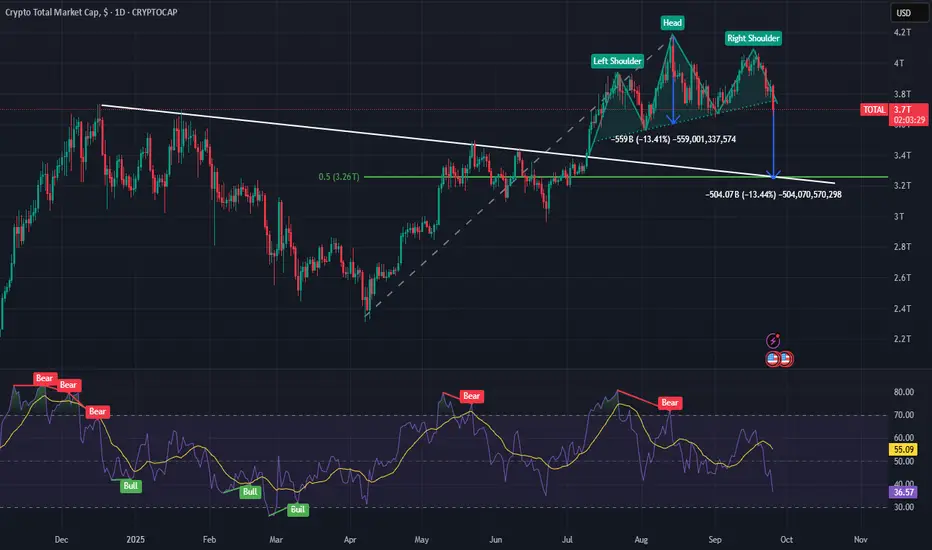
TOTAL chart appears to be forming a Head and Shoulders pattern, which typically signals a potential bearish reversal. Based on the recent high observed on 14 August 2025, the percentage decline from that peak to the neckline of the pattern is approximately 13.4%. If this pattern plays out as expected, it suggests a further downside of around 13.4%, equating to roughly $500 billion, which would bring TOTAL’s market cap down to approximately $3.26 trillion.
This target level is supported by two key technical confluences:
- A long-term trendline connecting major pivot highs dating back to 17 December 2024
- 50% Fibonacci retracement level, often considered a significant support zone
Given these factors, the probability of a continued decline appears high, and further downside pressure may be imminent.
Haftungsausschluss
Die Informationen und Veröffentlichungen sind nicht als Finanz-, Anlage-, Handels- oder andere Arten von Ratschlägen oder Empfehlungen gedacht, die von TradingView bereitgestellt oder gebilligt werden, und stellen diese nicht dar. Lesen Sie mehr in den Nutzungsbedingungen.
Haftungsausschluss
Die Informationen und Veröffentlichungen sind nicht als Finanz-, Anlage-, Handels- oder andere Arten von Ratschlägen oder Empfehlungen gedacht, die von TradingView bereitgestellt oder gebilligt werden, und stellen diese nicht dar. Lesen Sie mehr in den Nutzungsbedingungen.