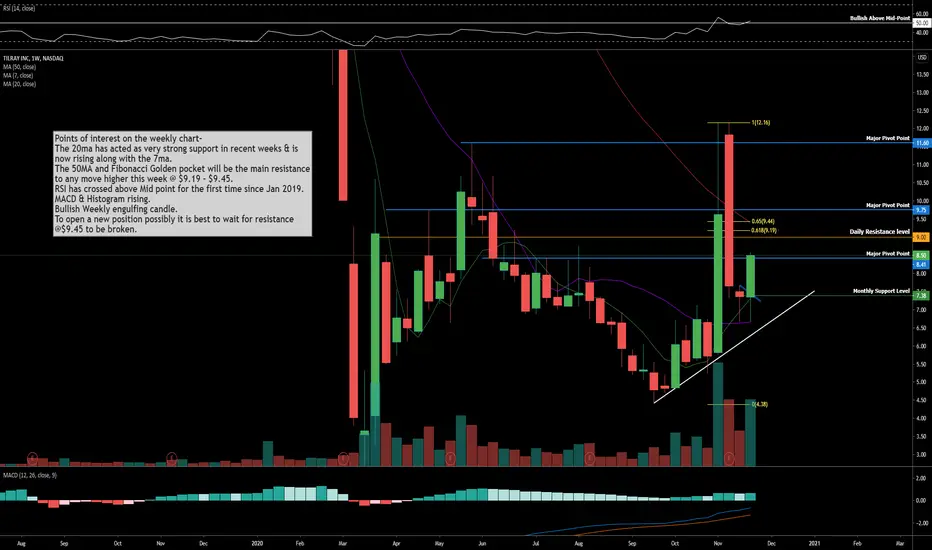
The 20ma has acted as very strong support in recent weeks & is
now rising along with the 7ma.
The 50MA and Fibonacci Golden pocket will be the main resistance
to any move higher this week @ $9.19 - $9.45.
RSI has crossed above Mid point for the first time since Jan 2019.
MACD & Histogram rising.
Bullish Weekly engulfing candle.
To open a new position possibly it is best to wait for resistance
@$9.45 to be broken.
Anmerkung
Anmerkung
The Monthly candle close is so important, expect quite a battle on Monday. Closing above the 8ema 7 ma would be a huge win for bulls.Haftungsausschluss
Die Informationen und Veröffentlichungen sind nicht als Finanz-, Anlage-, Handels- oder andere Arten von Ratschlägen oder Empfehlungen gedacht, die von TradingView bereitgestellt oder gebilligt werden, und stellen diese nicht dar. Lesen Sie mehr in den Nutzungsbedingungen.
Haftungsausschluss
Die Informationen und Veröffentlichungen sind nicht als Finanz-, Anlage-, Handels- oder andere Arten von Ratschlägen oder Empfehlungen gedacht, die von TradingView bereitgestellt oder gebilligt werden, und stellen diese nicht dar. Lesen Sie mehr in den Nutzungsbedingungen.