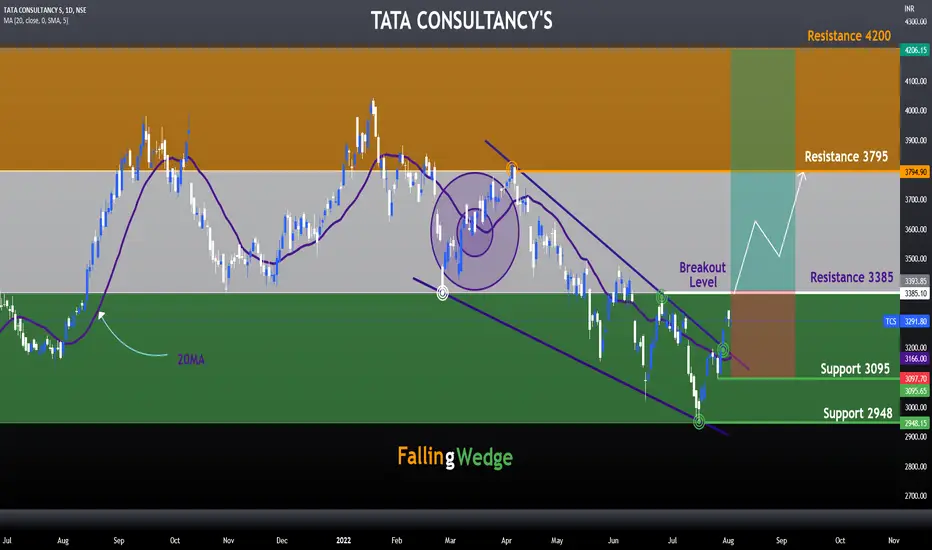
In a daily time frame, TCS was observed in Falling Wedge Pattern Structure and Breakout also has done
The falling wedge is a bullish price pattern that represents a story about the market in which bulls are preparing for another push. A falling wedge pattern is bullish , although it appears after a bearish trend .The falling wedge pattern works as both a trend work as a trend reversal and a trend continuation pattern.If the falling wedge appears in a downtrend, it is considered a reversal pattern.
A falling wedge is an important technical formation that signals that the correction, or consolidation, has just ended as the asset’s price left the wedge to the upside and, in most cases, the continuation of the overall trend is taking place.
In Current structure we can see that the price has been higher than the 20 MA level ,which is good sign for Bullish and also price has given breakout above the resistance level talong with good volume accumulation.
Currently, TCS is at 3291 Rs , If the pattern continues , the price of TCS might reach the 3795 Rs level . If the trend reversed, then the price of TCS may fall to 3095 Rs level
Key Factor
Falling Wedge - Bullish Reversal Pattern
20MA - Price above 20 MA
Happy Trading ! Jai Hind !
Haftungsausschluss
Die Informationen und Veröffentlichungen sind nicht als Finanz-, Anlage-, Handels- oder andere Arten von Ratschlägen oder Empfehlungen gedacht, die von TradingView bereitgestellt oder gebilligt werden, und stellen diese nicht dar. Lesen Sie mehr in den Nutzungsbedingungen.
Haftungsausschluss
Die Informationen und Veröffentlichungen sind nicht als Finanz-, Anlage-, Handels- oder andere Arten von Ratschlägen oder Empfehlungen gedacht, die von TradingView bereitgestellt oder gebilligt werden, und stellen diese nicht dar. Lesen Sie mehr in den Nutzungsbedingungen.