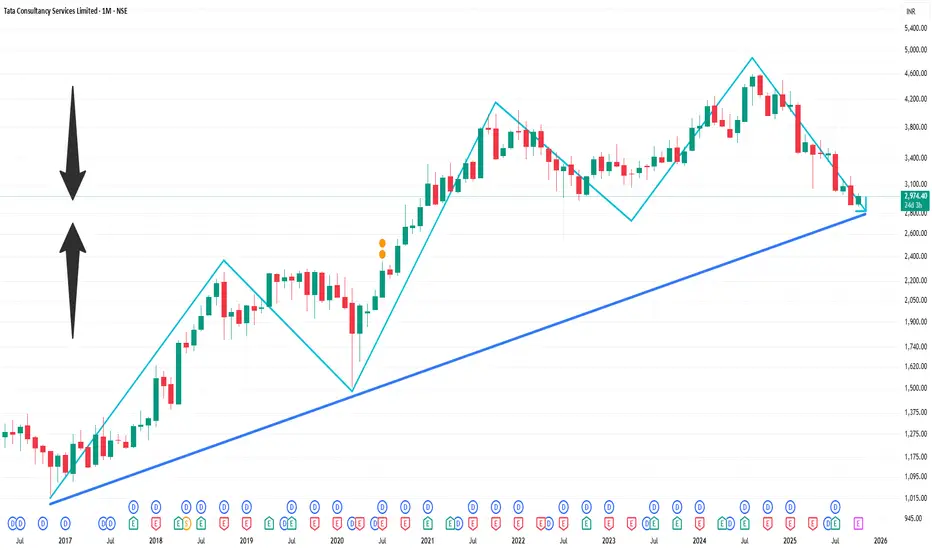
📉 Technical Overview (1-Month Timeframe)
Price Range: ₹2,867.55 – ₹3,202.95
Current Price: ₹2,962.
Trend: Bearish
According to TradingView, the 1-month technical analysis for TCS indicates a neutral outlook. However, moving averages suggest a strong sell signal. Oscillators are neutral, and pivot points are not specified.
🔍 Key Technical Indicators
Relative Strength Index (RSI): Not specified.
Moving Averages: Short-term and long-term moving averages indicate a bearish trend.
MACD: Not specified.
Pivot Points: Not specified.
🔮 Short-Term Outlook
Analysts forecast that TCS may reach ₹2,953.43 within a week and ₹2,707.65 within four weeks.
⚠️ Conclusion
The current technical indicators suggest a bearish trend for TCS over the past month. Investors should exercise caution and consider these factors when making investment decisions.
Verbundene Veröffentlichungen
Haftungsausschluss
Die Informationen und Veröffentlichungen sind nicht als Finanz-, Anlage-, Handels- oder andere Arten von Ratschlägen oder Empfehlungen gedacht, die von TradingView bereitgestellt oder gebilligt werden, und stellen diese nicht dar. Lesen Sie mehr in den Nutzungsbedingungen.