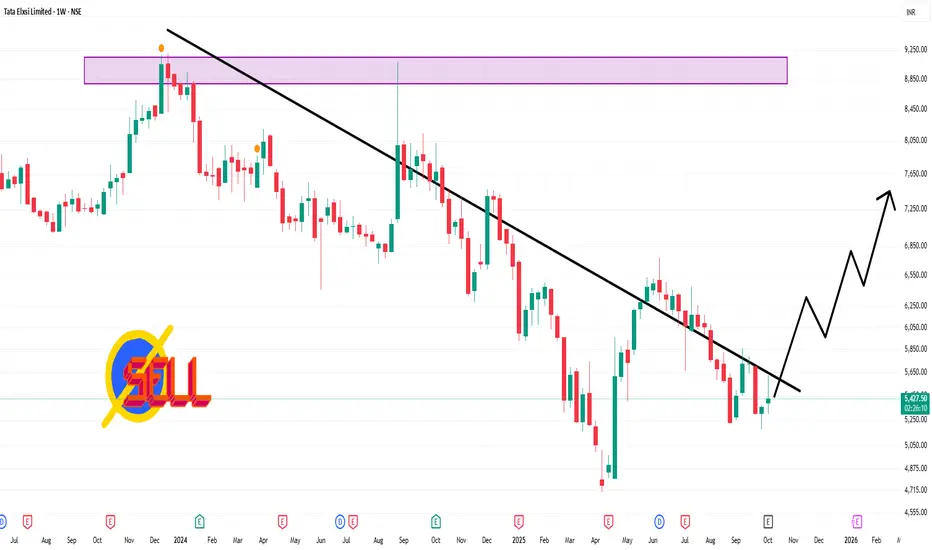
📉 Technical Outlook (Weekly Timeframe)
Technical Rating: The prevailing trend is a strong sell, supported by indicators such as moving averages and oscillators.
Pivot Levels:
Weekly Pivot Point: ₹5,300.33
Support Levels:
S1: ₹5,272.75
S2: ₹5,106.83
Resistance Levels:
R1: ₹5,493.83
R2: ₹5,618.17
Central Pivot Range: ₹5,272.75 – ₹5,300.33 – ₹5,327.92
Relative Strength Index (RSI): The 14-day RSI is approximately 48.6, indicating a neutral condition.
Moving Averages:
50-day MA: ₹5,362.89 (Buy)
200-day MA: ₹5,503.06 (Sell)
5-day MA: ₹5,468.50 (Sell)
10-day MA: ₹5,502.65 (Sell)
20-day MA: ₹5,468.57 (Sell)
Verbundene Veröffentlichungen
Haftungsausschluss
Die Informationen und Veröffentlichungen sind nicht als Finanz-, Anlage-, Handels- oder andere Arten von Ratschlägen oder Empfehlungen gedacht, die von TradingView bereitgestellt oder gebilligt werden, und stellen diese nicht dar. Lesen Sie mehr in den Nutzungsbedingungen.