TAO Chart Analysis
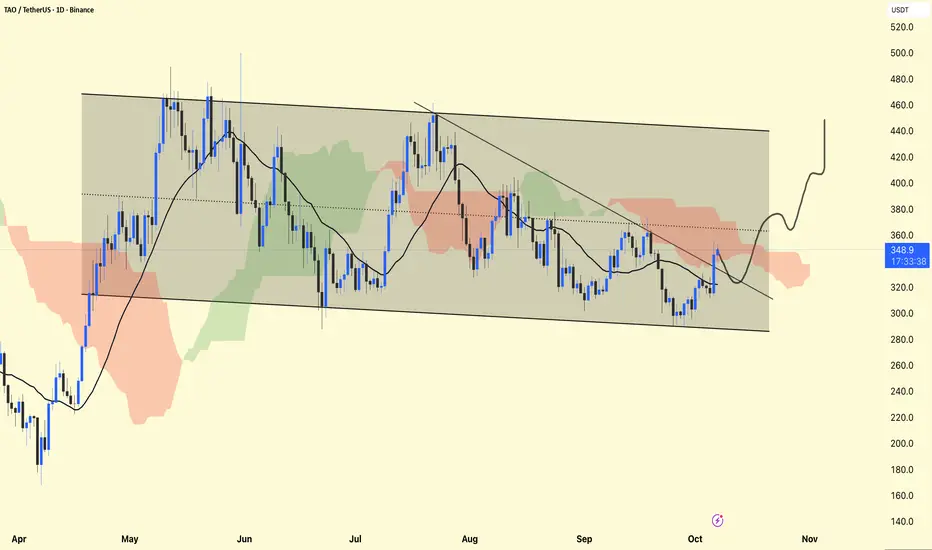
Overall Structure: The price is moving within a descending channel (marked by the shaded area). This reflects a broader bearish trend over the past several months.
Short-Term Momentum: Recently, the price has bounced off the lower channel boundary around $300 and is attempting to break the short-term downtrend line.
Support and Resistance
Support Levels:
~$320 (recent consolidation and channel bottom area)
~$300 (strong lower channel boundary)
Resistance Levels:
~$360 (current short-term downtrend line and Ichimoku Cloud resistance)
~$400 (upper channel boundary)
~$440–450 (previous highs, upper channel line)
Ichimoku Cloud:
Currently, the price is entering the red cloud – a potential resistance area.
If the price closes above the cloud (~$360–370), it could signal a trend reversal.
Moving Averages: The price is slightly above the short-term moving averages, which indicates a near-term uptrend.
The projection shown shows a potential breakout above the descending channel, initially targeting the $400–420 area.
A successful breakout accompanied by broad volume could shift the medium-term trend from bearish to bullish.
DYOR | NFA
Verbundene Veröffentlichungen
Haftungsausschluss
Die Informationen und Veröffentlichungen sind nicht als Finanz-, Anlage-, Handels- oder andere Arten von Ratschlägen oder Empfehlungen gedacht, die von TradingView bereitgestellt oder gebilligt werden, und stellen diese nicht dar. Lesen Sie mehr in den Nutzungsbedingungen.