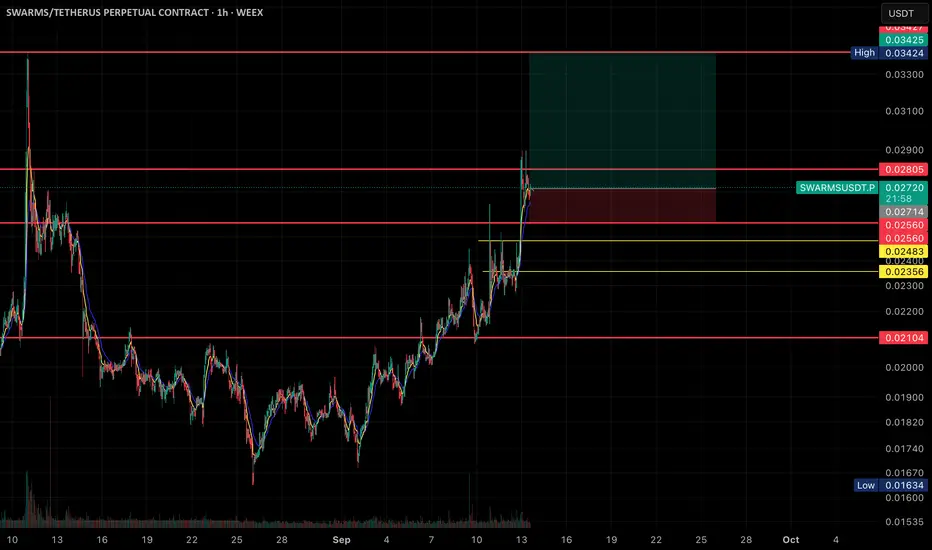
Pair/Contract: SWARMS/USDT Perpetual Contract (1H timeframe, WEEX).
• Current Price: ~0.02719 USDT (+3.19%).
• Price Action:
• The chart shows a strong uptrend with higher highs and higher lows from early September.
• Price recently broke above a key resistance around 0.02714 – 0.02805, now acting as support.
• Setup:
• A long trade position is highlighted.
• Entry Zone: around current price (0.02719).
• Stop-loss: placed below the breakout zone, around 0.02560.
• Target Zone: ~0.03324 (upper resistance area).
• Support & Resistance Levels:
• Resistance: 0.02805, 0.03424.
• Supports: 0.02714, 0.02560, 0.02483, 0.02400, 0.02356, and a major support at 0.02104.
• Risk/Reward:
• The highlighted green/red box shows a favorable risk-to-reward ratio (larger upside potential vs downside).
• Indicators: Short-term moving averages are aligned upward, supporting bullish momentum.
📈 In summary: The chart is showing a bullish breakout setup where the price has pushed above resistance, with upside potential toward the 0.033+ zone, while stop-loss is set just below the breakout level.
Haftungsausschluss
Die Informationen und Veröffentlichungen sind nicht als Finanz-, Anlage-, Handels- oder andere Arten von Ratschlägen oder Empfehlungen gedacht, die von TradingView bereitgestellt oder gebilligt werden, und stellen diese nicht dar. Lesen Sie mehr in den Nutzungsbedingungen.
Haftungsausschluss
Die Informationen und Veröffentlichungen sind nicht als Finanz-, Anlage-, Handels- oder andere Arten von Ratschlägen oder Empfehlungen gedacht, die von TradingView bereitgestellt oder gebilligt werden, und stellen diese nicht dar. Lesen Sie mehr in den Nutzungsbedingungen.