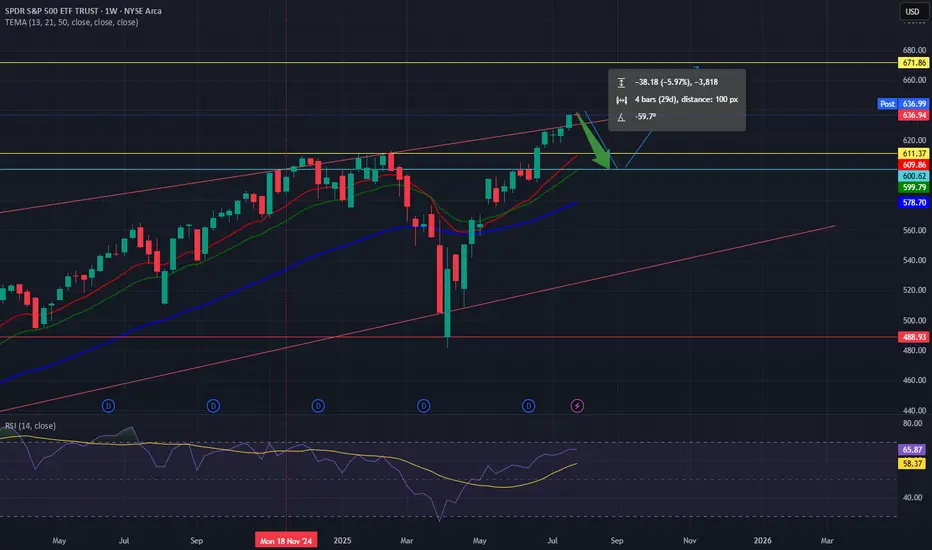
SPY Weekly Chart Overview (Current Price: ~637)
🧭 Context:
Indicators: TEMA (13/21/50) & RSI (14)
Price is extended, RSI near overbought (65.87), and forming a rising wedge — a bearish pattern.
🔻 Bearish Setup: Rising wedge signals possible reversal.
Momentum weakening despite higher highs.
Price extended above TEMA — a 600–610 pullback looks likely.
📊 Key Levels:Resistance: 672
Support: 611–600 → 578 → 488
Break below 600 could trigger broad downside.
🟢 Bullish Case:
Breakout above 672 with volume = momentum continuation (AI/FOMO driven).
🎯 Conclusion:
SPY is technically stretched. Risk/reward favors caution.
Watch for pullback to 600–610
Haftungsausschluss
Die Informationen und Veröffentlichungen sind nicht als Finanz-, Anlage-, Handels- oder andere Arten von Ratschlägen oder Empfehlungen gedacht, die von TradingView bereitgestellt oder gebilligt werden, und stellen diese nicht dar. Lesen Sie mehr in den Nutzungsbedingungen.
Haftungsausschluss
Die Informationen und Veröffentlichungen sind nicht als Finanz-, Anlage-, Handels- oder andere Arten von Ratschlägen oder Empfehlungen gedacht, die von TradingView bereitgestellt oder gebilligt werden, und stellen diese nicht dar. Lesen Sie mehr in den Nutzungsbedingungen.