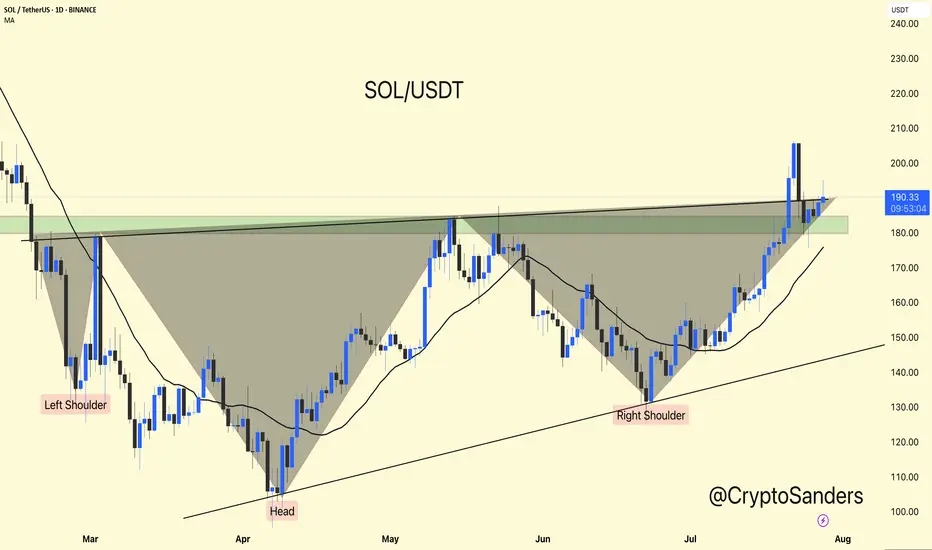
Solana has completed a classic Inverse Head and Shoulders pattern, breaking out above the neckline near the $185–$190 zone.
Currently holding above the breakout zone, showing bullish strength.
As long as SOL stays above the neckline support, continuation toward $210–$230 remains likely.
Trend remains strong above the moving average.
Stay updated and manage your risk accordingly.
DYOR | NFA
Currently holding above the breakout zone, showing bullish strength.
As long as SOL stays above the neckline support, continuation toward $210–$230 remains likely.
Trend remains strong above the moving average.
Stay updated and manage your risk accordingly.
DYOR | NFA
Verbundene Veröffentlichungen
Haftungsausschluss
Die Informationen und Veröffentlichungen sind nicht als Finanz-, Anlage-, Handels- oder andere Arten von Ratschlägen oder Empfehlungen gedacht, die von TradingView bereitgestellt oder gebilligt werden, und stellen diese nicht dar. Lesen Sie mehr in den Nutzungsbedingungen.