🔍 Current Positioning
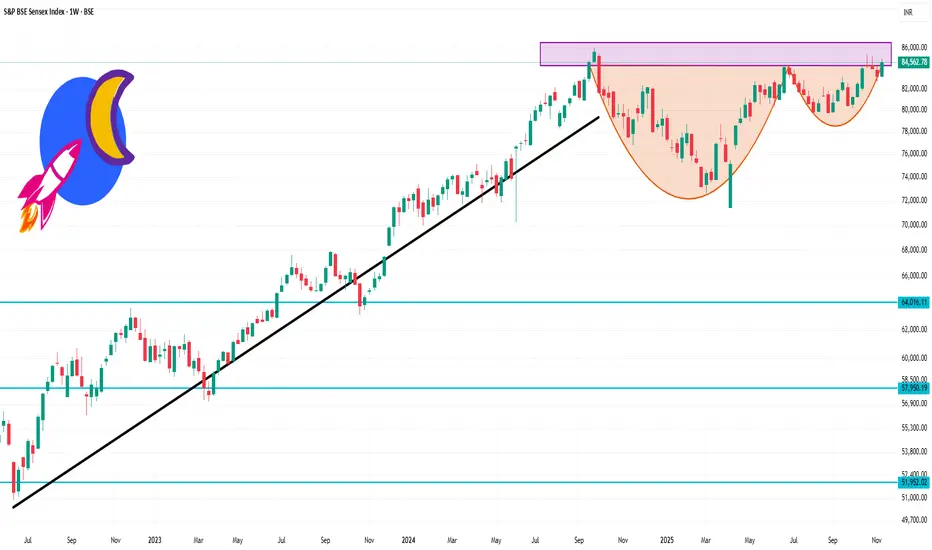
The index is currently trading in the ~ ₹84,500 zone.
Its 52-week high is around ₹85,290 and 52-week low is around ₹71,425.
On a weekly basis it has shown modest upward movement (~1–2 %) in the last week.
📏 Key Levels to Watch (Weekly)
Here are approximate levels to monitor for structure, support/resistance and trading bias:
Resistance zone: ~ ₹85,500–₹86,000 — near the recent highs and potential supply area.
Pivot / mid-zone: ~ ₹84,000–₹84,500 — where the index is currently hovering; acts as short-term equilibrium.
Initial support zone: ~ ₹83,000–₹83,500 — if weekly closes dip below this, risk of deeper correction increases.
Deeper support zone: ~ ₹80,000–₹81,000 — a major support on weekly view, if structure breaks lower.
📊 Weekly Structure & Bias
Because the index is near the highs, the weekly structure suggests caution: upside potential exists, but risk of consolidation or pull-back is higher given the proximity to resistance.
If we see a weekly close above ~₹85,500 with strong momentum, the bullish bias gains strength.
Conversely, a weekly break and close below ~₹83,000 would tilt structure towards a corrective phase and shift bias more neutral to bearish.
At present, the bias is moderately bullish but conditioned on support holding (i.e., above ~₹83K zone).
Verbundene Veröffentlichungen
Haftungsausschluss
Die Informationen und Veröffentlichungen sind nicht als Finanz-, Anlage-, Handels- oder andere Arten von Ratschlägen oder Empfehlungen gedacht, die von TradingView bereitgestellt oder gebilligt werden, und stellen diese nicht dar. Lesen Sie mehr in den Nutzungsbedingungen.